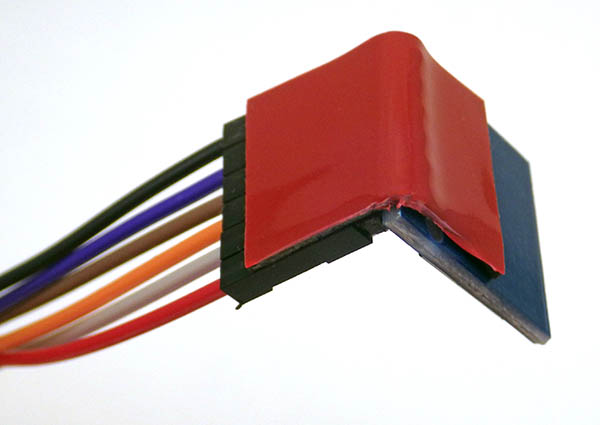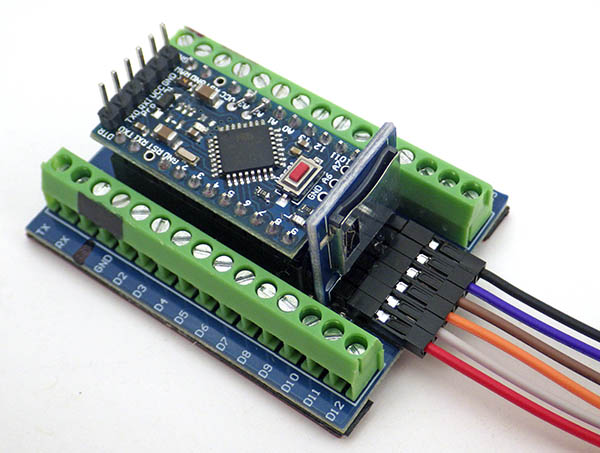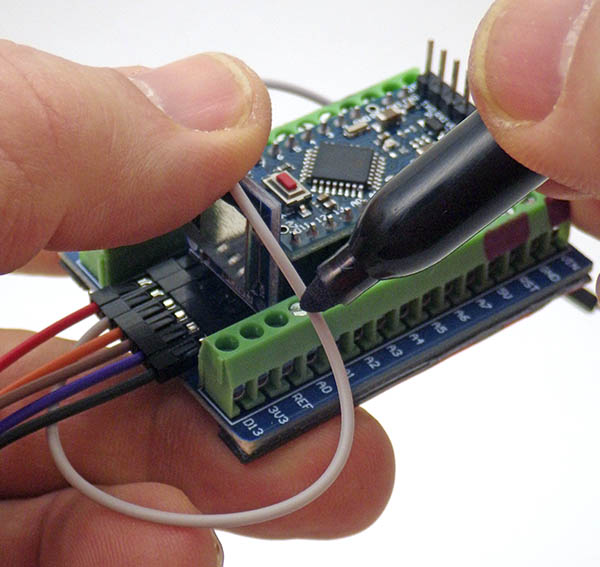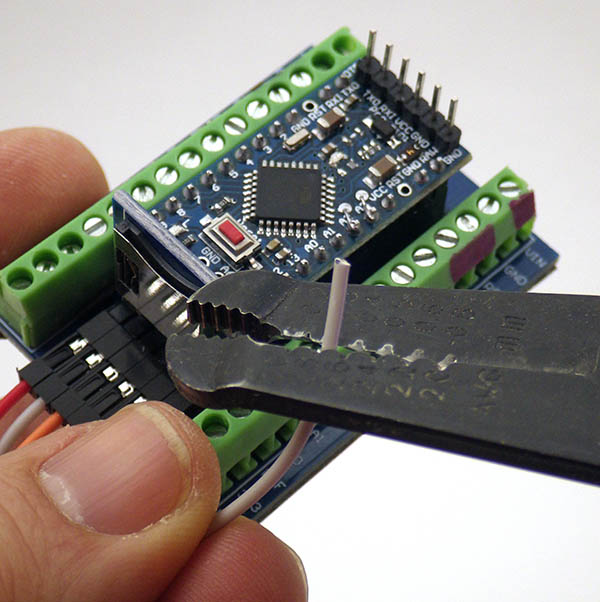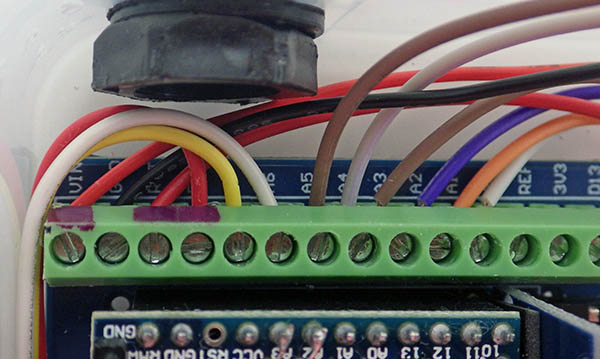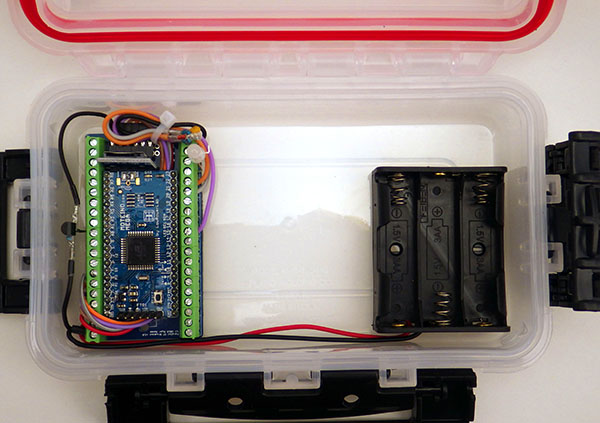
2-Part ProMini Logger that runs >1 year on a Coin Cell [2022]

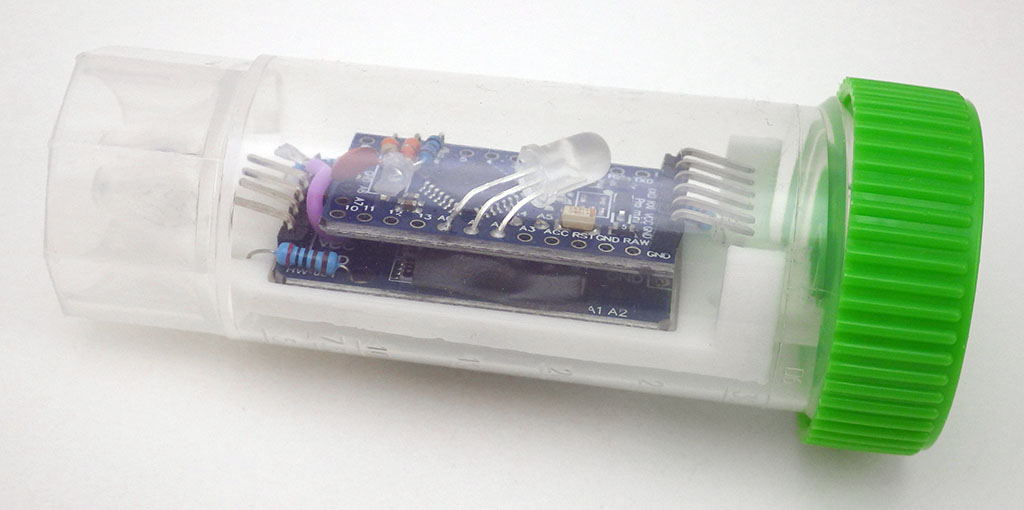
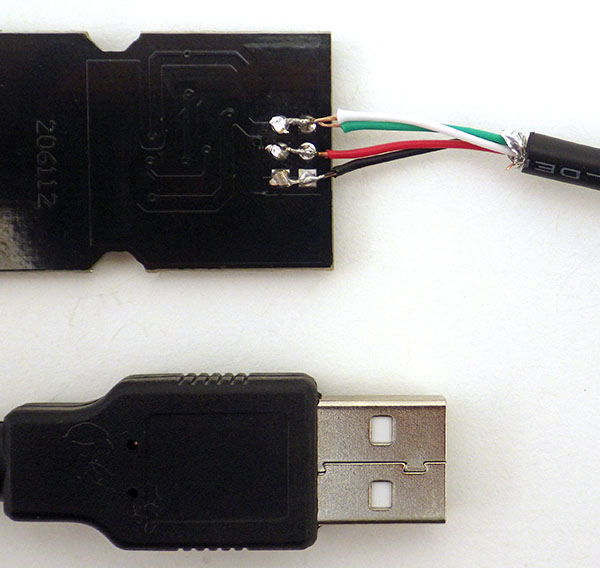
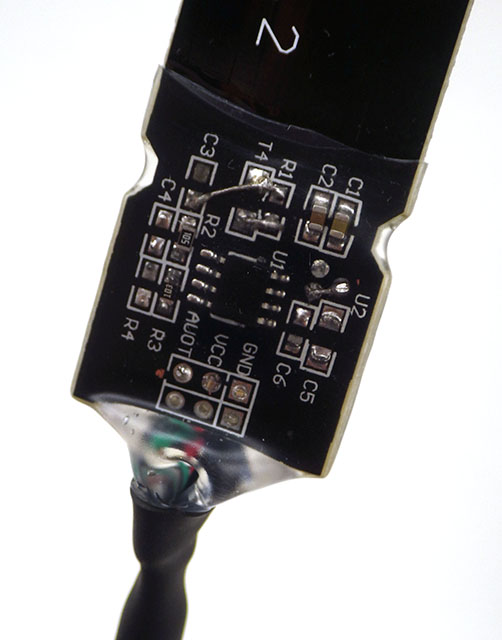
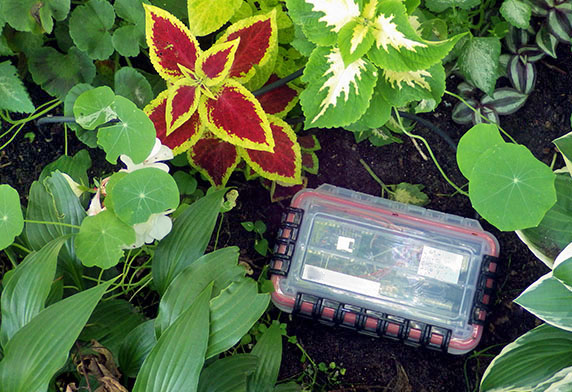
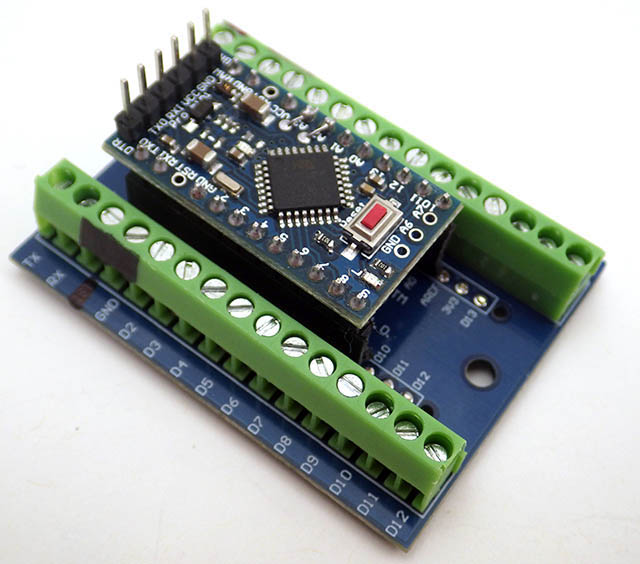
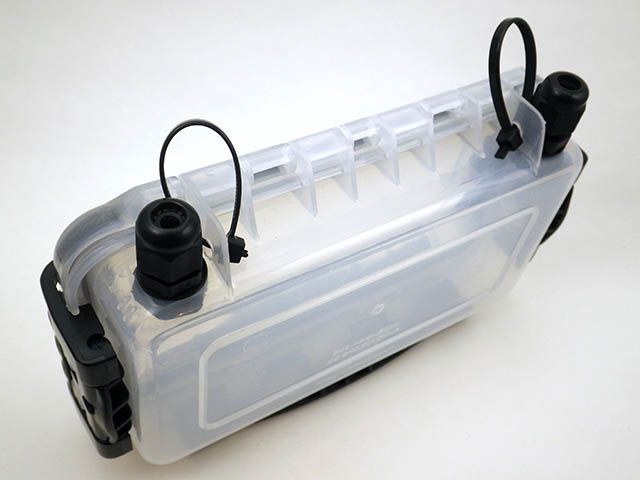
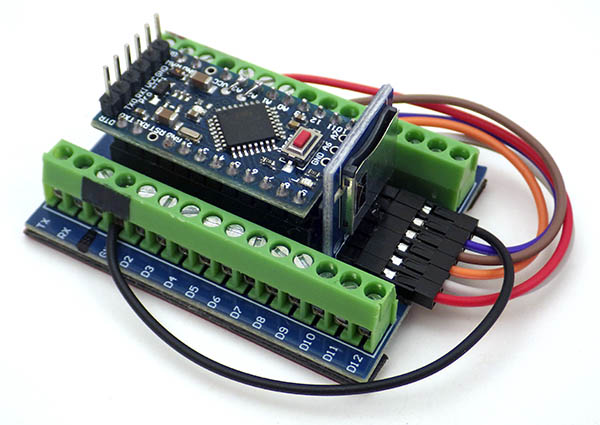
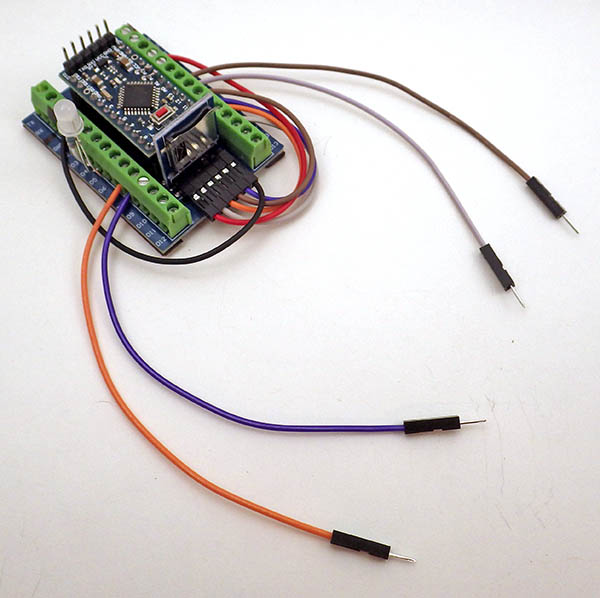
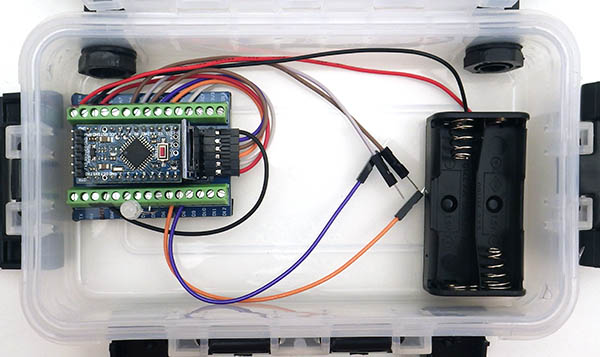
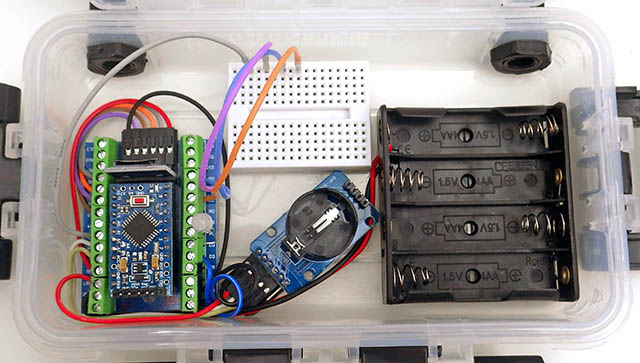
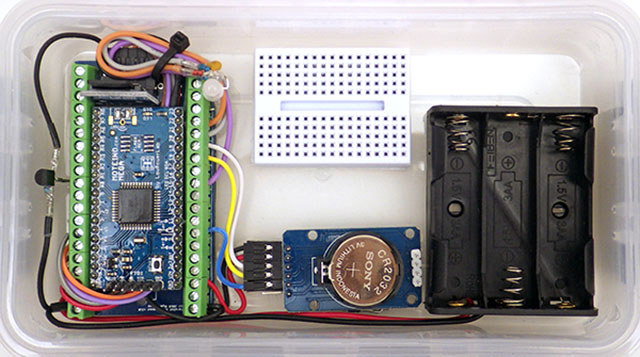
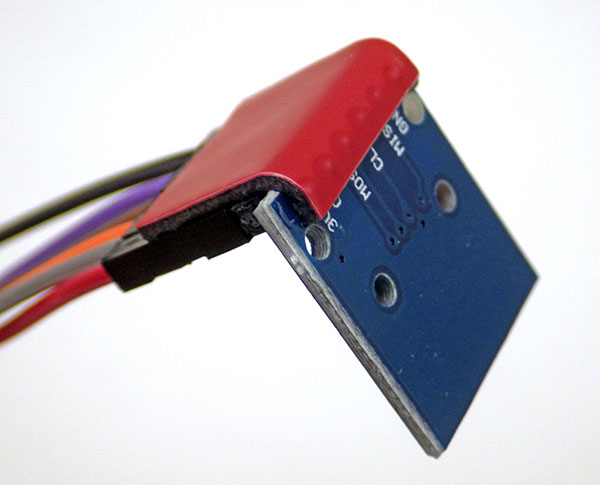
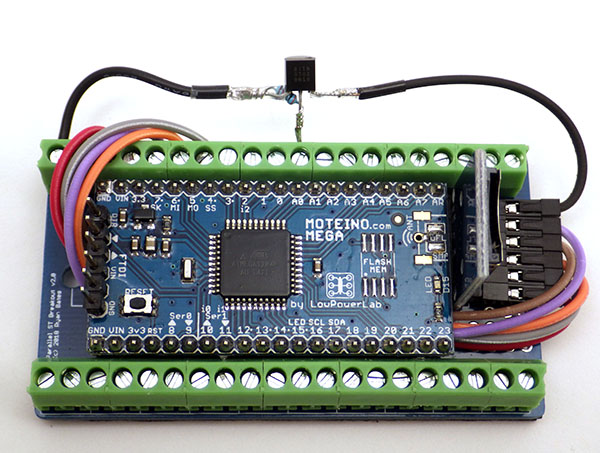
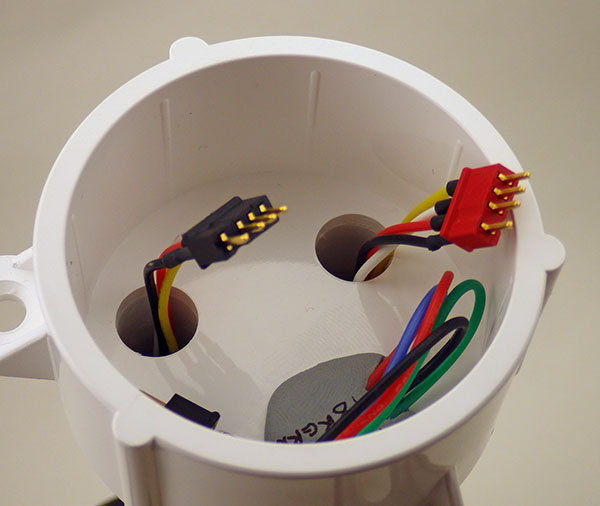
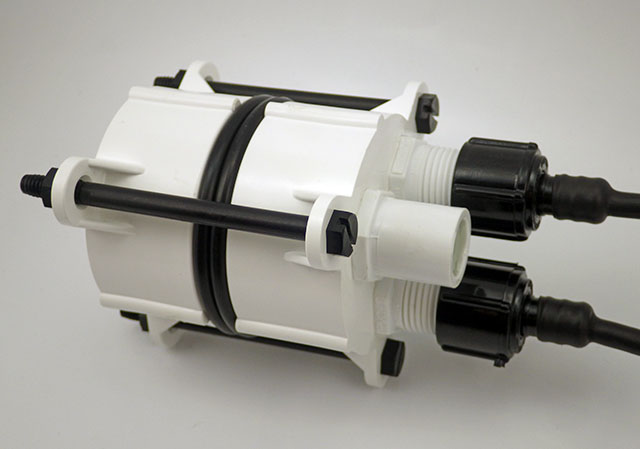
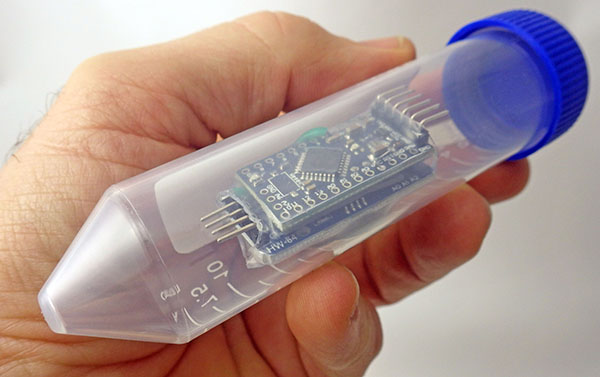
This ‘two-part’ logger fits nicely inside a falcon tube which can be deployed to 10m water depth. With a bit of practice, complete logger assembly can be done in about 30-60 minutes depending on additions. The 4K EEprom on the RTC board will hold 4096 1-byte RTC temperature readings (~ 40 days worth @ 15 min. intervals) and that’s easily extended with I2C memory chips or modules.

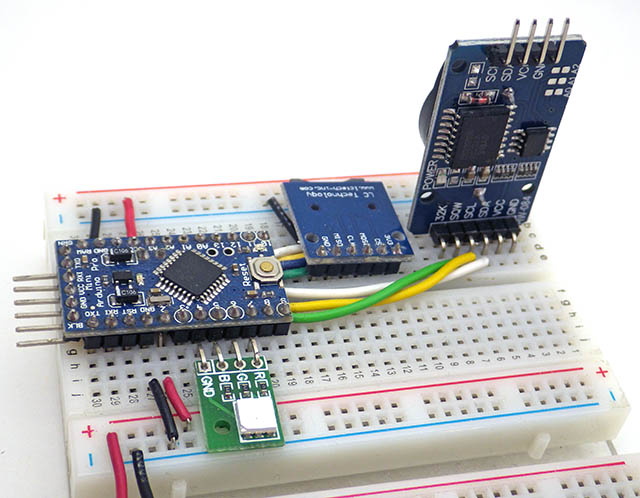
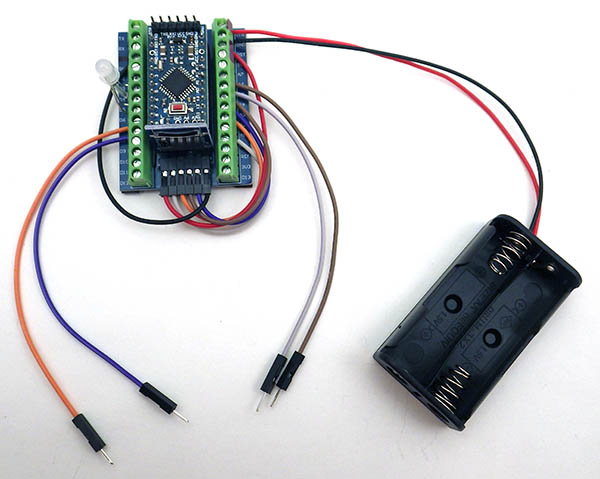
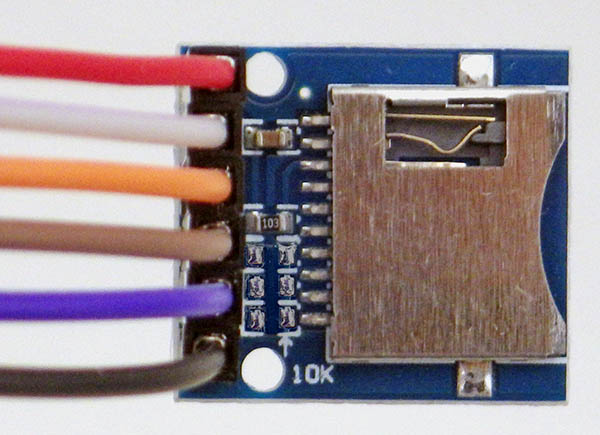
The ‘solderless’ EDU build we released in 2020 provides remarkable flexibility for courses in environmental monitoring. However an instructor still needs to invest about five days ordering parts, testing components, and preparing kits for course being run remotely. (Although only 1/2 that is needed for in-person courses where the students pin & test the parts themselves.) While that’s not unusual for university lab subjects it’s a stretch for other instructors. And thanks to COVID shortages, modules that were only a buck at the beginning of the project might now set you back $5 each. So with all that in mind, we’ve continued development of a ‘lite’ version of our logger with the lowest possible prep. That new baby is now ready for release with data download & control done through the serial monitor window.
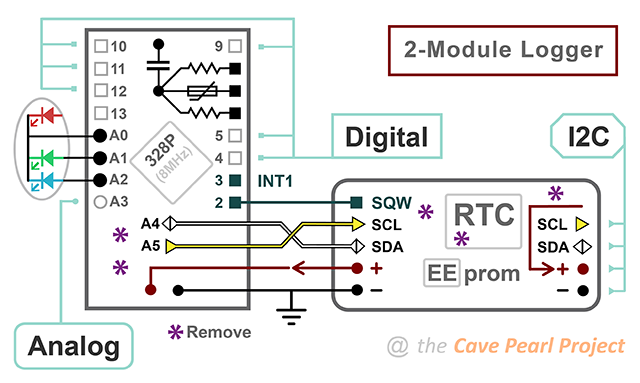
Instead of connecting the red channel of the 5mm LED I use the onboard D13 LED for red. Other libraries and programs often require that LED.

With just three core components our only option was to remove the SD card. Groundwork for this change has been in place for a long time in our research loggers, with sensor readings first getting buffered to the 4k to reduce the number of high-drain SD saves. Getting rid of those power hungry cards opened up the possibility of running the entire unit from the coin cell on the RTC module. But a power budget that small adds some complexity to the base code which must minimize CPU run-time and limit peak current.
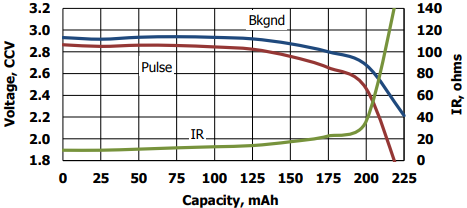
Internal Resistance with 6.8mA Pulse Discharge, from the Energiser Cr2032 datasheet. (Note: The 8mhz ProMini only draws about 3.3mA when its running)

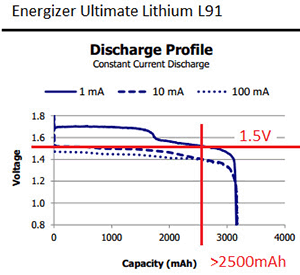
Most garden-variety chips have a lower operating limit of 2.7v – so a 3v Cr2032 can only fall about 300mv under load before triggering the brown out detection (BOD) circuit. Voltage droop changes over time because the internal resistance of a coin cell is only 10 ohms when new, but increases to 100 ohms by end of life. According to Maxell’s 1Meg-ohm (3.3µA continuous) discharge test, coin cells should stay at their voltage plateau until they deliver about 140mAh. In our testing, 200uF battery buffering capacitors can extend runtime up to 30% but this varied with the quality of the battery. Of course, if you can reach a year without the rail buffer, then you’ve probably filled the memory. So rail caps may only be necessary with high-drain sensors or in low temperature deployments where the battery chemistry slows. It’s not unusual to see a 50mv delta at the battery terminals for every 15°C change in ambient so a standard coin cell will not power the logger very long at temperatures very far below freezing.

However, theres only so much you can predict about system behavior in the real world – especially with stuff constructed from cheap modules carrying half a dozen unspecified components. So let’s just build one and see how it goes.


Jump links to the sections of this post:


PREPARE the RTC module:

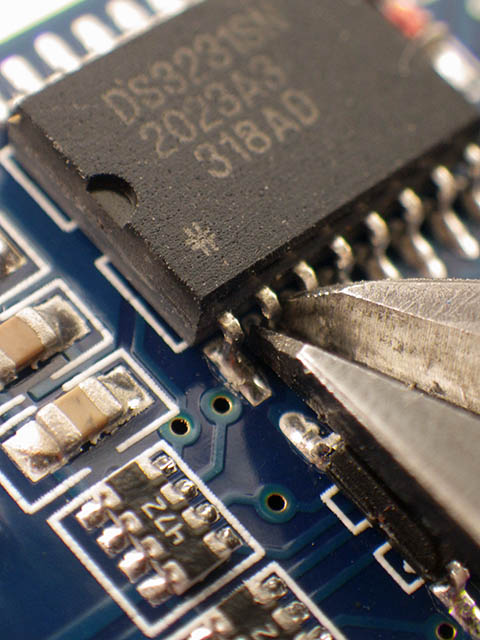
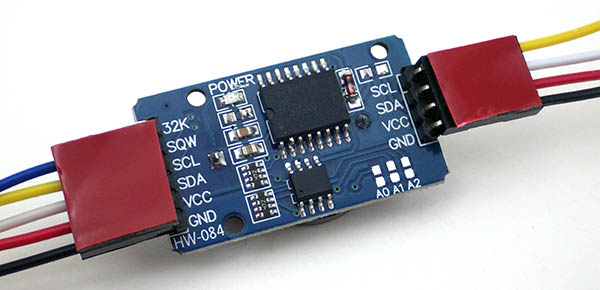
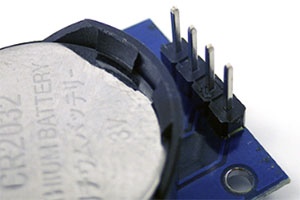
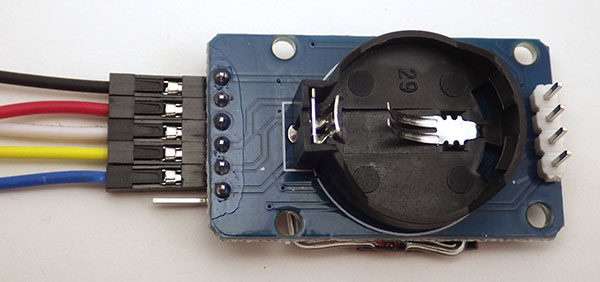
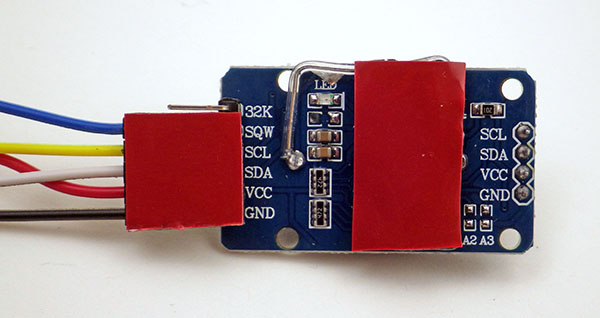
Clipping the main VCC leg (the 2nd leg in from that corner) forces the DS3231 to run from the backup power input on the other side of the chip.
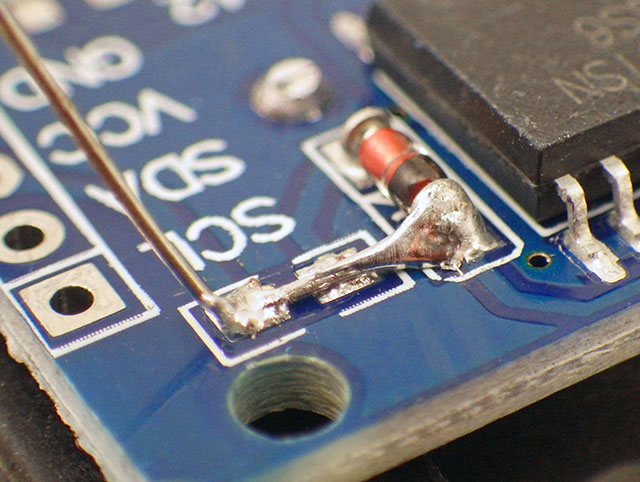
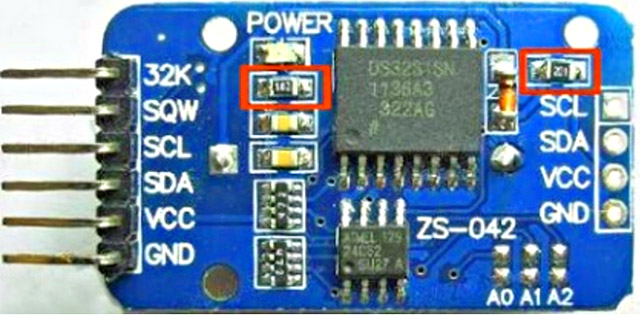
Disconnect the modules indicator LED by removing its limit resistor with a hot soldering iron tip.
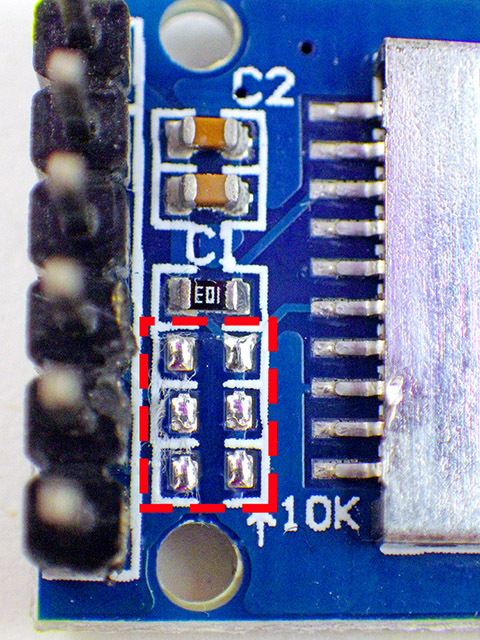
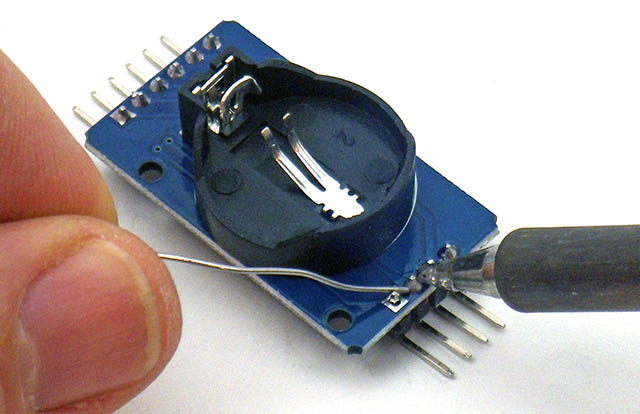
Remove the 200ohm charging resistor & bridge VCC to the coin cell backup power at the black ring end of diode.

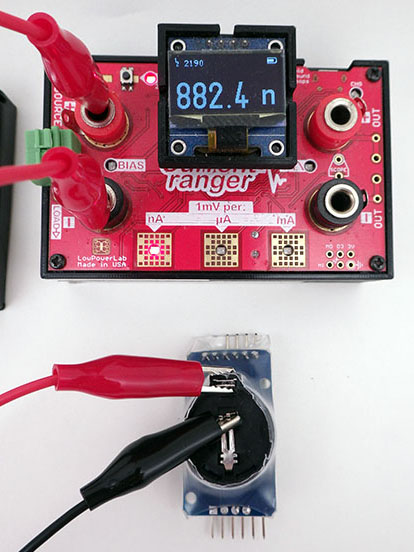
Running from Vbat depowers most of the logic inside the DS3231 and disables the 32kHz output (I usually cut away that header). According to the -M and -SN datasheets, but both RTC chips draw the same average of 3.0µA timekeeping battery current to keep only the oscillator, temperature compensation & comparator working. The default 4k EEprom draws between 20-40nA when not being accessed. Bridging VCC directly to Vbat also means a 3.3v UART will push some sub-milliamp reverse currents through an older coin cell. Despite dire manufacturer warnings that reverse currents beyond 1µA will heat manganese-dioxide/lithium cells until they explode, I’ve yet to have a single problem (or even any detectable warming) with loggers connected for many days during code development. Drift on these RTCs is usually a loss of ~3-5 seconds per month, but you can reduce this considerably by calibrating the DS3231 Aging Offset Register with a GPS module. The only annoying issue with these RTC’s is that, once enabled, the alarms continue to be generated forever unless you set an ‘unreachable’ next alarm time, or shut down the main oscillator completely.
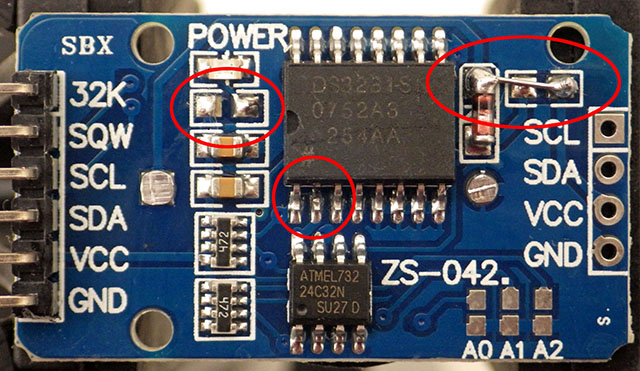
3 mods to the RTC module
It’s a good idea to test of those RTC modules (with the logger base-code) before assembling your logger. After successful testing, I add conformal to the RTC & let dry before joining the two modules.

OPTIONAL: Add another EEprom to the RTC module

With a practiced hand you can add more EEprom memory right onto the RTC module. 64k is the sweet spot for single sensors generating 2-byte integers because they can store ~340 days of data at a 15min. interval. Each additional EEprom adds 0.2 to 0.4µA to the loggers overall sleep current. 64K’s are about $1 up to 256K chips selling for about $3.50 at Digikey. AT-series EEproms larger than 64k, show up on the I2C bus as multiple 64k chips.
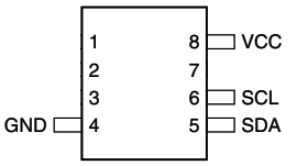
For an AT24c512 you only need connect the four pins shown because the chip internally grounds any pin left floating. The rtc module pulls all connected address pins high (setting the lower 4k to 0x57) but an upper 64k EEprom with the connections above would go to 0x50.
Stacked EEproms in a 0x57 & 0x51 configuration. If this soldering is a bit too advanced see the ‘adding sensors’ section for a way to increase storage space with modules. Of course you can stack on those boards as well!

PREPARE the Pro Mini:

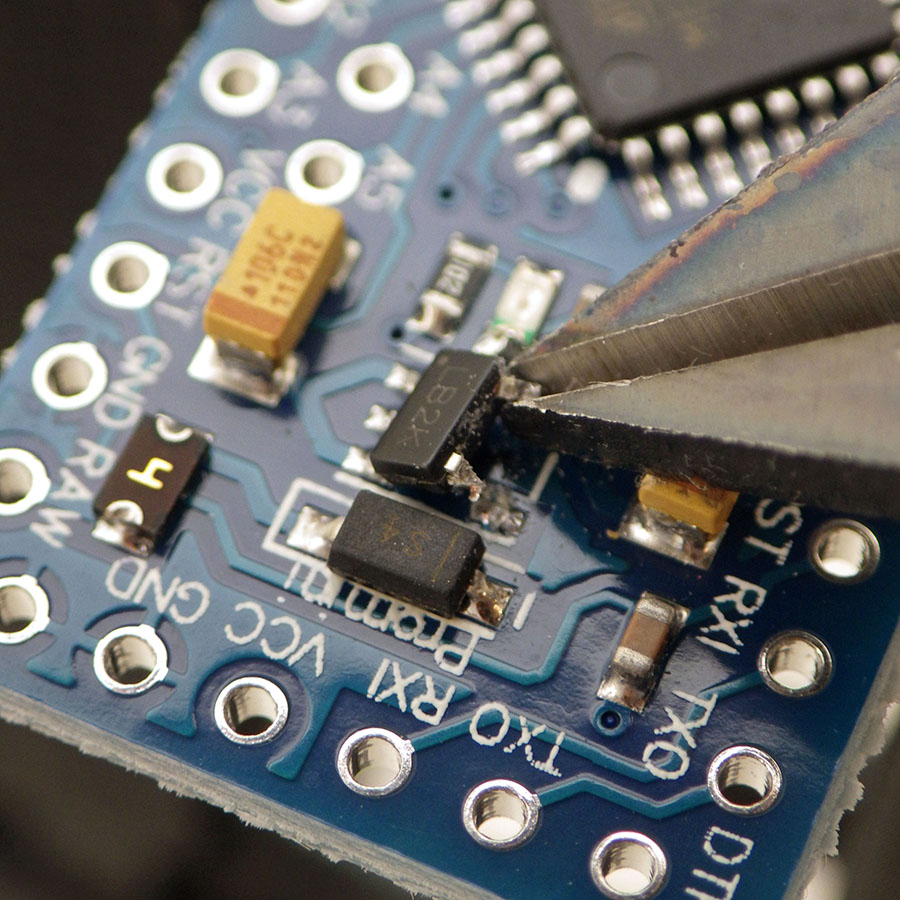
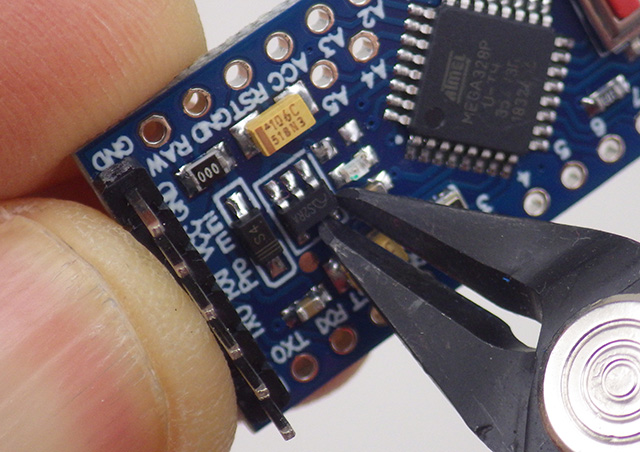
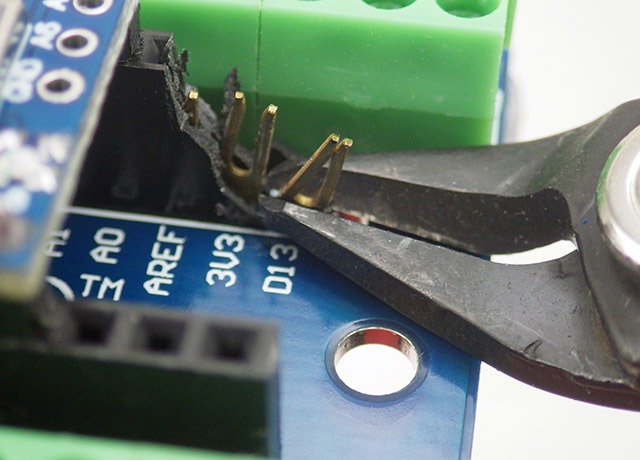
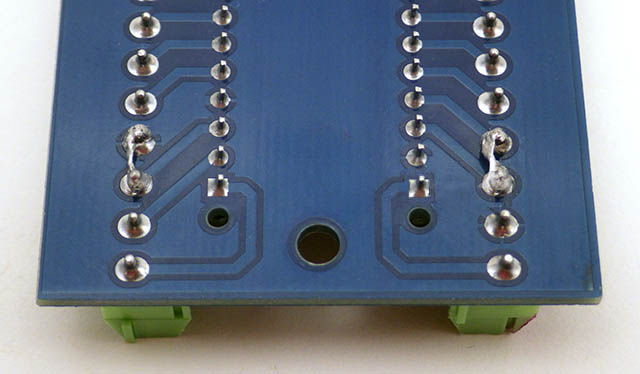
Carefully clip away the regulator from the 2-leg side to prevent 80µA of back-leakage thru the regulator under battery power.
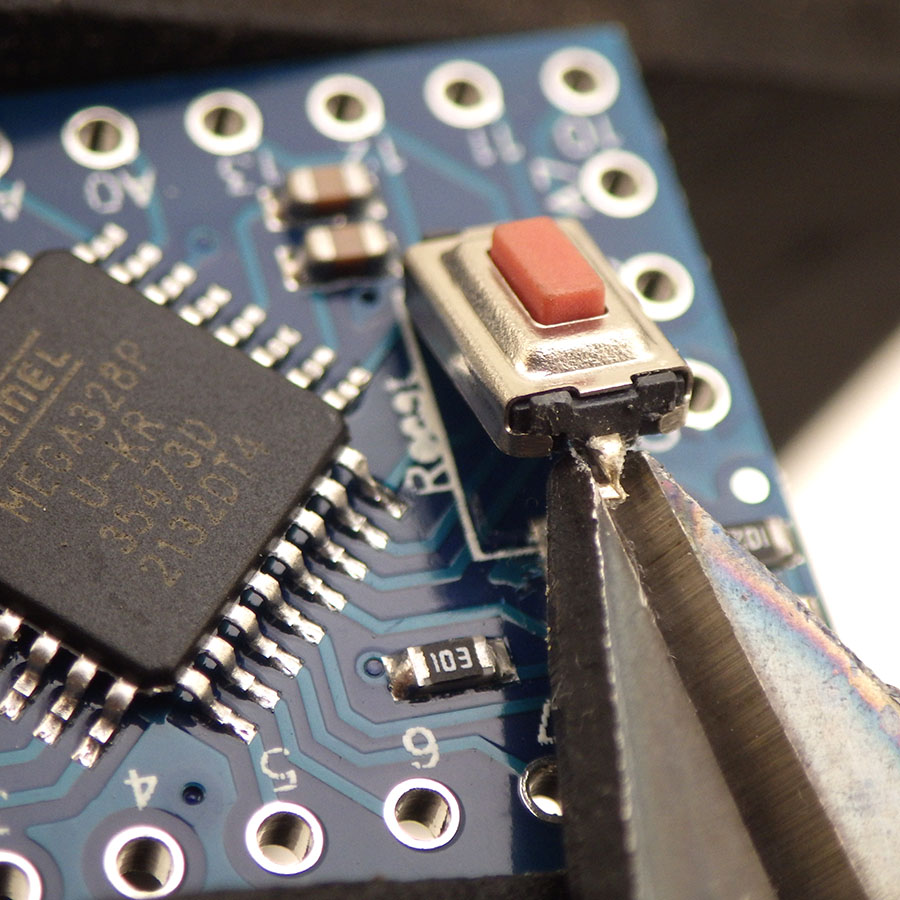
Clip away the reset switch. This logger can only be started with serial commands via a UART connection.
Remove the limit resistor for the power indicator LED with a hot soldering iron tip. This is near the regulator area.

An Arduino Pro Mini continues at the heart of our loggers because it is still the easiest low-power option for projects that aren’t computationally demanding. 328p’s normally sleep well below 1µA with the BOD turned off but 17µA with BOD left on. It’s worth noting that component level testing of the tiny sleep current on an isolated ProMini board requires stable battery power, as UART supplied voltages are too noisy for sensitive devices like a Current Ranger. You will occasionally get clones with fake Atmel chips that won’t go below ~100µA sleep no matter what you do.

At 8Mhz the ‘official’ lowest safe voltage for the 328p is 2.7v and the BOD cutoff circuit is always on while the processor is running. So you want to stop logging if the rail starts falling below ~2850mv. Keep in mind that there is wide range of actual brownout thresholds, from a minimum of 2.5v to a max. of 2.9v. So if you get a logger that consistently quits while the battery voltage is still high, you might want to check that units actual BOD trigger point with a bench power supply.
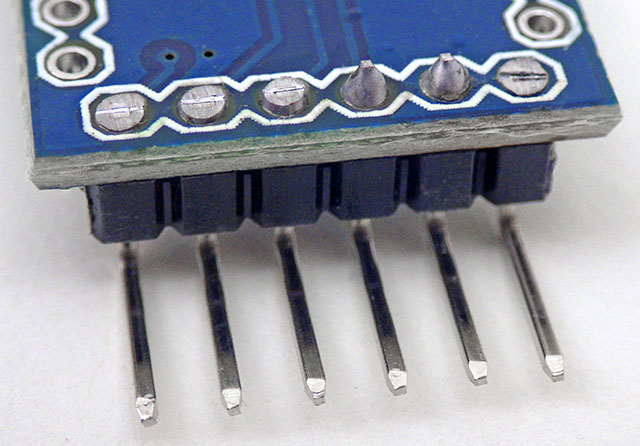
Attach UART header pins and trim three of the tails flush to avoid accidental contact later.
Do not progress with the build until you have confirmed the ProMini has a working bootloader by loading the blink sketch from the IDE.

OPTIONAL: Add a Thermistor, LDR & Indicator LED

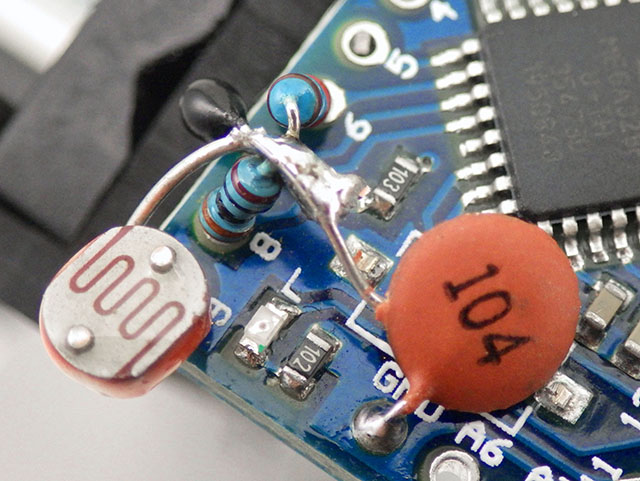
One of my favorite sensor combinations for this logger is an NTC thermistor & CDS cell which adds nothing to the sleep current. Range switching with two or more NTCs could also be done if the max / min resistance values of one thermistor can’t maintain your resolution requirements. We explained how to read resistive sensors using digital pins in 2019; so here I will simply show the connections. Add these passives to the Pro Mini BEFORE joining it to the RTC module, taking care not to hold the iron so long that you cook the components. Each [104] 0.1uF of capacitance you use in this circuit gives you about 3000 raw clock counts for the 10k reference resistor.

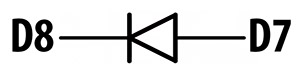
D6=10kΩ 1% metfilm reference resistor , D7=10k 3950 NTC, D8=300Ω (any type), D9=LDR (5528). Note that the LDR is optional, and could be replaced with any other type of resistive sensor up to ~65kΩ. A typical 10kNTC reaches that limit near -10°C and the LDR usually reaches that at night.
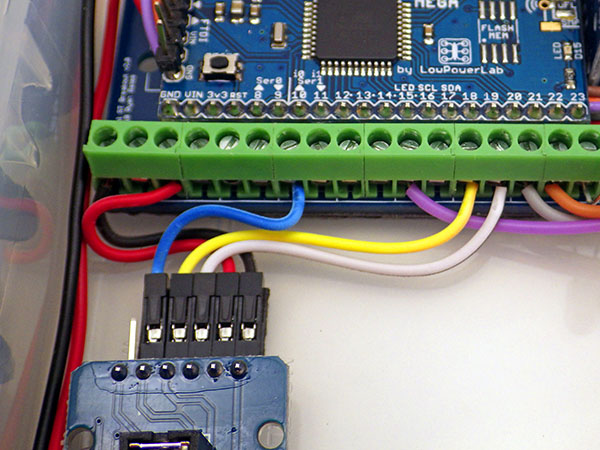
The code puts all lines that are not being read into input mode to isolate them from the circuit when reading each individual channel. With these sensors I usually jumper D2->SQW with a longer piece of flexible wire to avoid covering the D13 LED.
A 104 ceramic cap to GND completes the ICU timing circuit. With a 0.1uF as the charge reservoir, each resistor reading takes ~1-2msec in sleep mode IDLE. With this small capacitor, timing jitter produces a band of readings about 0.02°C wide on the output plots if temp. readings are repeated rapidly.

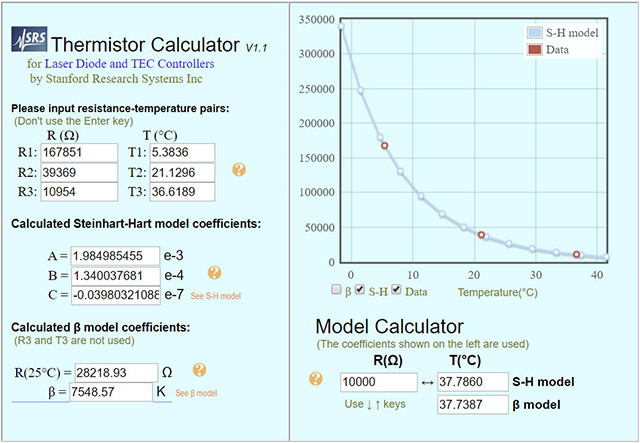
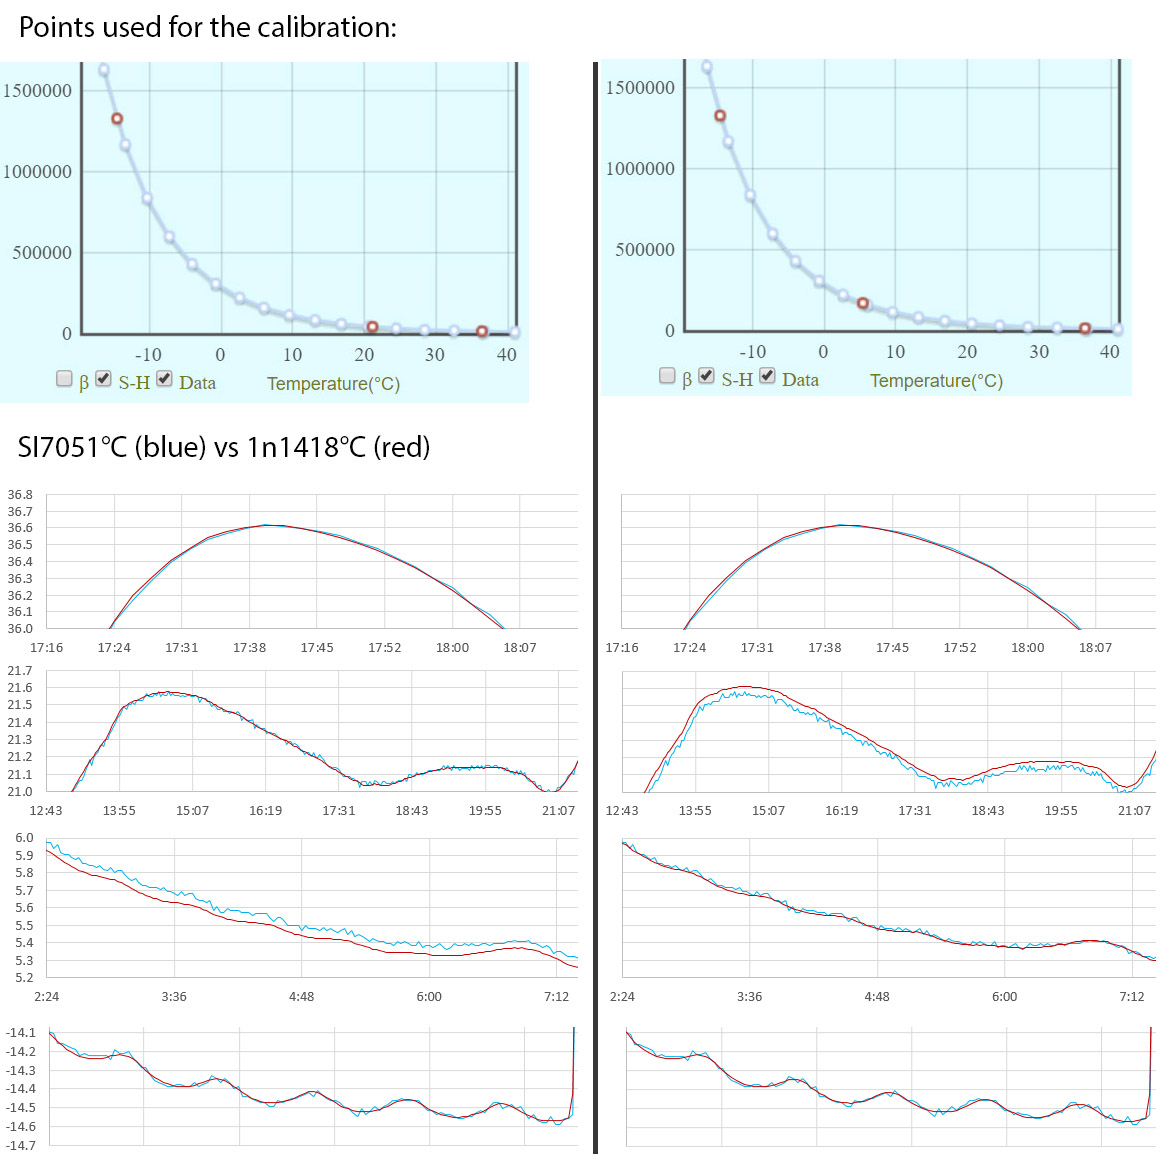
We created a how-to guide on calibrating thermistors which makes use of an online calculator to determine the equation coefficients. You should never expect the NTC you have in your hands to match the values provided by its manufacturer, but even if it did our method leverages the behavior of the ProMini itself as part of the measuring system. So there is no point buying expensive interchangeable thermistors – the cheapest penny-parts will do just fine. I add a thermistor to all my loggers (even if they will eventually drive I2C sensors) because a good way to test new loggers is to read the NTC at a short one-second interval until the EEprom has been completely filled a few times. After that burn-in you can be sure the core of the logger is reliable before adding other sensors.

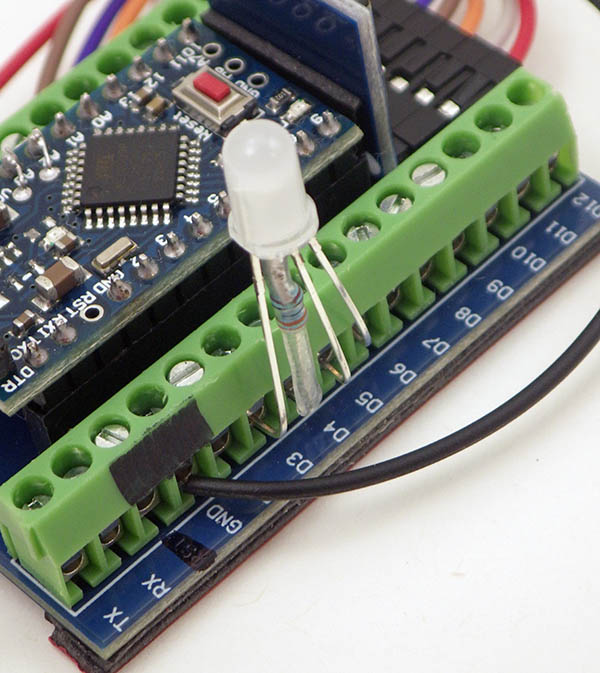
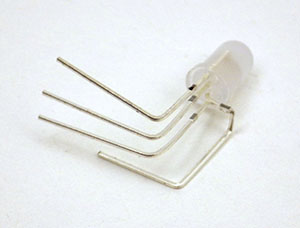
[OPTIONAL] Common cathode RGB w red leg cut on A0=GND, A1=Green, A2=Blue. The colors are lit via internal pullups to keep below 50µA. Leaving the RED LED on D13 in place is useful to let you know when the bootloader has been triggered and that gets used by default if no other LED is enabled at the start of the logger code. The 1k D13 limit resistor must be left in place to use the onboard LED.

Join the Two Modules:

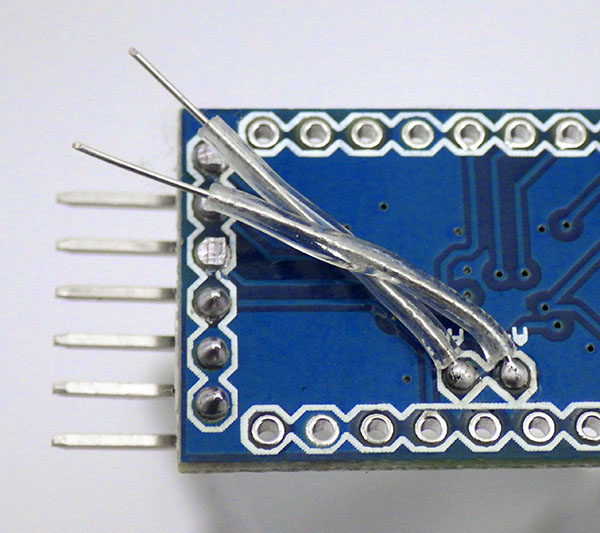
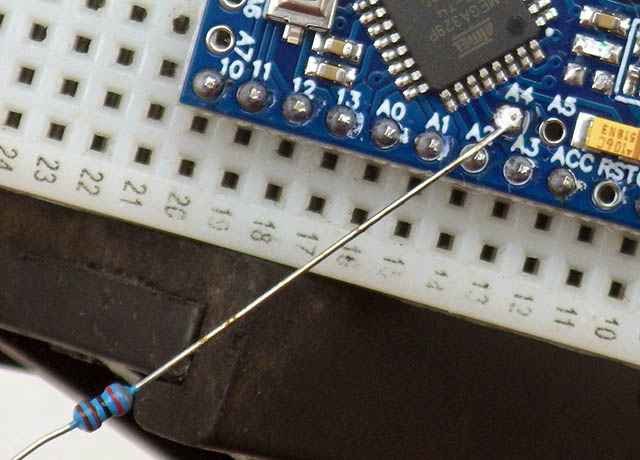
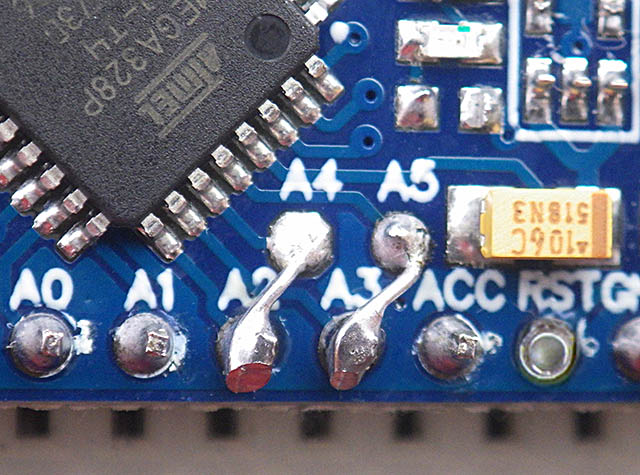
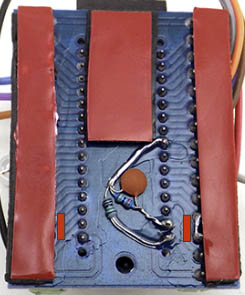
Resistor legs wrapped in heat shrink extend the A4/A5 I2C bus. These two wires must cross over each other to align with connections on the RTC.
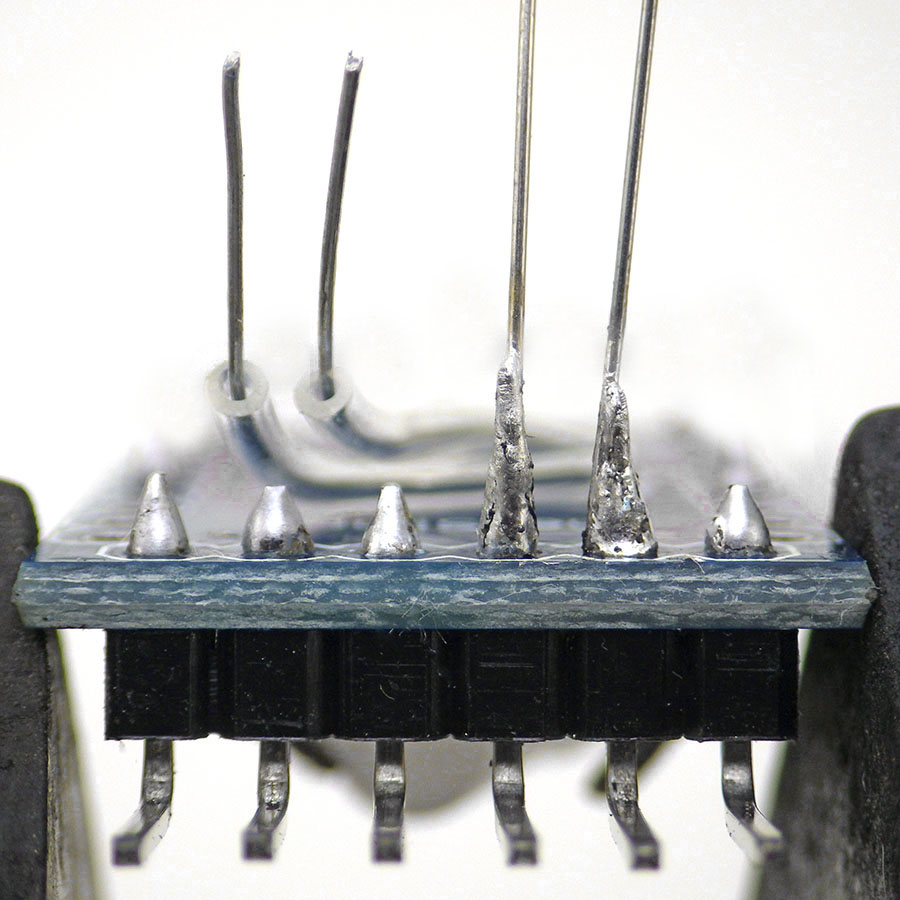
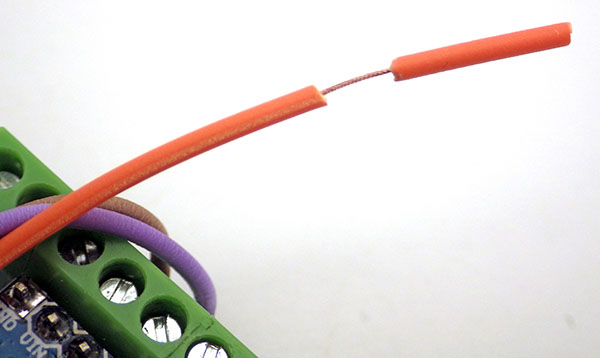
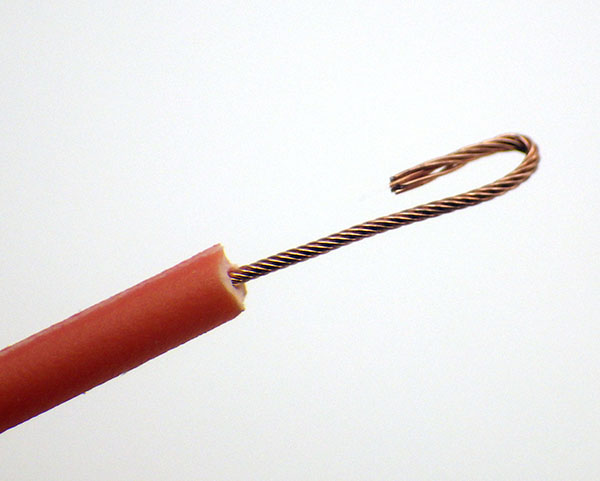
Extend the VCC & GND headers with resistor legs.
Add a strip of double-sided foam tape across the chips on the RTC module and remove the protective backing.

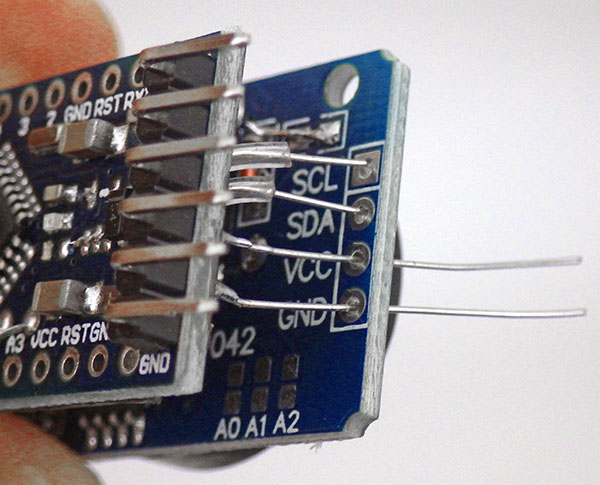
Carefully thread the four I2C jumpers through the RTC modules pass-through port.
Press the two boards together onto the double sided tape and solder the four connections.
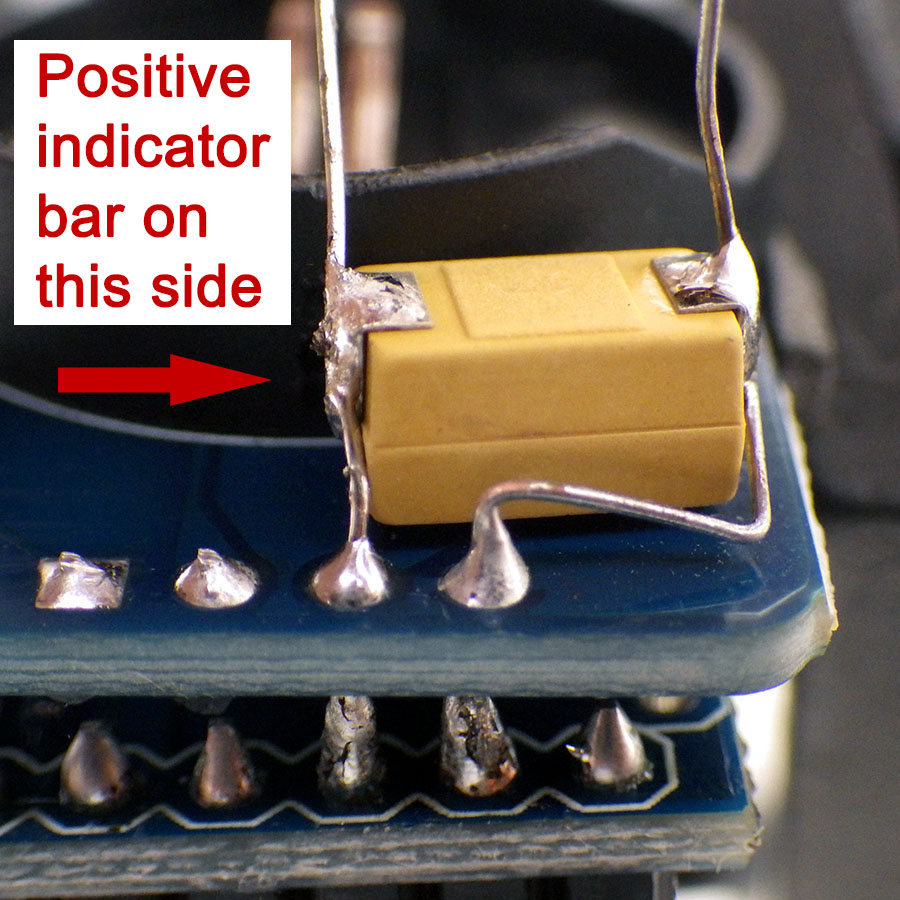
OPTIONAL: use the VCC & GND wire tails to add an SMD tantalum rail buffering capacitor and trim away any excess wire. Anything from 220 to 1000µF will reduce battery voltage droop as the coin cell ages. 10V 470uF caps provide a good overall balance between buffering ability and leakage currents in the 50nA range. After checking polarity, flip the SMD solder pads to the upper surface for easier soldering. Rail buffering caps can extend runtime by 20-30%, depending on the quality of your coin cell, but they are not necessary for short-term logger operation.
Trim away the (non-functional) 32kHz pin and tin to the SQW header pin. Solder a resistor leg (or a short length of 26AWG wire) to interrupt input D2 on the Pro Mini.
Add heat shrink to the D2 jumper & solder it to the SQW alarm header pin.
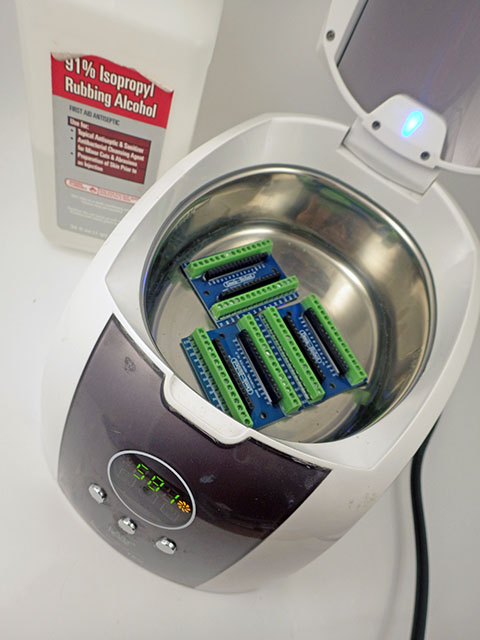
The minimum 2-module stack usually draws about 1µA constant sleep current, but with it’s TXCO corrections the RTC alone brings the average to at least 3µA. Cheap modules often have leftover flux which can cause current leaks. It’s worth the time scrub these boards with alcohol before assembly. I found no significant difference in sleep current between setting unused pins to INPUT_PULLUP or to OUTPUT_LOW.

The basic two-module combination usually sleeps around 1-2µA continuous. Most of that is the RTC’s timekeeping current as a 328p based ProMini only draws ~150nA in power-down (with regulator removed & BOD off) and the 4k eeprom should be less than 50nA in standby. If we assume four readings per hour at 5mA for 30msec, the battery life calculator at Oregon Embedded estimates a 220mAh battery will last more than 10 years…which is ridiculous. We know from the datasheet that the typical Ibat timekeeping current for the DS3231 is `700nA (dsheet pg7 with EN32KHZ=0 @3v) but TXCO temperature conversions bring the RTC average up to 3µA – which can’t be seen on this direct measurement. And there’s the battery self discharge of 1-3% per year. Perhaps most important there’s the complex relationship between pulsed loads and CR2032 internal resistance, which means we’ll be lucky to get half the rated capacity before hitting the typical 328p brown-out at 2.77v. A more realistic estimate would start with the assumption that the battery only delivers about 110mAh with our logger consuming whatever we measure + 3µA (RTC datasheet) + 0.3µA (coincell self-discharge). For conservative lifespan estimation we can round that all up to about 5µA continuous, with four 5mA*10millisecond sensor readings per hour, and we still get an estimated lifespan of about two years. So the most significant limitation on this logger is usually the EEprom memory. It’s worth noting that newer DS3232 variants of the RTC lets you push the TXCO corrections out to 512 seconds. This lowers the average RTC standby to about 1µA -if- you are willing to spend $10 for the RTC chip alone on DigiKey.

Build video: ( 3 minute rapid review)

Note: the order of operations in the video is slightly different from the photos.

The Code: [posted on Github]

In 2023 the logger base code was updated to match the newer the e360 model, being essentially identical except for the changes required for the alternate NTC and LED connections. The code requires the LowPower.h library for AVR to put the logger to sleep between readings and this can be installed via the library manager.

One important difference between a coin cell powered logger and our older AA powered models is that the battery has a high probability of being depleted to the point of a BOD restart loop. (which causes rapid flashing of the D13 LED) So we use a multi-step serial exchange in Setup() to prevent data already present in the EEprom from being overwritten by an accidental restart.

Setup()

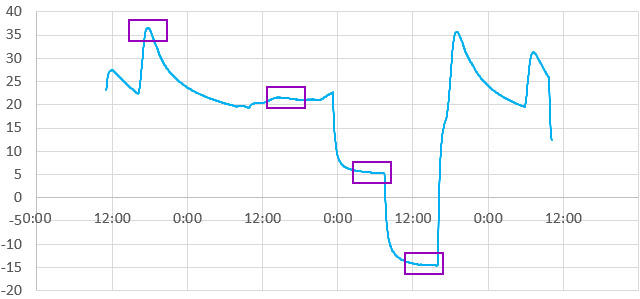
Purple callouts on the following flow diagrams indicate the places that would need to be altered to add a new sensor to the base code. If all you do is enable sensors via defines at the start of the program you won’t have to deal with the code that stores the data. However to add a new sensor you will need to make changes to the I2C transaction that transfers those sensor readings into the EEprom ( with matching changes to the sendData2Serial function that reads them back out later).
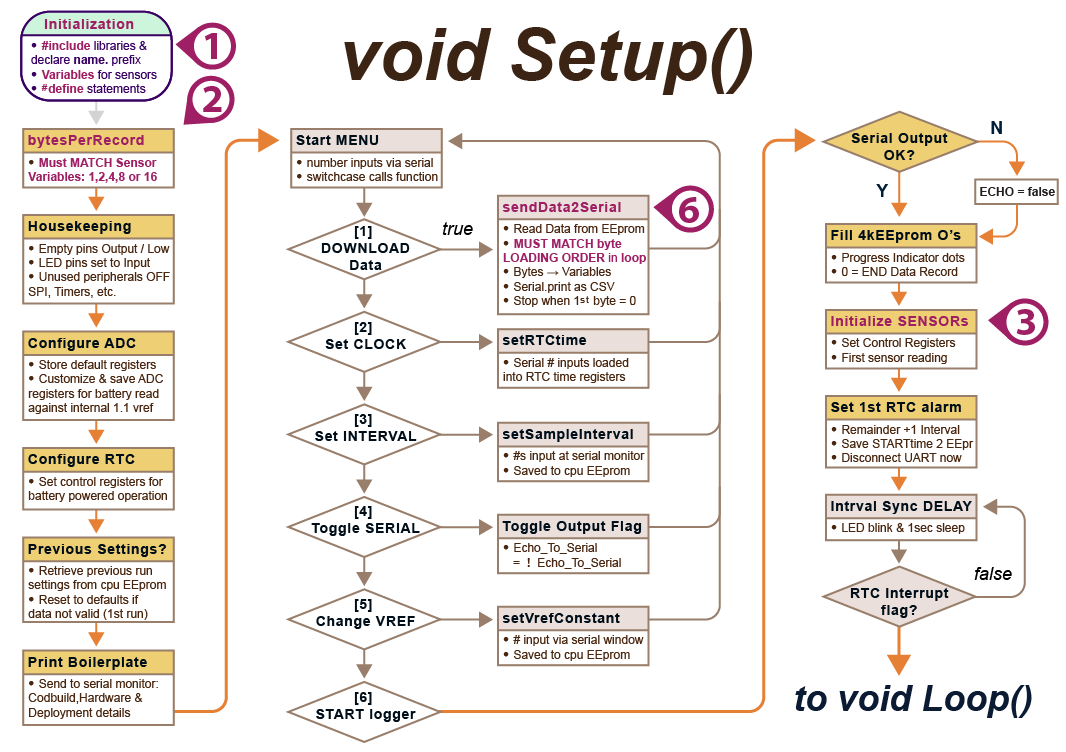
Note: The options on the startup menu will change over time as new code updates are released.

A UART connection is required at start-up so those menu-driven responses can occur through the serial monitor in the IDE. These have 8minute timeouts to avoid running the CPU too long during unintentional restarts. The menu sequence can be re-entered at any time simply by closing & re-opening the serial monitor window: This restarts the Pro Mini via a pulse sent from the UARTs DTR (data terminal ready) pin.
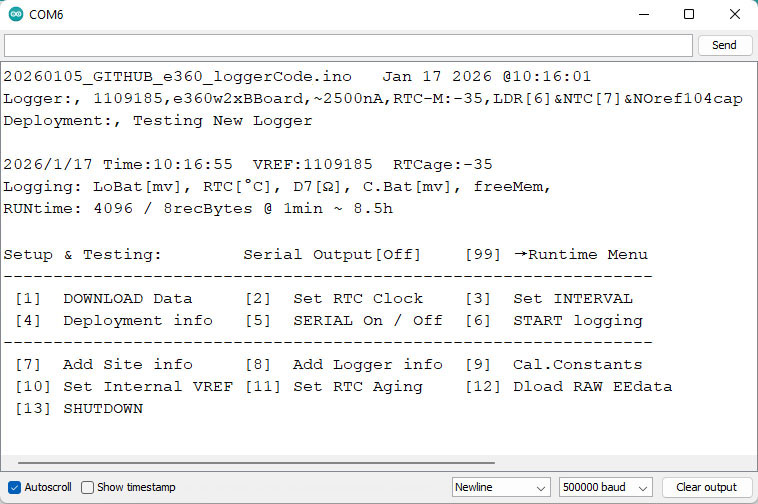
Only the first six options appear until you enter ’99’ to expand the menu. If you see random characters in the serial window, set the baud to 500,000 (with the pulldown menu on the lower right corner of the window) and the menu should display properly after you re-open the window. If you Ctrl-A & Ctrl-C to copy logger data from the serial monitor when the window has garbled characters, no information will copy out. On a new logger info fields may display as a rows of question marks until you enter some text via the menu but the Site info & Cal. Constant fields will remain hidden until they are used. RTCage can be left at a 0 default but see below to adjust VREF. This menu will change over time as new features are added.

The first menu option asks if you want to download the contents of the logger memory to the serial monitor window. This can take up to 2 minutes with 256k EEproms at 500000 baud, which is the fastest rate an 8MHz ProMini can reliably sustain. Then copy/paste everything from the IDE window into an Excel sheet. Then below the data tab, select Text to Columns to separate the data fields at the embedded commas. Or you can paste into a text editor and save as a .csv file for import to other programs. While that process is clunky because the IDE’s serial interface doesn’t export, everyone already has the required cable and data retrieval is driven by the logger itself. And yes, the exchange could also be done with other serial terminal apps like PuTTY with logging turned on, CoolTerm, or Termite with the ‘logfile’ filter. You can also redirect Windows COM port output to a file, although it seems limited to only 19k baud. These options may be required on builds with large memory expansions as the IDE serial monitor starts to forget the initial data in it’s buffer after displaying about 100,000 lines. I have successfully used Termite at 1,000K baud downloading an 8mhz logger, but when the amount of data gets large the ProMini starts limiting you to an effective 500K baud. Functions like itoa() before serial.print() or using Rob Tillaart’s splitDigits4 & splitDigits10 with serial.write() speeds things up considerably. In summary, 250k BAUD is stable, 500k is usually fine with occasional serial dropouts in a very long download, while 1,000k Baud exhibits frequent flaky behaviors with the IDE’s serial monitor. Those character dropouts don’t happen using Coolterm or PuTTY.

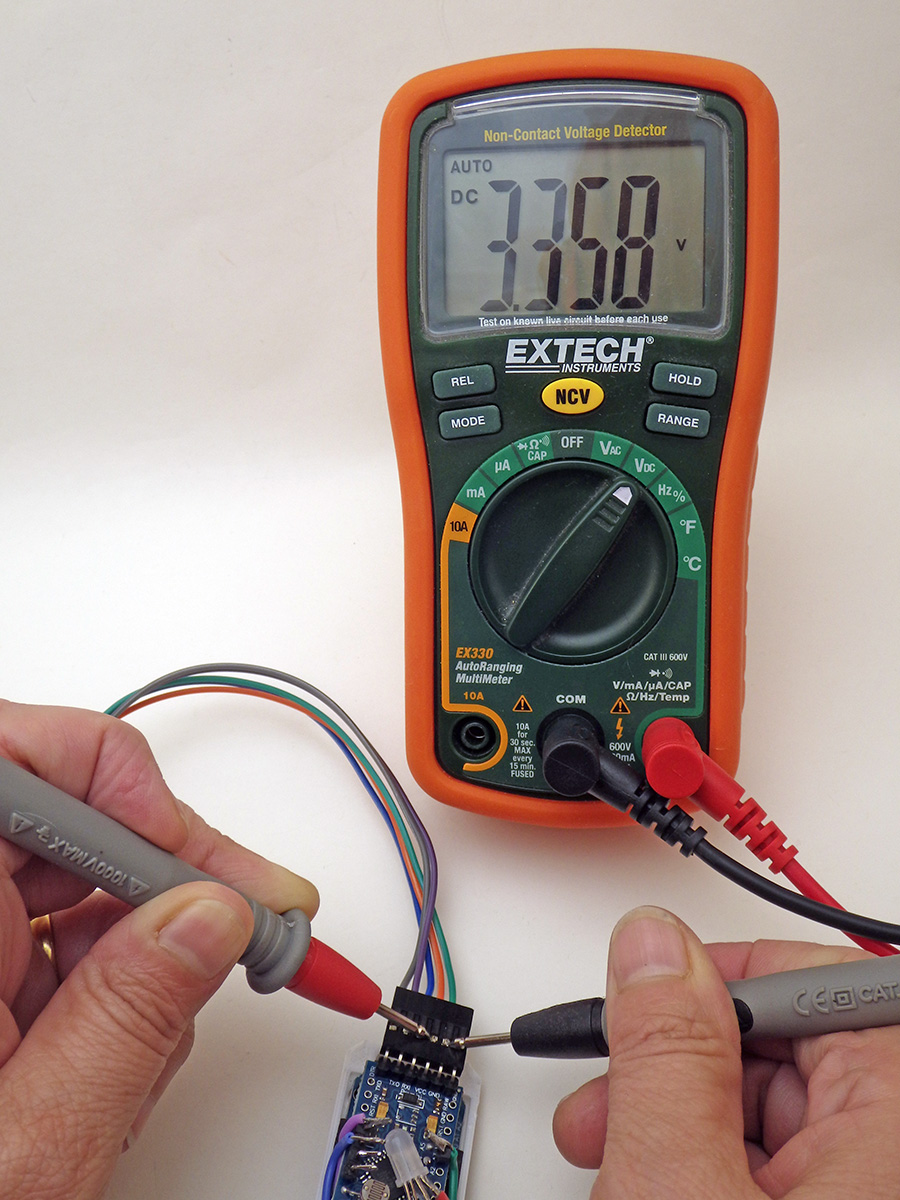
Vref compensates for variations in the reference voltage inside the 328p processor. Adjusting the 1126400 (default) value up or down by 400 raises/lowers the reported voltage by 1 millivolt. Adjust this by checking the voltage supplied by your UART with a multimeter while running the logger with #define logCurrentBattery enabled and serial output ON. Note the difference between the millivolts you actually measured and the current voltage reported on screen, and then multiply that difference by 400 to get the adjustment you need to make to vref for accurate battery readings. After you [7] Change Vref and enter the adjusted number it will be used from that point onward. Stop adjusting when you get within ±20mv.

After the start menu sequence the first sampling time is written to the internal EEprom so the timestamps for sensor readings can be reconstructed during data retrieval later by adding offsets added to the starting time. This technique saves a significant amount of our limited EEprom memory and all it takes is =(Unixtime/86400) + DATE(1970,1,1) to convert those Unix timestamps into human readable ones in Excel. It is important that you download the old data before changing the sampling interval via the startup menu option because the interval stored in EEprom is also used to reconstruct the timestamps. Valid sampling intervals must divide evenly into 60 and second-intervals can be set for rapid testing if you first enter 0 for the minutes.

No data is lost from the EEprom when you replace a dead coin cell and you can do the entire data retrieval process on UART with no battery in the logger. But the clock time should only be reset after installing a new battery or it will not be retained. If the time in the serial menu reads 2165/165/165 165:165:85 instead of 2000/01/01 after a power loss then there’s a good chance the RTC’s memory registers have been corrupted & the RTC module needs to be replaced. I’ve managed to do this to a few units by accidentally shorting the voltage to zero when the logger was running from a capacitor instead of a battery.

After setting the clock time and deployment parameters like the sampling interval, the logger will request the user to manually type a ‘start’ command before beginning a run. Only when that second ‘start’ confirmation is received are the EEproms erased by pre-loading every location with ‘Zeros’ which also serve as End-Of-File markers during download. The selected LED will then ‘flicker’ rapidly to indicate that the logger is ‘waiting’ until the current time aligns with the first sampling alarm before beginning the run.

Main LOOP()
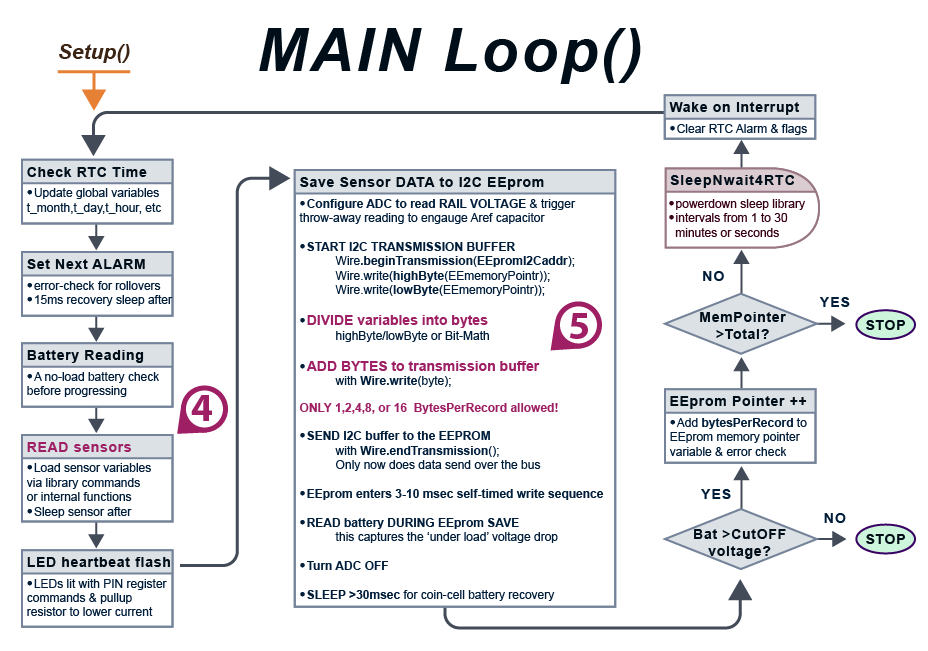
EEprom writes usually draw about the same 3mA current the ProMini draws during CPU up time. ‘Lowest’ battery voltage is checked immediately after the data transfer because an unloaded Cr2032 will always read nominal – even when it’s nearly dead. Timing of events at that point is critical because EEproms freeze if the rail voltage fluctuates too much while they are actively writing – so don’t change those LowPower.idle sections of the code! Also don’t run OLED screens during sensor readings or EEsaves because they are noisy as heck. Logger shutdown gets triggered at the end of the main loop if the EEprom save brings the rail voltage below the 2850mv systemShutdownVoltage or if the memory is full.


Adding I2C Sensors to the logger:

The minimum configuration for this logger can log the 0.25°C temperature record from the DS3231, index-encoded to one byte per reading. Approximately 4000 of these readings can be stored in the 4k EEprom on the RTC module. This works out to a little more than 40 days at a 15 minute sampling interval.

We made extensive use of RTC temperature records in our cave drip loggers at the beginning of the project. The accuracy spec is only ±3°C, but most were within ±1 of actual @ 25°C and you can calibrate them against more accurate sensors. The RTC only updates its temperature registers every 64 seconds and any temperature sensors inside the body tube will have about 15 minutes of thermal lag relative to outside air.

The 4K AT24c32 on the RTC module fills rapidly with sensors that generate 2 or 4 byte integers. An easy solution is to combine your sensor module with 32k (AT24c256), or 64k (AT24c512) chips so the sensors bring the extra storage space they will need. These EEprom modules can usually be found on eBay for ~$1 each and after you update the EEpromI2Caddr & EEbytesOfStorage defines at the start of the program, all AT series chips will work with the same code as the default 4k.
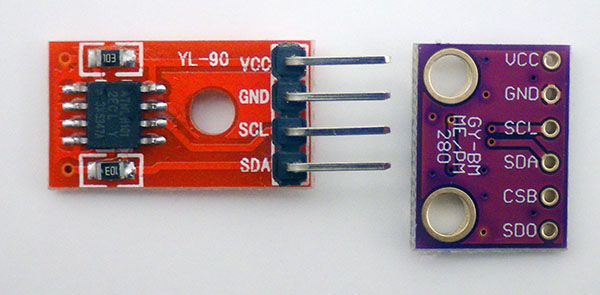
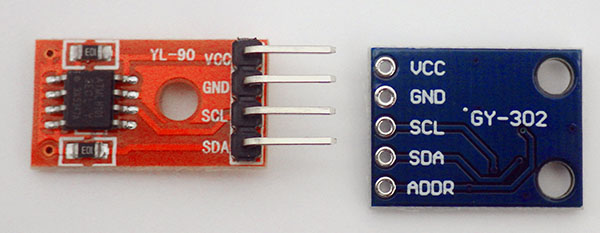
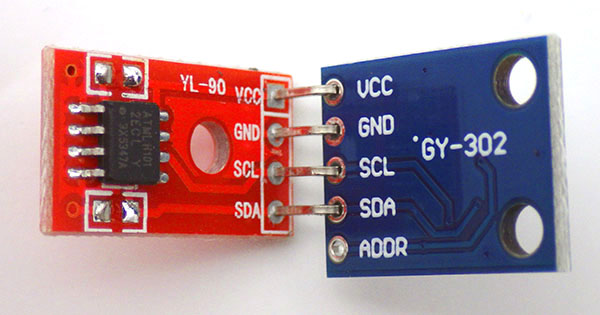
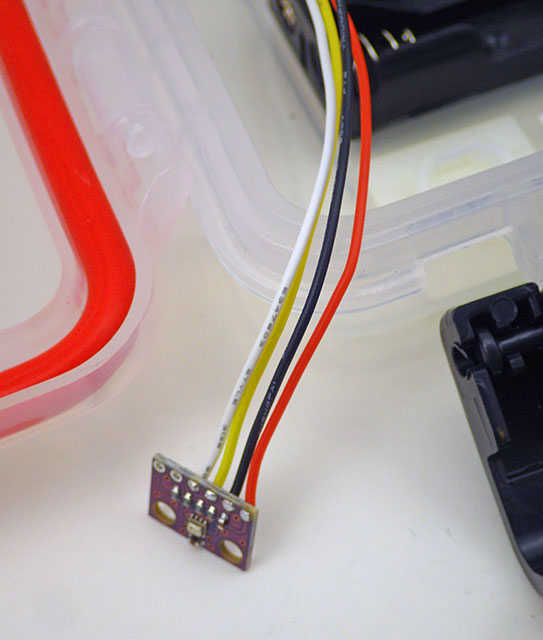
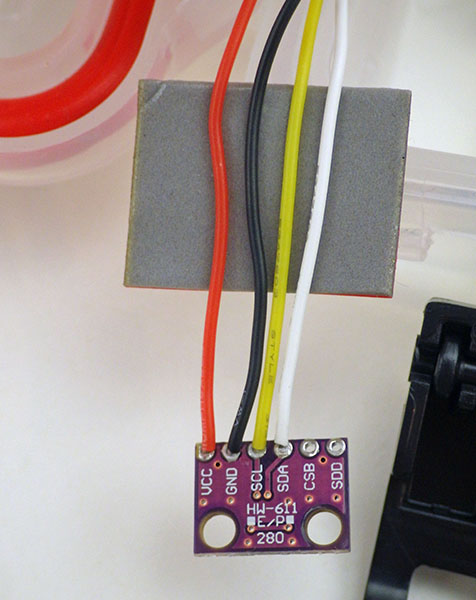
The headers on this common BMP280 module align with the 32k headers in a ‘back-to-back’ configuration. The tails on the YL-90 breakout extend far enough to connect the two boards. Note this sensor module has no regulator which is preferred for low power operation.
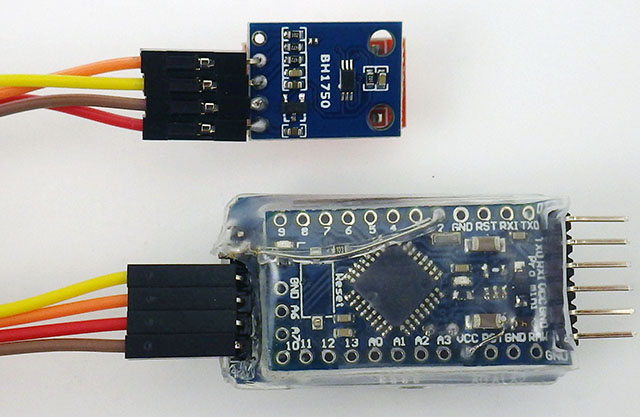
Pin alignment between the YL-90 and this BH1750 module is slightly more complicated as you can’t cover the light sensor.
Clip away the plastic spacers around the header pins. Then wiggle the BH1750 over the headers on the 32k module. Solder the points where the pins pass through the 1750 board. Note: I2C pullups on the sensor boards can usually be left in place on this low voltage system.
I2C pin order on the RTC doesn’t align with the BH1750 module. So you need to make the required cross-overs with a 4 wire F-F Dupont. Soldering those connections is more robust but do that after calibrating the thermistor.

In addition to the NTC / LDR combination, support for both of the sensors shown above is included in the code on Github although you will need to install hp_BH1750 and BMP280_DEV with the library manager to use them. Sensors are enabled by uncommenting the relevant defines at the start of the program. No matter what combination of sensors you enable, the total bytes per record must be 1,2,4,8 or 16. Otherwise you will get a repeating error at download because trying to save data beyond a hardware page-boundary inside the EEprom over-writes previously saved data at the start of that same page/block.

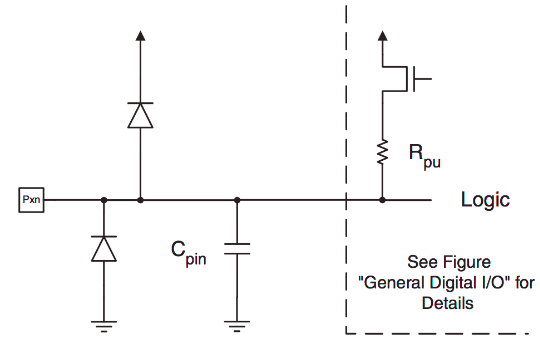
I2C devices are usually rated to sink about 1mA which on a 3v system would require 3300 ohm pullups. This means you can leave the 10k’s on those sensor modules to bring combined bus pullup ( incl. 4k7 on the RTC & 35k pullup on the ProMini pins) to 2930 ohms, which is close to the 3.3k ideal. The open-drain implementation of I2C means that adding more capacitance to the bus will round off the rising edges of your clock and data lines, which might require you to run the bus more slowly with multiple sensors or with longer wires to your sensors. In those cases you can drop the total bus pullup to 2k2 to offset the capacitance.
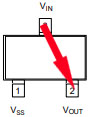
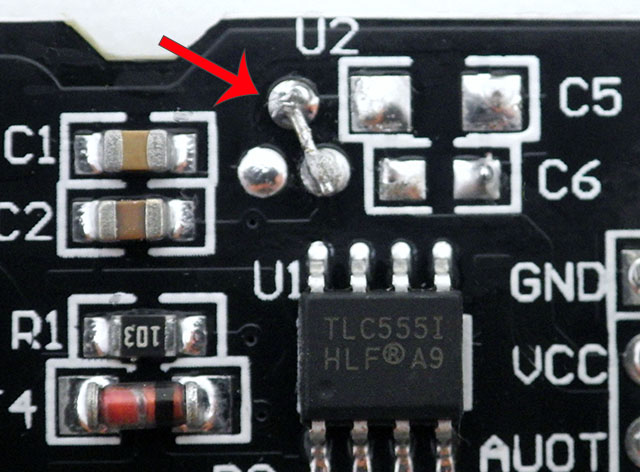
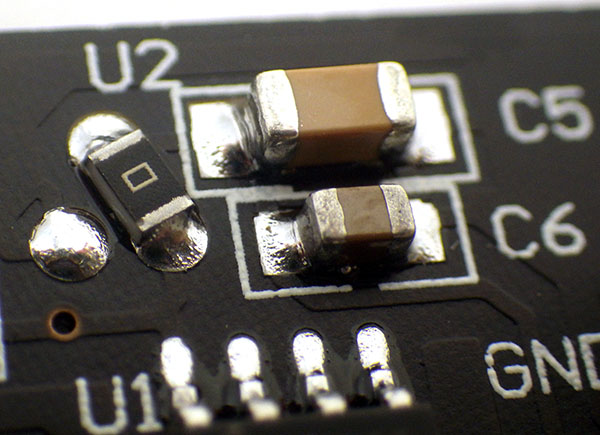
The 662k LDO regulator on most eBay sensor modules increase the loggers sleep current by 6-8µA due to back leakage. For long deployments this can be removed & then bridging the in->out pads should bring your sleep back to ~1-2µA. That regulator is below spec any time your supply falls below ~3.4v which is > than the initial over-voltage on a Cr2032.

You must use low power sensors with a supply range from 3.6v to our 2.7v BOD cutoff. A good sensor to pair with this logger should sleep around 1µA and take readings below 1mA. You are more likely to find these no-reg sensor modules with low power operation at Sparkfun or on Tindie, than you are on eBay/Amazon. A coin cell simply doesn’t have enough power to supply a high drain CO2 sensor or GPS unless you take heroic measures. Sometimes you can pin-power sensors that lack low current sleep modes although if you do that be sure to check if that creates current leaks in other places such as pullup resistors or the I2C bus may go into an illegal state (idle is supposed to leave SCL & SDA lines high) requiring a power reset of all the sensors on the bus. Choose sensor libraries which allow non-blocking reads so you can sleep the ProMini while the sensor is gathering data and replace any delay() statements in those libraries with 15msec powerdown mode sleeps.

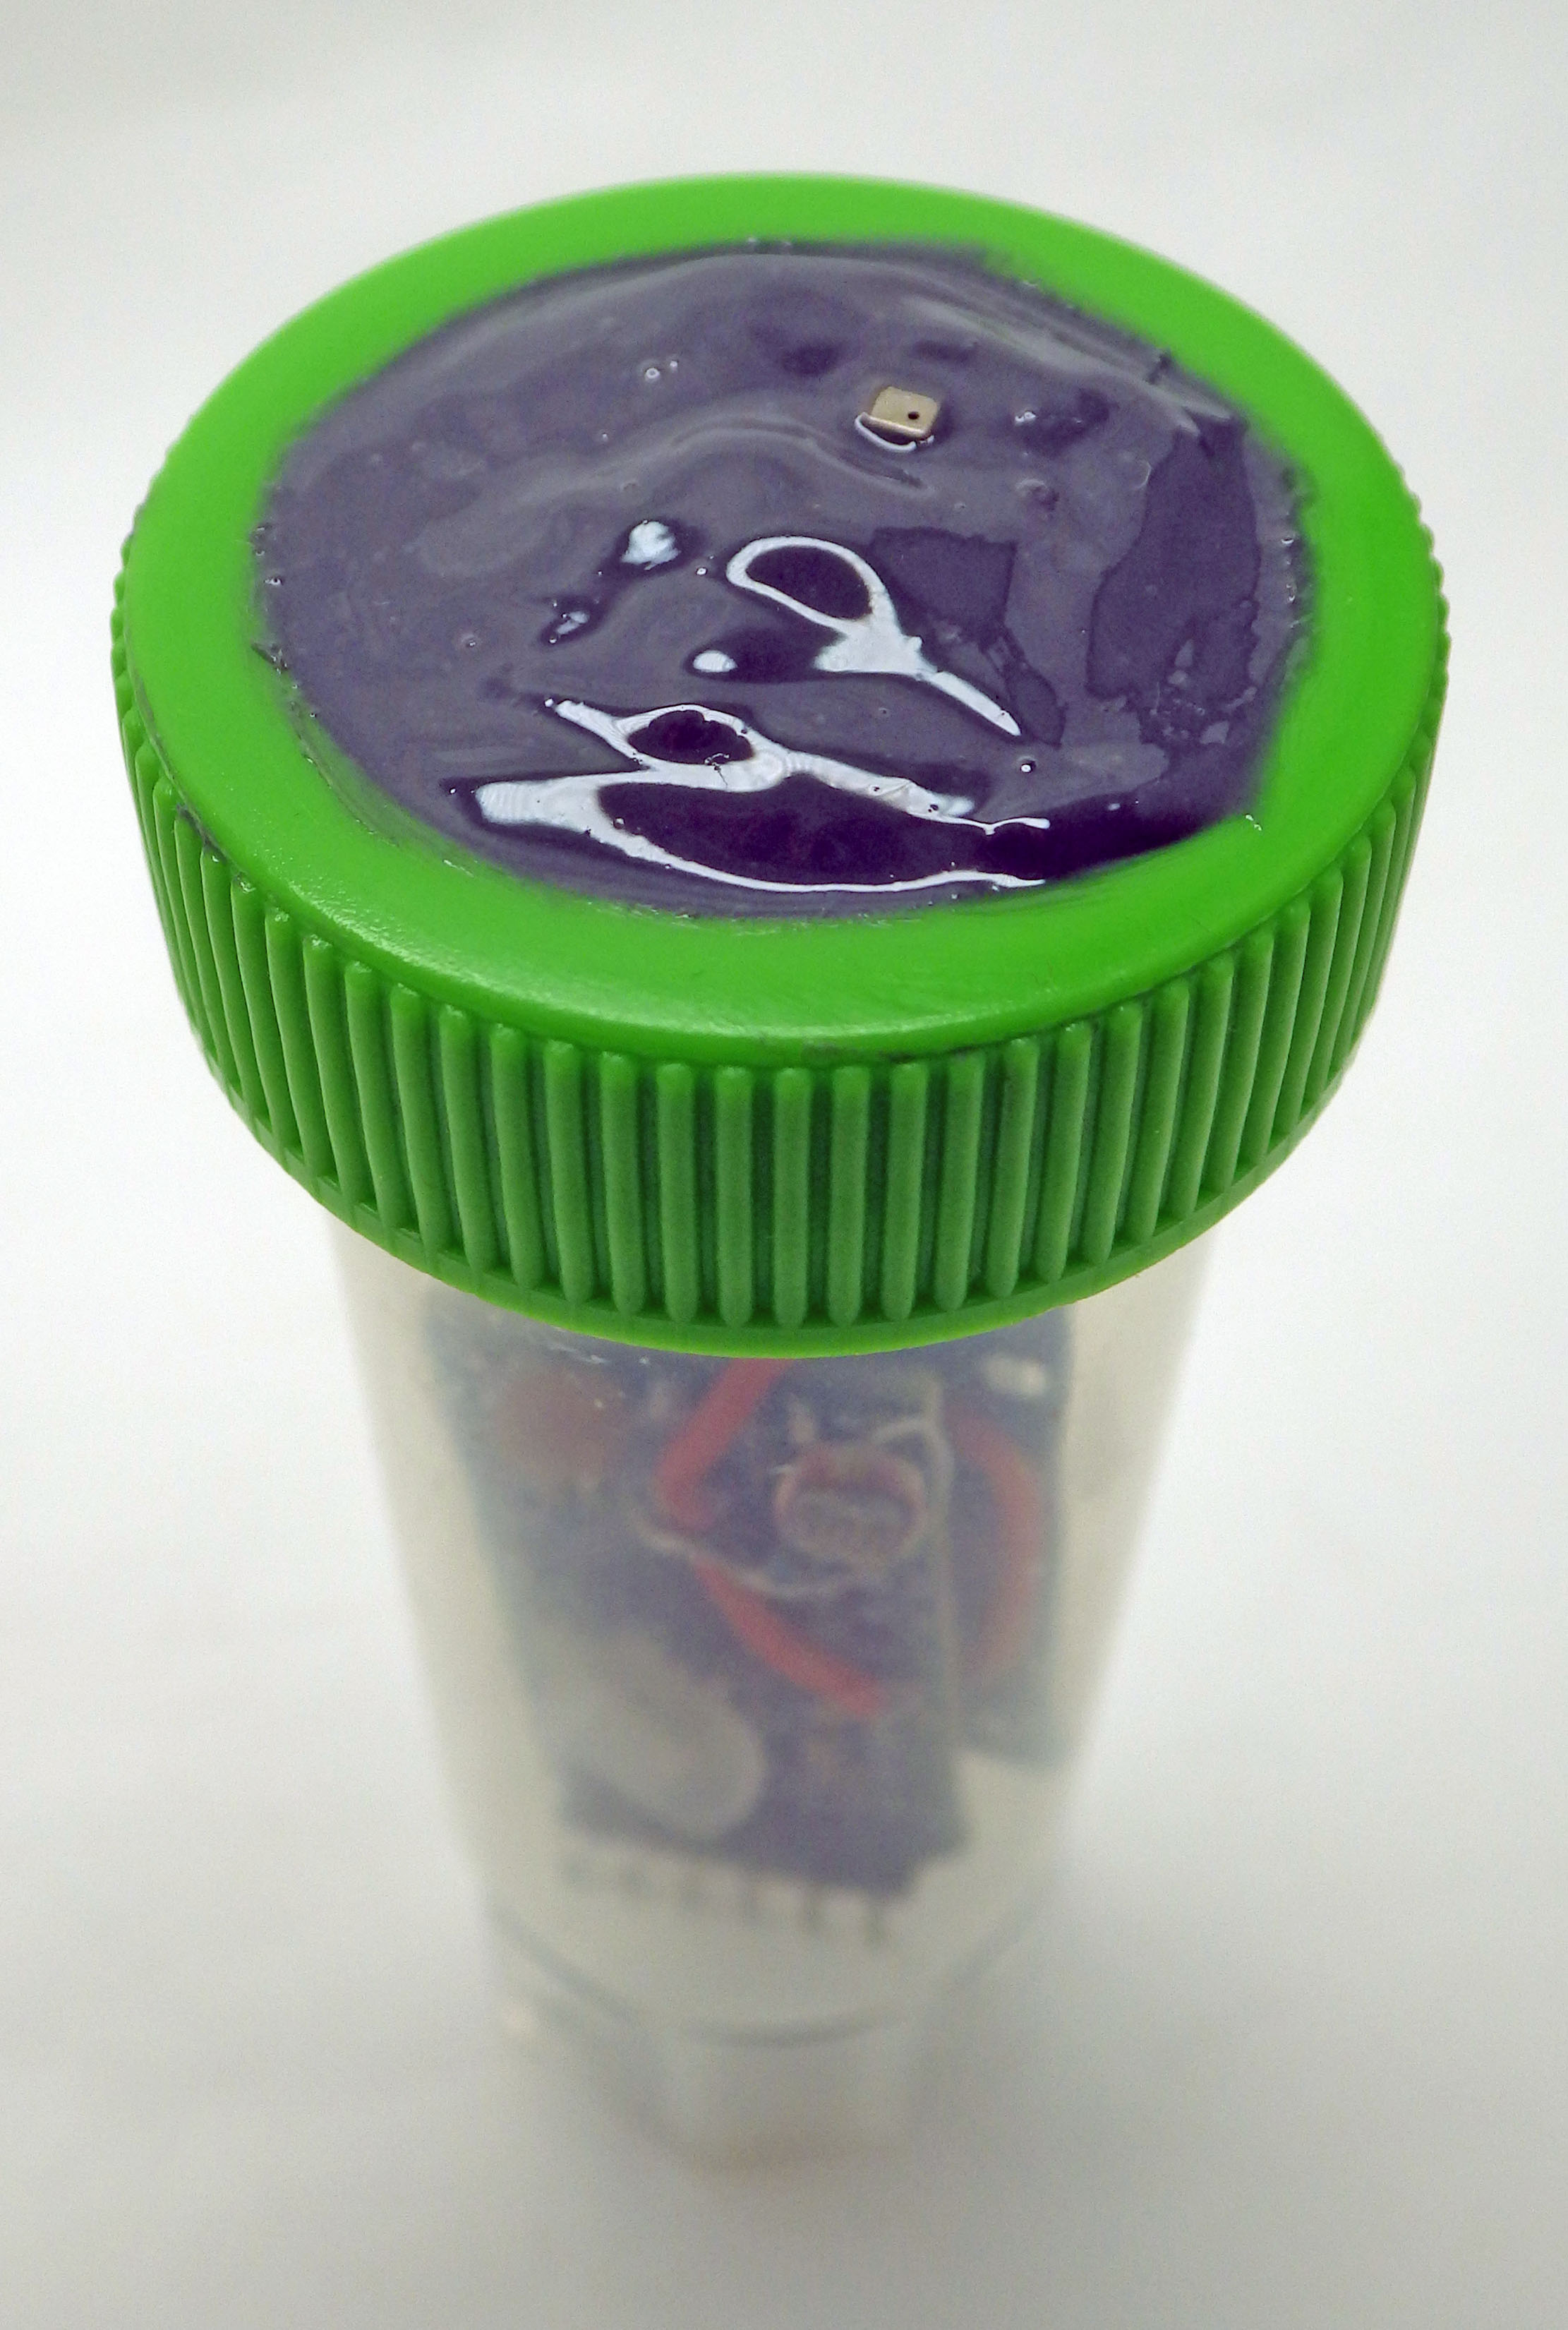
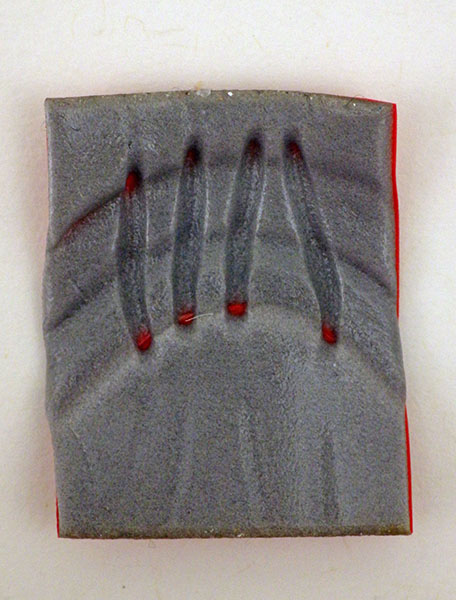
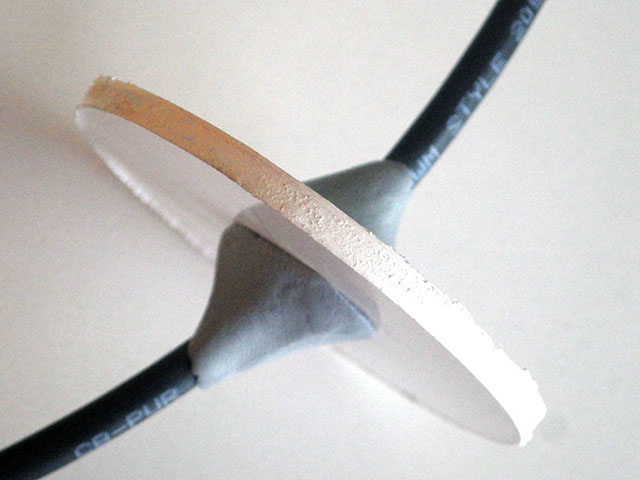
30ml self-standing Caplugs from Evergreen Labware are a good housing option because they have a brace in the cap that just fits four 22gauge silicone jacket wires. The ‘non-sterile’ versions with separate caps are much cheaper to buy than the sterile ones. The outer groove in the lid provides more surface area for JB-weld epoxy, giving you an inexpensive way to encapsulate external sensors. 1oz / 25ml is enough to cover about five sensors. Then clear JB weld can be used as a top-coat to protect optical sensors.
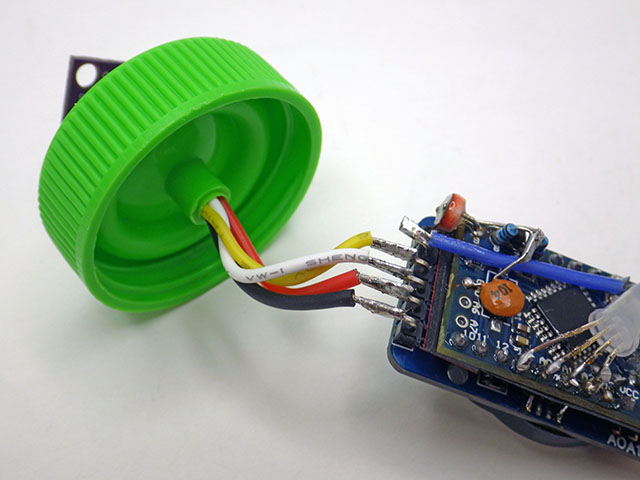
Drill the central channel to pass the I2C wires through the cap. Roughen the upper surfaces with sandpaper to give it some tooth for the epoxy.
Conformal coat the board before the epoxy. Work the epoxy over the sensor board carefully with a toothpick and wipe away the excess with a cotton swab.

We’ve done pressure tests to 45psi and these tubes can be deployed to ~20m depth, although we don’t yet have any data yet on how long they will endure at that pressure. These housing tubes should be replaced every three months if they are exposed to sunlight because UV makes the plastic brittle. Adding a very small amount of silicone grease to only the upper edge of the tube before closing improves the seal with the lid but don’t add too much or the threads will slip. Holes drilled through the bottom stand enable zip-ties to secure the logger. In our cross calibration of a Bh1750 Lux sensor to measure PAR (Photosynthetically Active Radiation) , we wrapped the body tubes with 2″ aluminum foil tape to reduce heat gain inside the body tubes.
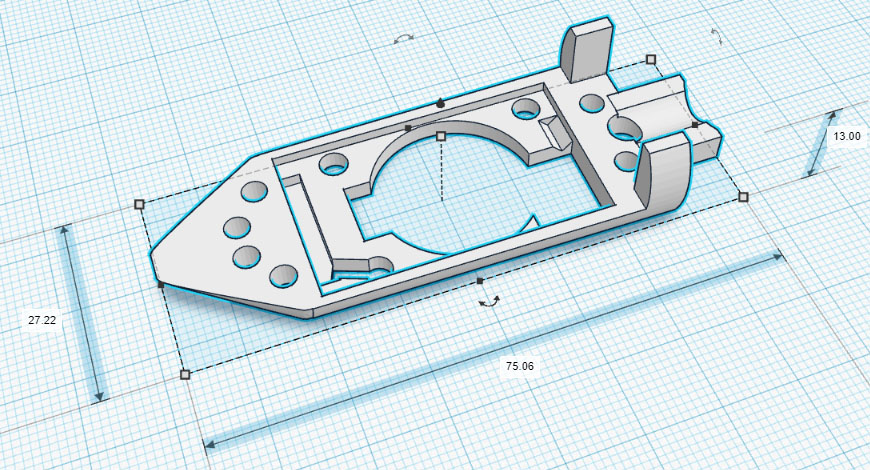
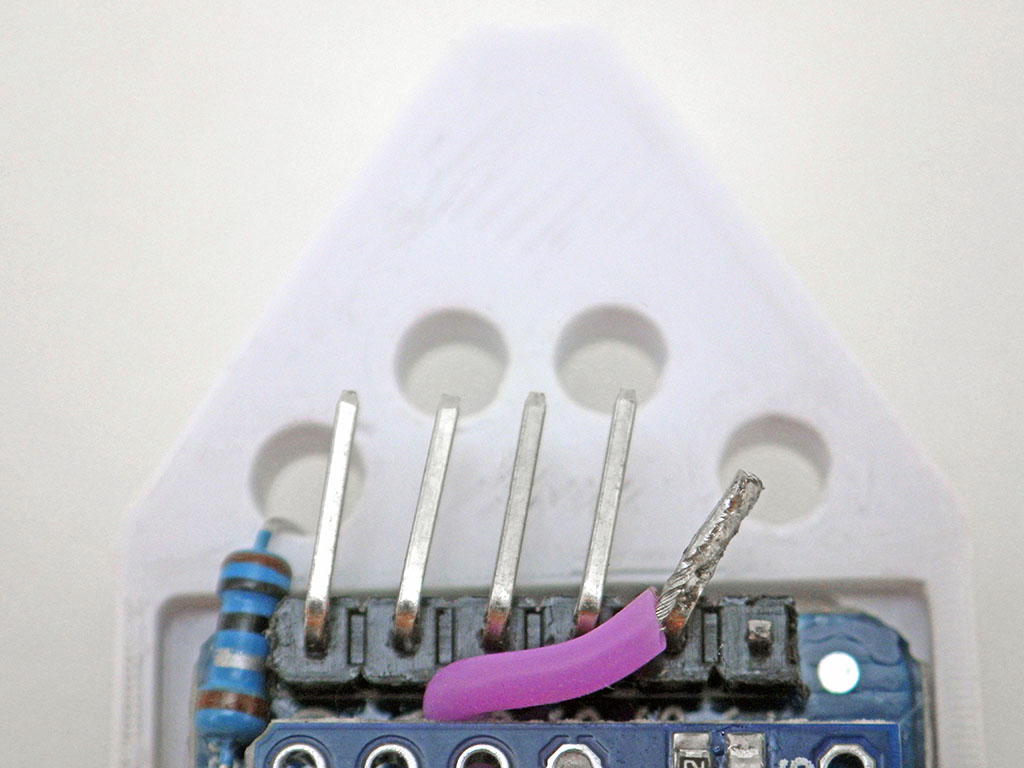
We have produced small printable rails for the 30ml tubes often used with this two module logger. So here is a link to that shared model on Tinkercad. That internal rail & an external mounting bracket is posted at Github. The easiest way to secure the logger to these rails is with a drop of hot glue from the underside but I usually twist and solder the legs of a scrap resistor as the tie as I have lots of these lying around:
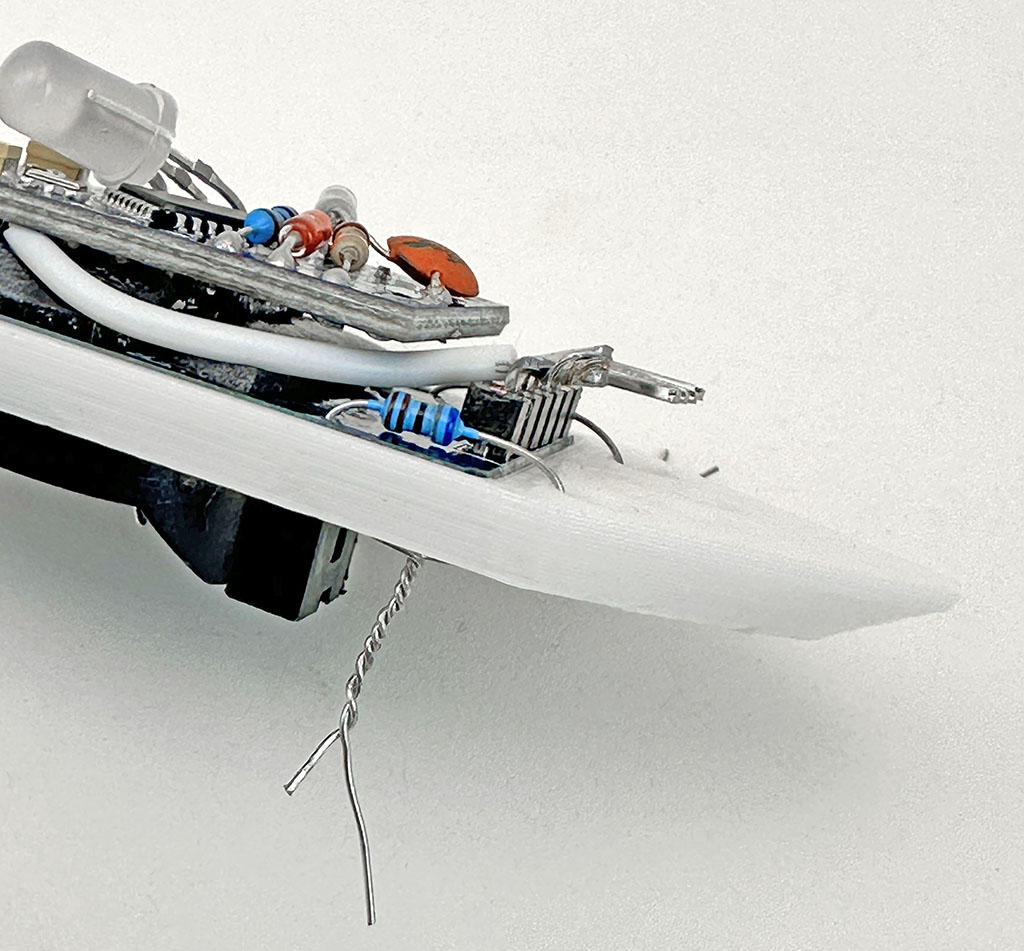
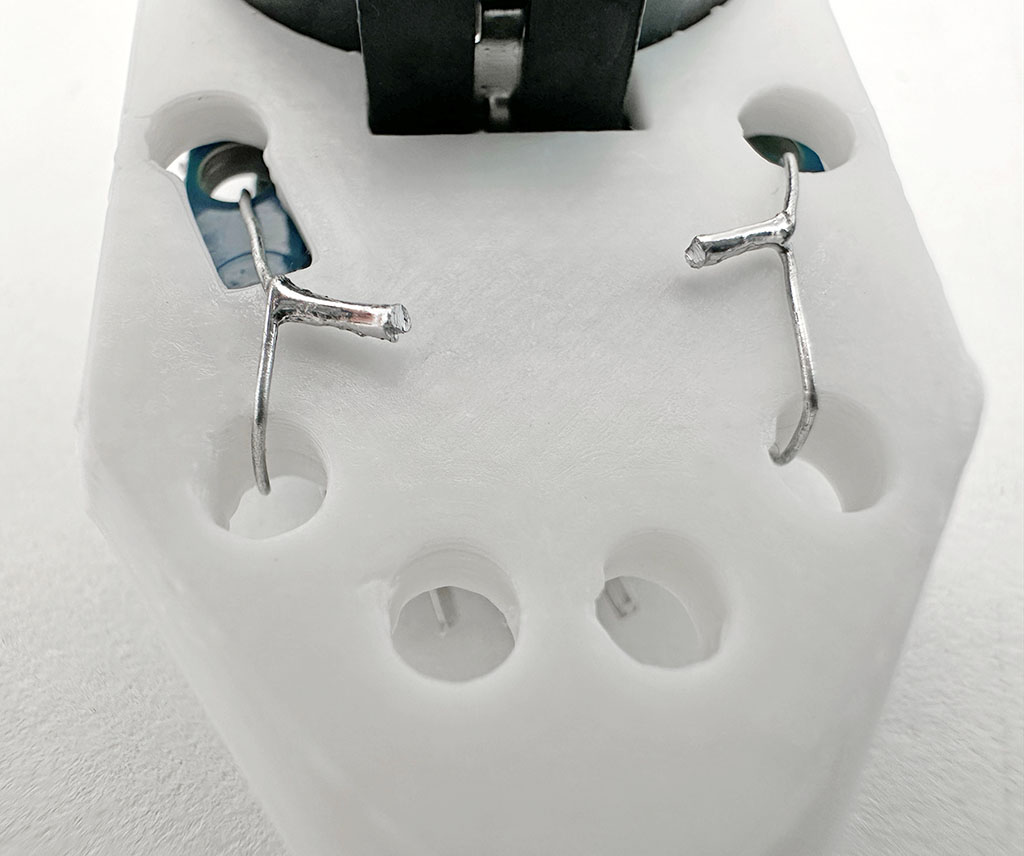
Insert a scrap resistor into the mounting holes and twist the legs together.
Solder the twisted legs and trim. Angle the joint inwards to avoid scratching the tube.
Angle the I2C headers slightly toward the point of the tube to leave more room for Dupont connectors during the NTC calibration.
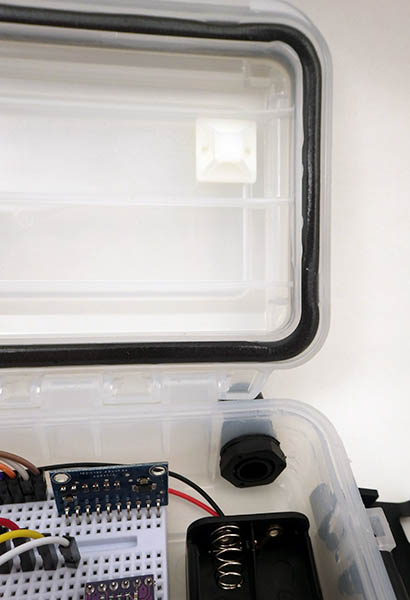
There’s room for two or three 0.5gram silica gel desiccant packs in the lid area. Because the ProMini remains exposed, I don’t usually add conformal to the ProMini until the logger has passed all of its pre-deployment run tests. After that I add a generous layer of conformal to everything but the battery contacts and the header pins. Clear nail polish also works for this.

For deeper aquatic deployments, you could use a stronger PET preform for the enclosure. These have very thick walls because they are the blanks that are thermally blow-molded to create soda bottles. You will need to find ones larger than the standard 2L bottle preforms which have an internal diameter of only 21mm. This is just a bit too tight for the RTC module. The 30ml centrifuge tubes shown above have an internal diameter of 26-27mm.


Testing Your New Logger

Make at least two machines at a time. I usually build in batches of six, and for every dozen at least one usually ends up with some kind of issue like an RTC temp. register outside the ±3°C spec, or a ProMini with one of those fake 328p processors that draws too much sleep current. Having more than one logger makes it easy to identify when you’ve got an a hardware problem rather than an error in your code. Even then, no unit is worth more than an hour of troubleshooting when you can build another one in less time. Seriously! The part cost on these things is well below $10, which is often less than you’d pay just to replace the battery on other loggers. This also applies to maintenance: just run till it fails and then replace it. In our experience, most inexpensive sensors have a reliable lifespan of less than two years in the field.

A good general approach to testing any DIY build is to check them with a doubling schedule: Start with rapid UART tethered tests via the serial monitor at second intervals, then initial stand-alone tests for 1,2,4 & 8 hours till you run overnight, followed by downloads after 1day, 2days, 4days, 8days, etc. For those initial burn-in tests, set the interval short enough that the entire memory gets filled. Valid sampling intervals must divide evenly into 60 and second-intervals can be set for rapid testing if you first enter 0 for the minutes.

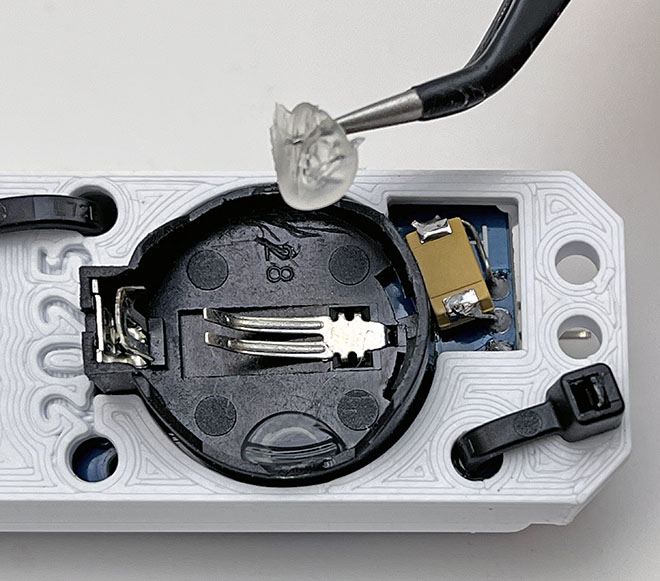
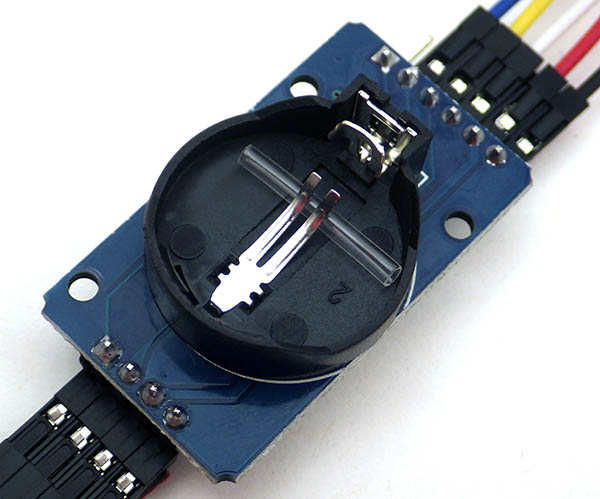
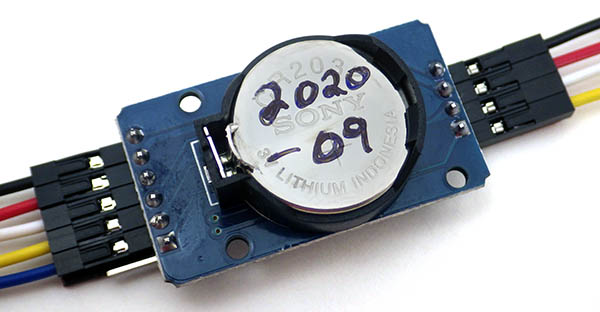
Weak battery springs, or sloppy plastic molding on the RTC module can make a logger vulnerable to bumps that disconnect power (causing the logger to shut down). Most of the time the battery can be secured reasonably well by simply by laying a line of hot glue along the top edge opposite the positive contact spring. This is easily removed after the deployment:
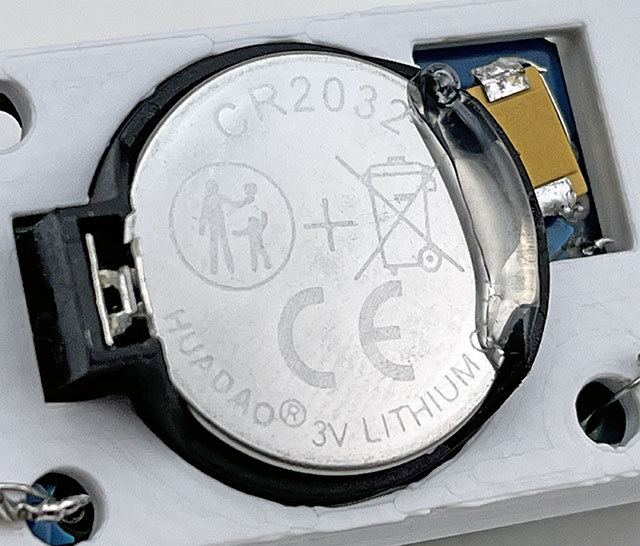
Occasionally you get an RTC module with a battery holder loose enough that the coin cell can actually rock from side to side, pivoting on the negative contact spring. This more extreme loose battery case requires two drops of glue under the coincell:
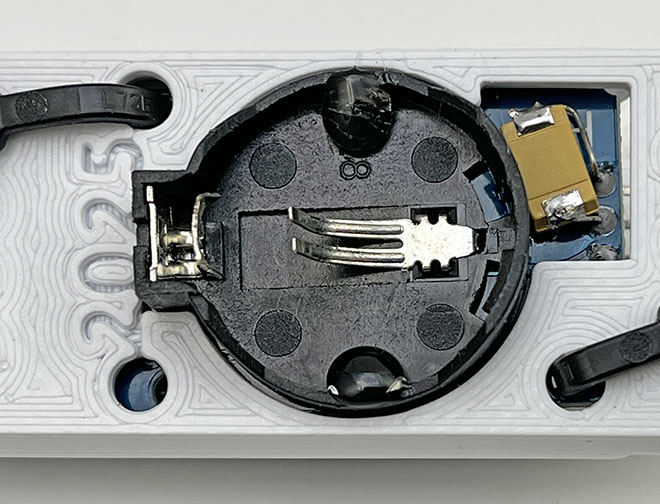
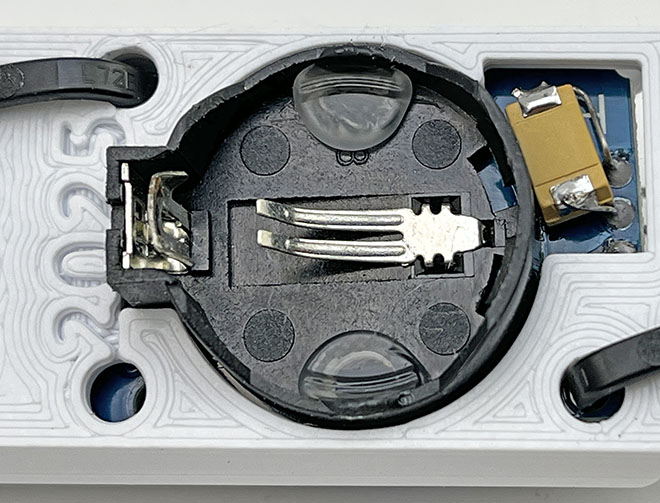
Place a small drop of hot glue on both sides of the battery holder taking care not to get any on the metal contacts. While the glue is still hot, GENTLY press in a new coin cell in until the side clip engages.
Don’t press the battery too hard – the glue should remain thick enough to brace both sides of the battery. The photo above shows the intended shape after battery removal: The glue is perfectly conformed to the edges of the cell and is nowhere near the metal contacts.
The battery will be significantly more difficult to remove at the end of a deployment, as compared to the glue line on top. So this more robust 2-drop approach is usually reserved for critical/rough deployments.

The shape of the battery burn-down curve during your pre-deployment testing is and excellent predictor of reliability! But to use that information you need to be running several identical machines at the same time, and start those runs with fresh batteries. I use the cheapest batteries I can get for these tests, knowing the better quality batteries I use on deployment will last much longer.

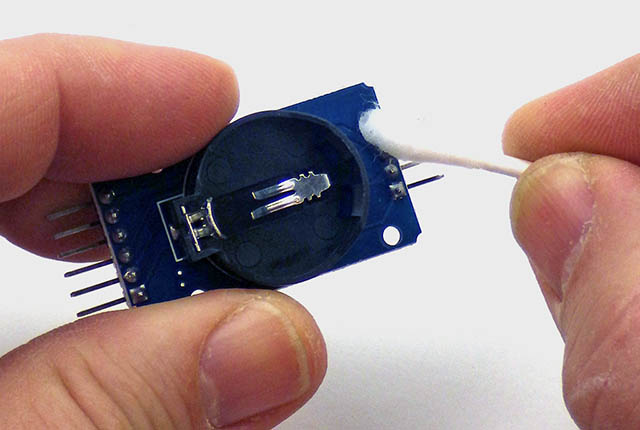
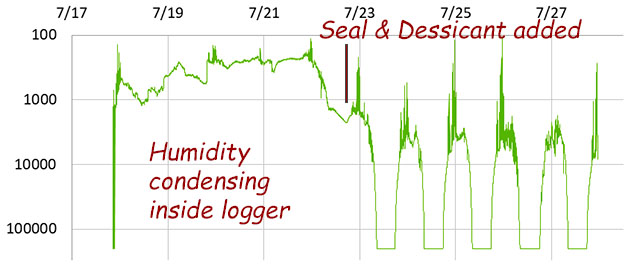
Remember that eBay/Ali/Amazon sensor modules are cheap for a reason and it’s not unusual to see 20% of them rejected for strange behavior or infant mortality. So huddle test each batch to normalize them. Relative accuracy spec for the BMP280 is supposed to be ±0.12 millibar, but when I run a batch of them side-by-side I usually see ±4 millibar between the records. Cheap BMEs sometimes refuse to operate with it’s individual RT/T/Pr sensors set at different oversampling levels, and at the highest resolution (16x oversampling) that sensor may draw more than your power budget can sustain over a long deployment. Real-world installation inevitably exposes the logger to condensing conditions. Sensors with a metal covers (like the BMP/E series) will experience internal condensation at the dew point. Moisture creep is the largest cause of data loss on the project after theft/vandalism. So cleaning leftover flux from all parts with cotton swabs + 90% isopropyl alcohol before & after assembly is always worth your time. So is conformal coating and you can use clear nail polish for that if silicone coatings are hard to find.

And all the other quid-pro-quos about vendors apply: Split your part orders over multiple suppliers with different quantities, ordered on different days, so you can isolate the source of a bad shipment and/or identify suppliers that are OK. Don’t be surprised if that batch of sensor boards you ordered transmogrifies into a random delivery of baby shoes. Amazon is often cheaper than eBay and AliExpress is 1/4 the price of both. Trusted suppliers increase part costs by an order of magnitude but that may still be worth it if you don’t have time for enough test runs to eliminate the duds.


Power Optimization on this Data Logger:

A (relatively high) average sleep current of ~5µA*86400 sec/day would use ~432 milliAmpseconds/day from a Cr2032 that can provide roughly 360,000 mAs of power [100mAh] on its main voltage plateau . Any power saving strategy must be weighed against this daily amount to determine if the complexity it adds to your code will deliver a proportional increase in operating time. I rarely see a sensor sample reading use more than 1 milliamp-second of power – even with relatively high drain sensors like the BME280. So most of the power used by this logger is due to the DS3231 RTC’s 3µA timekeeping current which can not be changed but battery voltage droop during peak current events is usually what triggers the low voltage shutdown and that is affected by code execution.

8MHz ProMini boards draw about 3.5mA when running at 3v. Slow functions like digitalWrite() and pinMode() are replaced with much faster port commands wherever power and/or timing are critical. Pin states, peripheral shutdowns (power_all_disable(); saves ~0.3mA) and short sleeps are used throughout for battery voltage recovery. Waking the 328p from those powerdown sleeps takes 16,000 clock cycles (~2milliseconds @8MHz +60µS if BOD_OFF) and but the ProMini only draws ~300µA while waiting for the oscillator to stabilize. These wakeups only use about 1mAs/day.

The original code released in 2022 used CLKPR to bring the ProMini down to 1MHz (lowering runtime current from 3.5mA to ~1.3 mA) however testing later revealed that the total energy cost per logging event actually increased slightly when the system clock was divided. In addition, I came across several EEproms that would freeze if I lowered the system clock to 1MHz during save. So I have removed the CLKPR calls to make the codebase more portable. I also found that the startup-time also gets multiplied by the CLKPR divider. This might be the only documentation of this on the web, so I’m leaving this information here – even though CLKPR is no longer relevant to the logger:

( Note: For the following images a Current Ranger was used to convert µA to mV during a reading of the RTC’s temperature register at 1MHz. So 1mV on these oscilloscope screen shots = 1µA is being drawn from the Cr2032 )
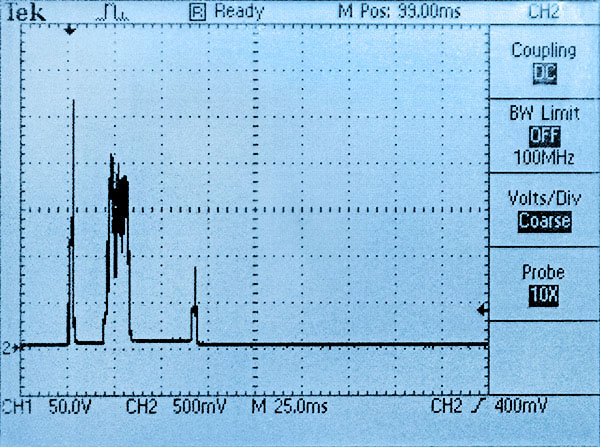
Here CLKPR restores the CPU to 8MHz just before entering powerdown sleep, and then slows the processor to 1MHz after waking. The extra height of that first spike is due to the pullup resistor on SQW. Cutting the trace to that resistor and using an internal pull-up reduces wake current by 750µA.
Here the 328p was left CLKPR’d down to 1MHz when it entered powerdown sleep(s). Waking the processor now takes 16 milliseconds – wasting a significant amount of power through the 4k7 pullup on SQW while the RTC alarm is still asserted.

Using the 328s internal oscillator to save power is a non-starter because it’s 10% error borks your UART to the point it can’t upload code. Our ICU based timing method also needs the stability of the external oscillator.

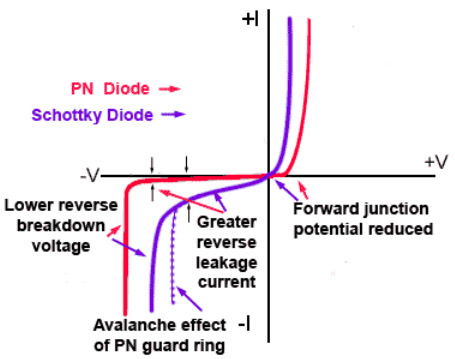
That bridge between the coin cell and VCC means UART connection time probably is shortening battery lifespan a bit. Panasonic specifies: “the total charging amount of the battery during it’s usage period must be kept within 3% of the nominal capacity of the battery”, so it’s a good idea to remove the coin cell if you are spending an extended time on serial. But given our tight operational margin we can’t afford to lose 200mv over a Schottky protection diode. A typical solution would address this by ORing the two supplies with an ideal diode circuit but that’s not a option here as ideals usually waste some 10-20 µA. On a practical level it’s easier to just to pop in a fresh battery before every long deployment.

EEprom & sensor additions can push directly measured continuous sleep currents to 2µA (so ~5 µA average when you add the RTC temp conversions) but that still gives a >1 year estimates on 110mAh. With all due respect to Ganssle et al, the debate about whether buffering caps should be used to extend operating time is something of a McGuffin because leakage is far less important when you only have enough memory space for one year of sensor readings. Even a whopper 6.3v 1000µF tantalum only increases sleep current by ~1µA. That’s 1µA*24h*365days or about 10 mAh/year in trade for keeping the system well above the 2.8v cutoff. That means we don’t need to lower the BOD with fuse settings & custom bootloaders. When you only service your loggers once a year, any tweaks that require you to remember ‘special procedures’ in the field are things you’ll probably regret.

Capacitor leakage scales linearly so use the Falstad simulator to see what size of rail buffer you actually need. Capacitors rated 10x higher than the applied voltage reduce leakage currents by a factor of 50. So your buffering caps should be rated to 30v if you can find them. The 220µF/25v 227E caps I tested only add ~15nA to the loggers sleep current and these can be obtained for <50¢ each. (& 440uF 10v caps leak around 25nA) High voltage ratings get you close to the leakage values you’d see with more expensive Polypropylene, Polystyrene or Teflon film caps and moves away from any de-rating issues. The one proviso is that as the buffering cap gets larger you will need to add more ‘recovery time’ in the code before the rail voltage is restored after each code execution block. Sleeping for 30msec after every I2C transaction is a safe starting point, but you’ll need a scope to really tune those sleeps for large sensor loads like you see with a BME280 at 16x oversampling. If moisture condenses inside the housing on deployment, and the logger mysteriously increases from 1-2 µA sleep current to something higher then replacing the tantalum rail buffering cap is one of my first diagnostic steps. Bad/cooked tantalum rail caps should always be your first suspect when you get a logger with an unusually high continuous sleep current.

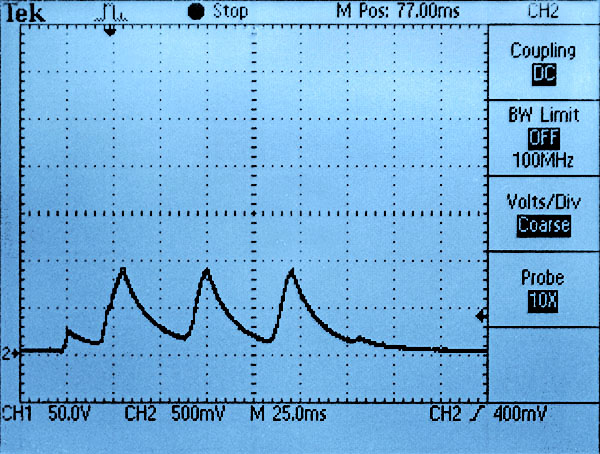
In the next three images, a Current Ranger converts every 1µA drawn by the logger to 1mV for display on the ‘scope. The last two spikes are transfers of 16-bytes into the 4K EEprom on the RTC module while the CPU takes ADC readings of the rail voltage. Note that our current code saves readings as a single event at the end of each pass through the main loop, but I forced multiple large saves for this test to show the effect of repeated pulse-loads:

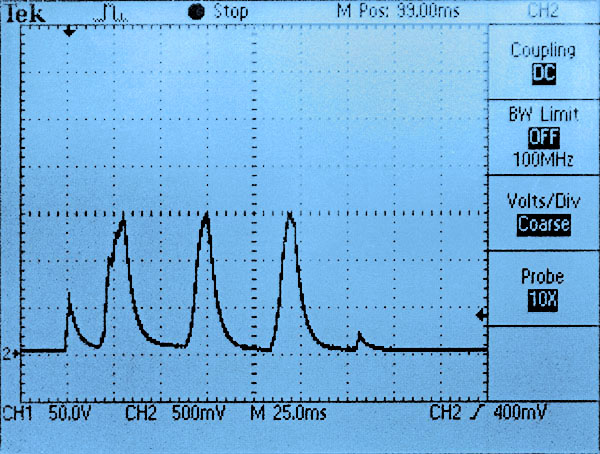
A triple event with a temperature sensor reading followed the transfer of two array buffers to EEprom. Battery current with no rail buffering cap. [Vertical scale: 500µA /division, Horizontal: 25ms/div]
Here a 220µF tantalum capacitor was used to reduce the peak battery currents from 2.5mA to 1.5mA for that same event.
Here a 1000µF tantalum [108J] capacitor reduces the peak battery current to 1mA. The 30msec sleep recovery times used here are not quite long enough for the larger capacitor.
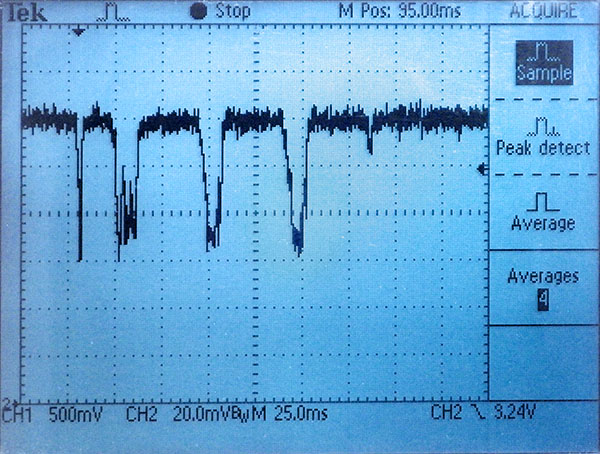
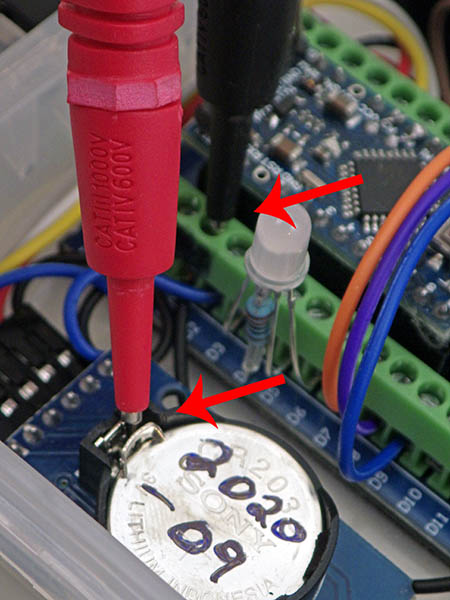
Voltage across a coin cell that’s been running for two months with NO buffering capacitor. The trace shows the 2.5mA loads causing a 60mv drop; implying the cell has ~24 ohms internal resistance. [Vertical Scale: 20mv/div, Horizontal: 25ms/div]

The minimal RTC-only sensor configuration reached a very brief battery current peak of ~2.7mA with no buffering cap, 1.5mA with 220µF and less than 1mA with 1000µF. The amount of voltage drop these currents create depend on the coin cells internal resistance but a typical unbuffered unit usually sees 15-30mV drops when the battery is new and this grows to ~200mV on old coin cells. The actual voltage drop also depends on time, with subsequent current spikes having more effect than the first as the internal reserve gets depleted. The following images display the voltage droop on a very old coin cell pulled from a logger that’s been in service since 2016 (@3µA average RTC backup)
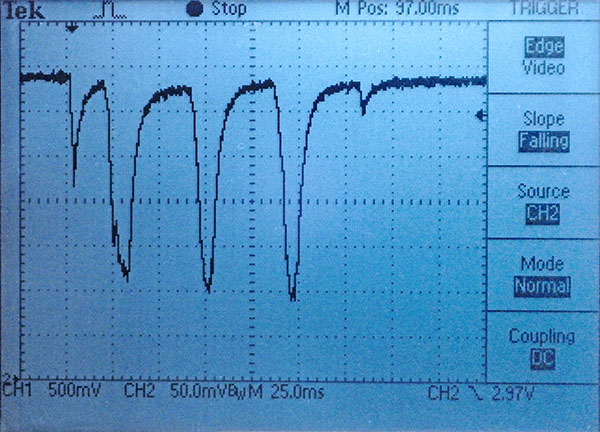
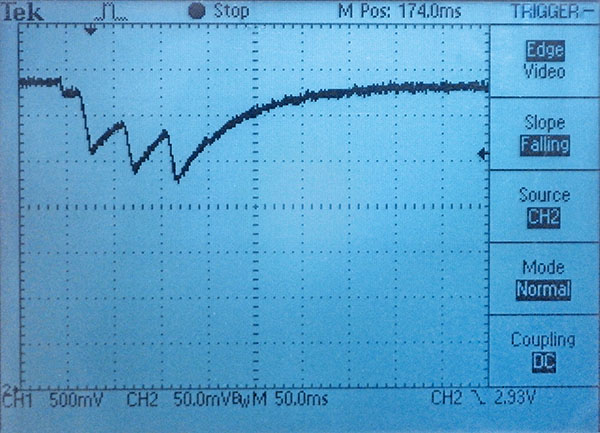
This very old coin cell experiences a large 250mv droop with no capacitor buffer. Note how the initial short spike at wakeup does not last long enough to cause the expected drop. [Vertical: 50mv/div, Horizontal: 25ms/div]
Adding a 220µF/25v tantalum capacitor cuts that in half but triples the recovery time. CR2032‘s plateau near 3.0v for most of their operating life, so the drop starts from there.
[Vertical: 50mv/div, Horizontal: now 50ms/div]
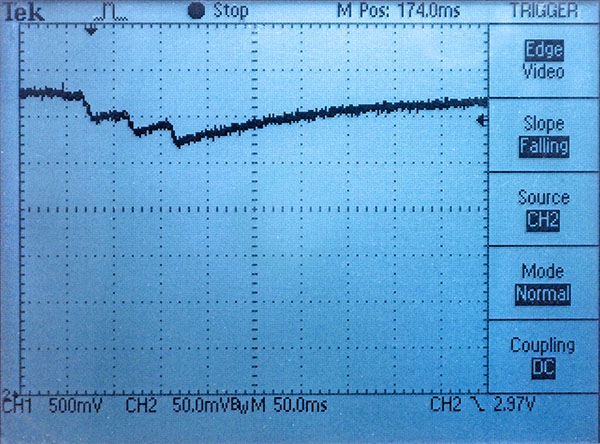
A 1000µF/6.3v tantalum added to that same machine limits droop to only 60mv. Recharging the capacitor after the save now approaches 200 milliseconds. [Vertical : 50mv/div, Horizontal: 50ms/div]

According to Nordic Semi: “A short pulse of peak current, say 7mA for 2 milliseconds followed by an idle period of 25ms is well within the limit of a Cr2032 battery to get the best possible use of its capacity.” After many tests like those above, our optimal ‘peak shaving’ solution is to run the processor at 8MHz, breaking up the execution time with multiple 15-30 millisecond POWER_DOWN sleeps before the CR2032 voltage has time to fall very far. (especially necessary if you start doing a lot of long integer or float calculations) This has the benefit that successive sensor readings start from similar initial voltages but those extra sleeps can easily stretch the duration of a logging event out toward 300 milliseconds – putting limits on the loggers maximum sampling rate:
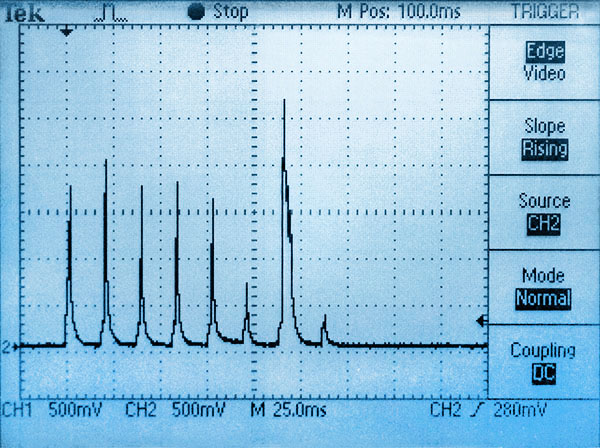
Current drawn in short bursts of 8MHz operation during sensor readings. The final EEprom save peaks at ~2.75mA draw (in this old example with CLKPR 1MHz CPU which we no longer do)
[CH2: H.scale: 25msec/div, V.scale 500µA/div converted via Current Ranger]
Voltage droop on that same ‘old’ CR2032 used above reached a maximum of 175mv with NO buffering capacitor across the rail. This battery has about 64 ohms of internal resistance.
[CH2: V.scale 25mv/div, H.scale 25ms]
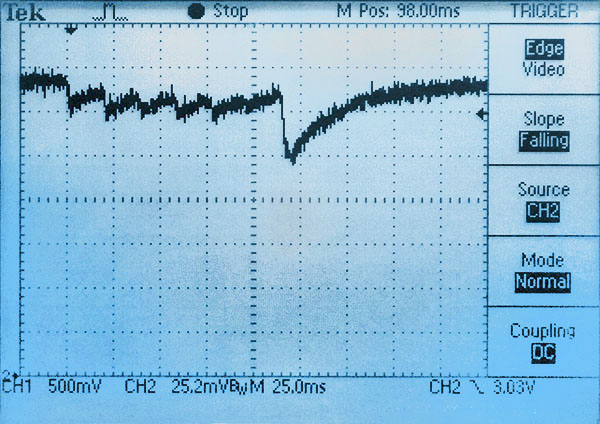
Adding a 220µF tantalum capacitor to the rail holds that old battery to only 50mv droop. The 25v tantalum cap adds only 0.1µA leakage to the overall sleep current.
[CH2: V.scale 25mv/div, H.scale 25ms]

EEprom save events are typically around 3.5 mA for 6ms. Without a rail buffer a new coincell will fall about 100mv. With a 200µF rail buffering cap supplying the initial demand the peak current drawn from the coin cell is less than 1.5mA – which limits the overall voltage droop to less than 50mv. Even with very old batteries a typical EEsave event doesn’t usually drop the rail more than 150mv with a rail buffer cap, however the recovery time grows significantly with battery age – from less than 25 msec when new to more than 150 milliseconds for a full recovery. So old battery logging events look more like ‘blocks’ on the oscilloscope trace rather than the series of short spikes shown above.
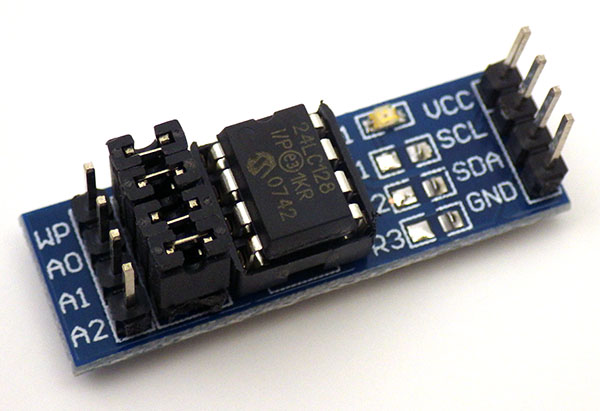
This ‘solder-free’ AT24c256 DIP-8 carrier module is bulky but it lets you easily set multiple I2C address. Here I’ve removed the redundant power led & pullup resistors. Heliosoph posted a way to combine multiple EEproms into a single linear address range

Even with fierce memory limitations we only use the 328’s internal 1k EEprom for startup index values and text strings that get written while still tethered to the UART for power. EEprom.put starts blocking the CPU from the second 3.3msec / byte, and internal EEprom writing adds an additional 8mA to the ProMini’s normal 3mA draw. This exceeds the recommended 10mA max for a garden variety Cr2032. Multi-byte page writes aren’t possible so data saved into the 328p costs far more power than the same amount saved to an external EEprom. However it is worth noting that reading from the internal EEprom takes the same four clock ticks as an external with no power penalty, while PROGMEM takes three and RAM takes two clock cycles. So it doesn’t matter to your runtime power budget where you put constants or even large lookup tables.

A simple optimization we haven’t done with the code posted on GitHub is to buffer data into arrays first, and then send that accumulated data with larger wire library buffers. All AT-series EEproms can handle the 4k’s 32-byte page-write but the default wire library limits you to sending only 30 bytes per exchange because you lose two bytes for the register location. So to store sensor readings in 32-byte buffer arrays and transfer those you need to increase the wire library buffers to 34 bytes. This has to be done by manually editing the library files:

In wire.h (@ \Arduino\hardware\arduino\avr\libraries\Wire\src)
#define BUFFER_LENGTH 34
AND in twi.h (@ \Arduino\hardware\arduino\avr\libraries\Wire\src\utility)
#define TWI_BUFFER_LENGTH 34

That twi buffer gets replicated in three places so the wire library would then require proportionally more variable memory at compile time . With larger EEproms you could raise those buffers to 66 bytes for 64 data-byte transfers. It’s also worth mentioning that there are alternate I2C libraries out there (like the one from DSS) that don’t suffer from the default wire library limitations. AT series EEproms always erase & rewrite an entire page block no matter how many bytes are sent, so increasing the number of bytes sent per save event reduces wear and can save significant amounts of power. In my tests, newer larger EEproms tend to use about the same power as smaller older EEproms for identical save events because even though they are re-writing larger blocks, they do these internal operations much faster. So a ‘typical’ EEprom write event uses somewhere between 0.30 to 0.5 millamp-seconds of power no matter how many bytes you are saving. If your daily sleep-current burn is about 300milliampseconds, then it takes a few hundred of those EEprom save events to use the same amount of power. Increasing the transfer payload (with temporary accumulation arrays) from the I2C default of 16 bytes to 64 bytes cuts EEsave power use by 75%. That can extend the loggers operating life with short sampling intervals of 1-5 minutes, or where your sensors generate many bytes per record. Despite several technical references saying otherwise, I saw no significant difference in save duration or power (on the oscilloscope) with EEprom locations prewritten to all zeros or 0xFF before the data save events. One thing that does make an enormous difference is transferring blocks that exactly match the EEproms hardware page size – if you get the alignment perfect then EEproms can write the new information without all the preload & insertion operations you see when saving smaller amounts of data. This cuts both the time and the power for EEprom saving by 50% if you have enough memory for all the pre-buffering that requires.

Because of the code complexity we have not implemented array buffering in the current code-build so that the codebase is understandable for beginners. Every pass through the main loop saves data to the external EEprom and these loggers still have an excellent operating lifespan without it. For many EEprom types, when doing a partial write of fewer bytes than the hardware page size, the data in the rest of the page is refreshed along with the new data being written. This will force the entire page to endure a write cycle, so each memory location in the EEprom may actually get re-written [EEprom hardware page size / Bytes per Save ] times, which for the 4k would typically be 32/4 = 8 times per run. EEproms have a ‘soft’ wear limit of about 1,000,000 write cycles, so even in that worst-case scenario the logger could fill that chip 125,000 times before wearing the EEprom out. But buffering can make the eeprom last longer, or extend operating life in ways other than the battery power that’s saved.

FRAM takes about 1/50th as much power to write data compared to standard EEproms but those expensive chips often sleep around 30µA so they aren’t a great option for low-power systems like this logger unless you pin-power the chips so you can disconnect them during sleep. FRAM can endure more than 10 billion, 50 nano-second, write cycles, making it better suited for applications where rapid burst-sampling is required. The I2C bus is not really fast enough take advantage of FRAMs performance, but with the SD card removed from the logger the four SPI bus connections are now available. Once your code is optimized, the majority of the loggers runtime power is consumed by the 328p burning 3.5mA while it waits around for the relatively slow I2C bus transactions – even with the bus running at 400khz.
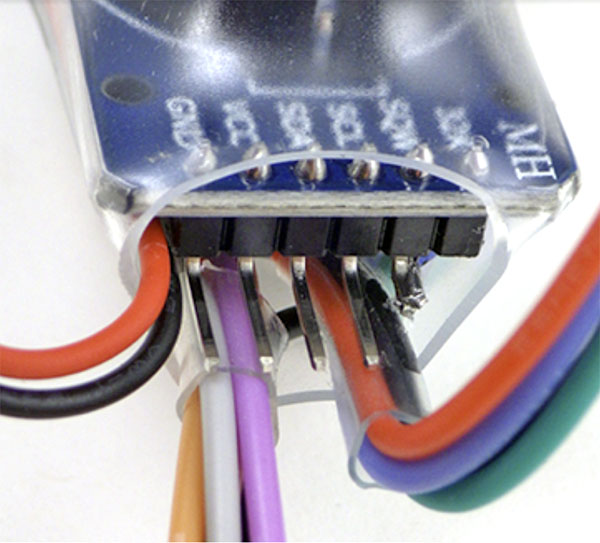
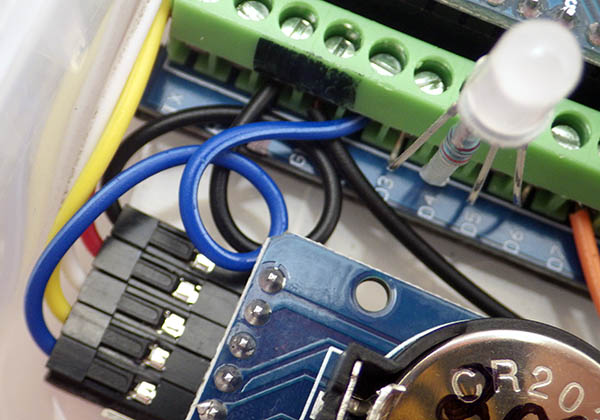
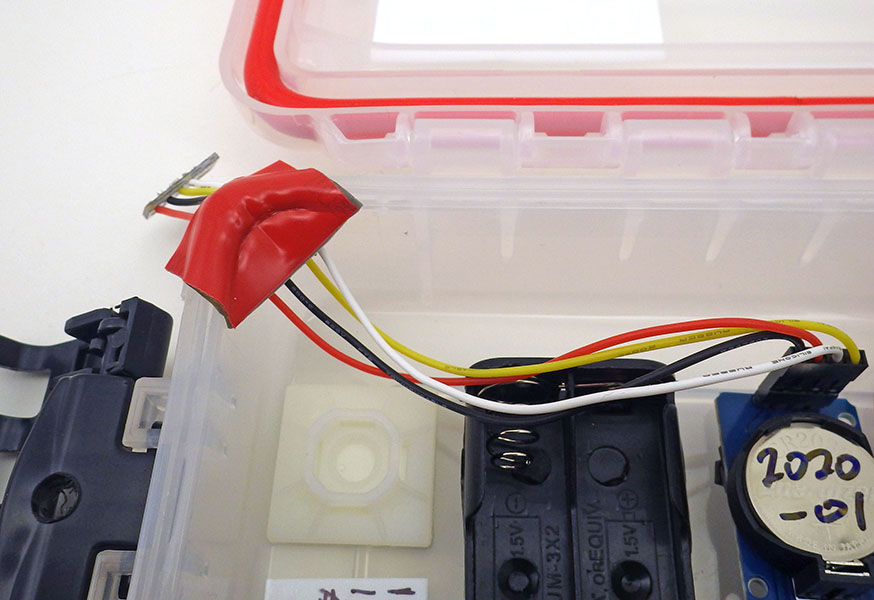
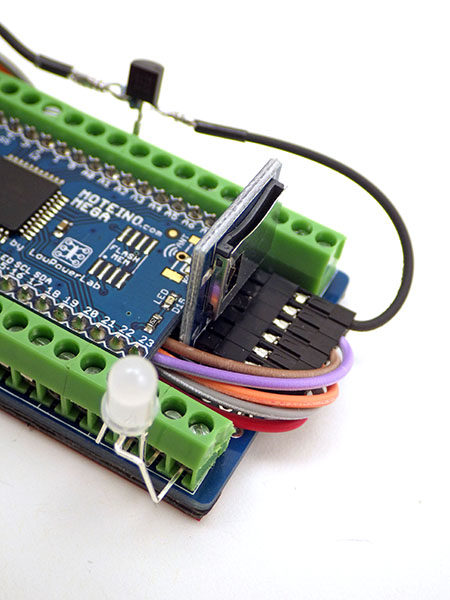
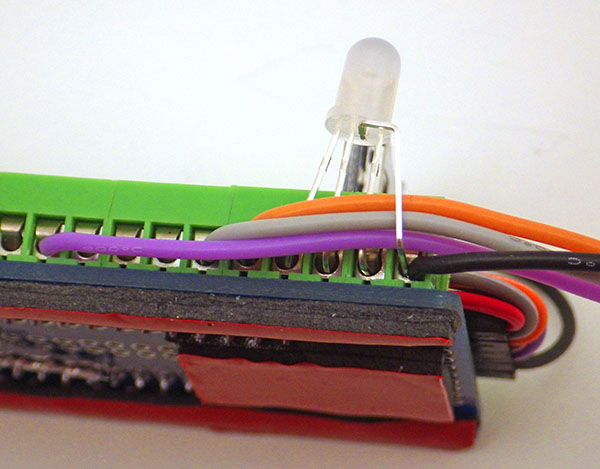
Here wires extend connections for the thermistor & LED to locations on the surface of the housing.

No matter what optimizations you make, battery life in the real world can also be shortened by thermal cycling, corrosion from moisture ingress, being chewed on by an angry dog, etc. And you still want the occasional high drain event to knock the passivation layer off the battery.

An important topic for a later post is data compression. Squashing low-rez readings into only one byte (like we do in the base code with the RTC temperature & battery voltage) is easy; especially if you subtract a fixed offset from the data first. But doing that trick with high range thermistor or lux readings is more of a challenge. Do you use ‘Frame of Reference’ deltas, or XOR’d mini-floats? We can’t afford much power for heavy calculations on a 328p so I’m still looking for an elegant solution.


Some Run Test Results

Since we covered adding BM & BH sensors, here’s a couple of burn-down curves for the two configurations described above. Both were saving 4 bytes of data per record every 30 minutes giving a runtime storage capacity of about 150 days. In this test, Battery was logged each time 16-byte buffer-arrays were written to a 32k EEprom. Both loggers have a measured sleep current of ~1.5µA and they were downloaded periodically. Although the curve spikes up after each download, these are runs used the same coin cell battery throughout:
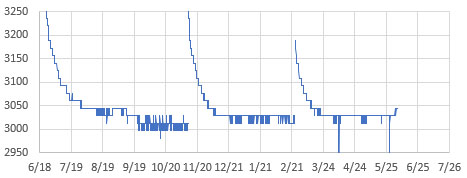
Cr2032 voltage after 11 months @30min sampling interval: BMP280 sensor reading Temp. & Pr. stored in 32k eeprom with NO 220µF rail buffering capacitor. This test run is complete. At x16 oversampling the BMP uses considerably more power than the BH1750.
Coin cell after more than 12 months @30min sampling interval: BH1750 sensor & 32k ‘red board’ EEprom (Sony brand battery: again, with no rail buffer cap). Both of these records show only the lowest battery reading in a given day.

I ran these tests without a rail buffering cap, to see the ‘worst case’ lifespan. A pulse loaded Cr2032 has an internal resistance of ~20-30Ω for about 100 mAh of its operational life, so our 3.5mA EEprom writing event should only drop the rail 100mv with no rail buffer cap. But once the cell IR approaches 40Ω we will see drops reaching 200mv for those events. The CR2032’s shown above have plateaued near their nominal 3.0v, so we will see the rail droop to ~2800mv when the batteries age past the plateau. Again, our tests show that with a 220 µF rail capacitor those drops would be reduced to less than 50mv and with 1000µF the battery droop is virtually eliminated.

Note that the UART download process briefly restores the voltage because the 3.3v UART adapter drives a small reverse current through the cell. I think this removes some of the internal passivation layer, but that voltage restoration is short lived. On future tests I will enable both logCurrentBattery (after wake) and logLowestBattery (during EEwrite) to see if the delta between them matches the drops I see with a scope.

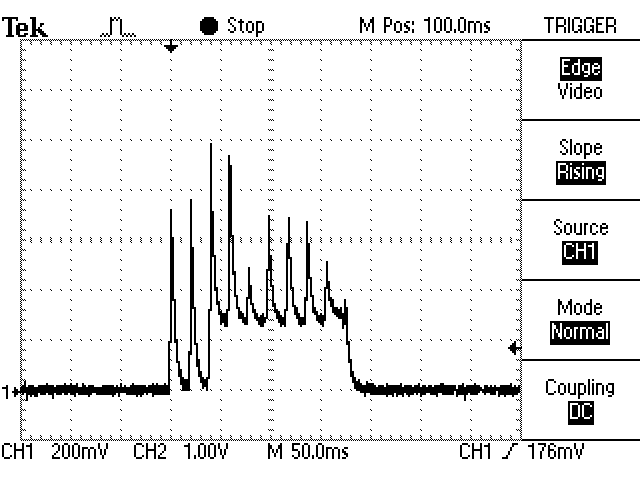
And here we compare our typical logging events to the current draw during a DS3231-SN RTC’s internal temperature conversion (with a 220µF/25v cap buffering the rail). The datasheet spec for the DS3231 temp conversion is 125-200ms at up to 600µA, but the units I tested draw half that at 3.3v. On all three of these images the horizontal division is 50 milliseconds, and vertical is 200µA via translation with a current ranger:

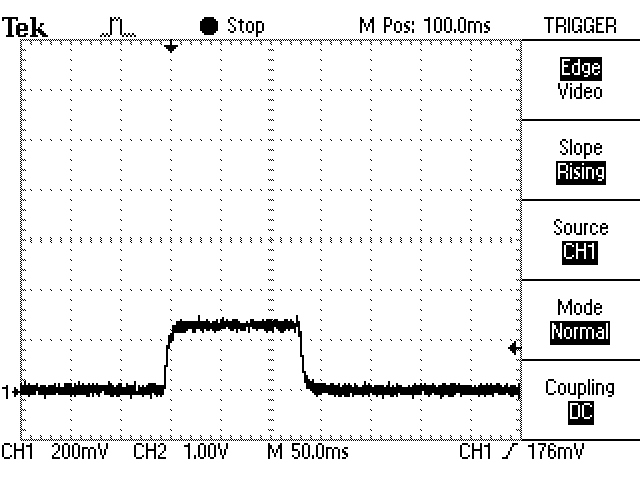
Typical sampling event peaks at 450µA with a 220µF rail buffer cap. This logger slept for 15msec battery recovery after every sensor reading or I2C exchange.
Every 64 seconds a DS3231 (-N or -SN) temperature conversion draws between 200 to 300µA for ~150ms. There is no way to change the timing of the RTC conversions.
Occasionally the RTC temp conversion starts in the middle of a logging event, adding that current the peaks.

The datasheet spec for the DS3232-SN temp conversion is 125-200ms at up to 600µA, but the units I tested draw half that at 3.3v. The rail cap can’t protect the coin cell from the SN’s long duration load so temp conversions overlapping the EEprom save may be the trigger for most low voltage shutdowns during deployment. The best we can do to avoid these collisions is to check the DS3231 Status Register (0Fh) BSY bit2 and delay the save till the register clears. But even with that check, sooner or later, a temperature conversion will start in the middle of an EEprom save event. These ‘collisions’ may be more frequent with the -M variants of the chip which do temperature conversions every 10 seconds when powered by Vbat, although they only take 10msec for the conversion instead of 150msec for the -SN. Seeing those conversions on an oscilloscope is one way to verify which kind of RTC you’ve got with so many -SN modules out there today being relabelled -M chips:
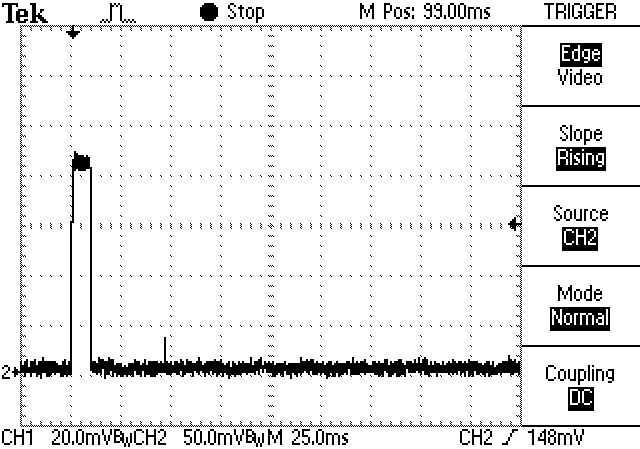
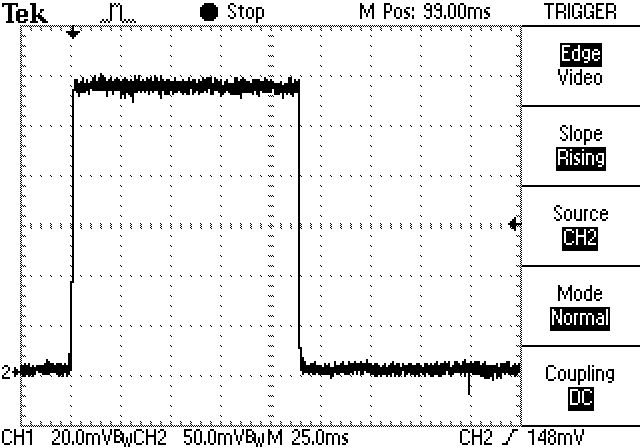
DS3231-M Temp. conversion: At 3v, this unit drew 230µA for 10milliseconds, but this occurs every 10 seconds. (1mV on scope = 1µA via Current Ranger)
DS3231-SN Temperature Conversion: At 3v, This chip drew 280µA for 130 milliseconds, every 64 seconds. (1mV=1µA via C.R.)

Given that the average timekeeping current is the same for both chips, we try to use ±2ppm SN’s for longer deployments instead of the ±5ppm M’s. In real world terms ±1ppm is equivalent to about 2.6 seconds of drift per month, and that’s what we see on most -SN RTCs. I’ve also seen occasional comments in the forums of some DS3231M oscillators stopping spontaneously during field deployment. Note that on several of the RTC modules the SQW alarms continue to be asserted even after you disable them in the control register (by setting the alarm interrupt enable A1IE and A2IE bits to zero) and this draws 6-700uA continuously through the pullup on the module. The only way to be absolutely sure the RTC alarm will not fire after a logger shut-down is to turn off the RTC’s main oscillator. We do this in the codes shutdown function, because you can just reset the time via the start menu before the next run. When you remove the coincell, DS3231 register contents are lost – usually becoming zeros when power is restored although the datasheet says they are ‘undefined’ at powerup. The RTC oscillator is initially off until the first I2C access.

If your code hangs during execution, the processor will draw 3.5mA continuously until the battery drains and the logger goes into a BOD restart loop with the D13 red led flashing quickly. The logger will stay in that BOD loop from 4-12 hours until the battery falls below 2.7v without recovering. This has happened many times in development with no damage to the logger or to any data in the EEprom.

Most of the units I’ve tested trigger their BOD just below 2.77 volts. And 10 to 20 millivolts before the BOD triggers the internal voltage ref goes a bit wonky, reporting higher voltages than actual if you are using the 1.1vref trick to read the rail. The spring contact in the RTC module can be weak. That can trigger random shutdowns from large voltage drops so I usually slide a piece of heat-shrink behind it to strengthen contact with the flat surface of the coin cell. The rail capacitor protects the unit from most impacts which might briefly disconnect the spring contact under the coin cell. However hard knocks are a such common problem during fieldwork that we use a drop of hot glue to lock the RTC coin-cell in place before deployment. Normal operation will see 40-50mv drops during EEprom saves up to with 200µF rail buffers. If those events look unusually large or rail voltage recovery starts stretching to 100’s of milliseconds on the scope you probably have poor battery contact. Even with good contact, long duration loads can deplete the rail buffering cap so a 200µF reaches the same v-drop as a ‘naked’ battery after ~8-10msec, and 1000µF after ~15-20msec. In all cases, your first suspect when you see weird behavior is that the coin cell needs to be replaced.

Another thing to watch out for is that with sleep currents in the 1-2µA range, it takes a minute to run down even the little 4.7µF cap on the ProMini boards. If you have a larger capacitor buffering the rail the logger can run for more than 10 minutes after the battery is removed.

More Cr2023 Battery Testing

16x accelerated battery tests averaged about 1250 hours run time before hitting the BOD.

Ran a series of Cr2032 battery tests with these little loggers and was pleasantly surprised to find that even with the default BOD limiting us to the upper plateau of those lithium cells; we can still expect about two years of run time from most name brand batteries with a 200-400uF rail cap. Also keep in mind that all the units in the battery test had BOD’s below 2.8v – about 1 in 50 of the ProMini’s will have a high BOD at the maximum 2.9v value in the datasheet. It’s worth doing a burn test with the crappy HuaDao batteries to spot these high cutoff units more quickly so you can exclude them from deployment. We increased the sleep current for the accelerated test by leaving the LEDs on during sleep, but with a series of different resistors on the digital pins, this logger might be the cheapest way to simulate complex duty cycles for other devices.

Addendum: 2026-02

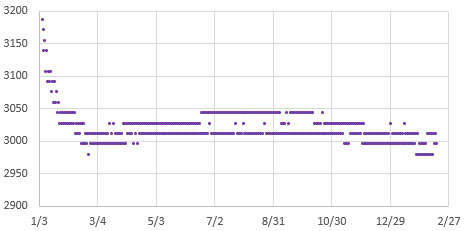
Recently retrieved a set of loggers (from a cave in the US) and the 14-month Cr2032 burn down curves from that set revealed an interesting fact about logger power consumption:
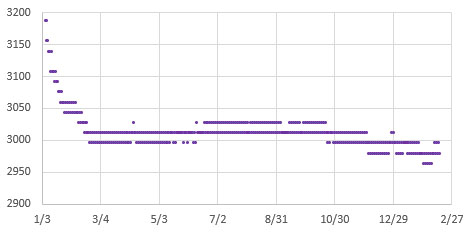
This logger was constructed with a DS3231-SN rtc & slept at 1014nA between temperature corrections.
This logger was constructed with a DS3231-M rtc which resulted in a higher 2360nA sleep current.

The points on the graphs above include both loaded and unloaded rail voltage readings. While the delta between the high & low reads is slightly larger for the -M logger with the higher baseload current, the overall run time between the two is quite similar because of the larger amount of power that the DS3231-SN uses during its 200msec temperature corrections. I would have incorrectly assumed the higher drain logger to have a significantly shorter runtime based on the constant sleep current baseline alone.


Addendum: Build video (w EEprom Upgrade)

We finally released a full build tutorial on YouTube – including how to upgrade the default 4k EEprom with two stacked 64k chips:

…and for those who already have soldering skills, we posted a RAPID 4 Minute review at 8x playback

Addendum: (2023-12-01) The e360 EDU variant

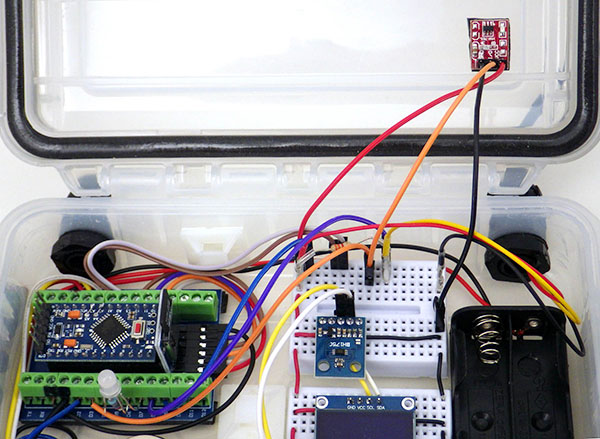
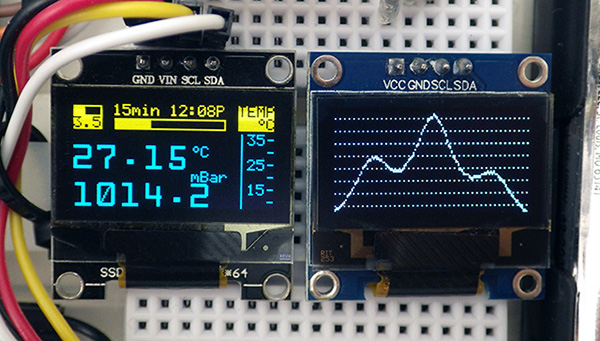
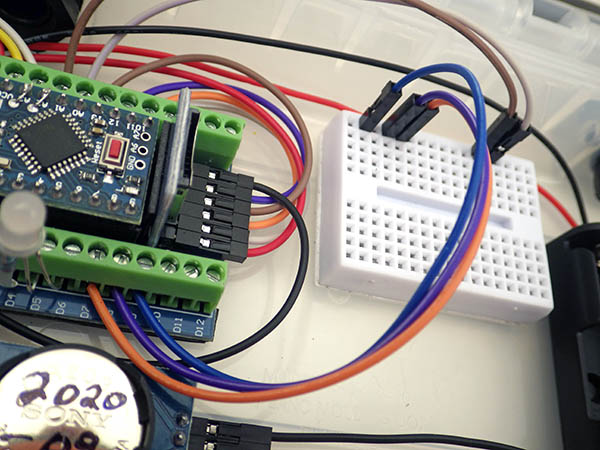
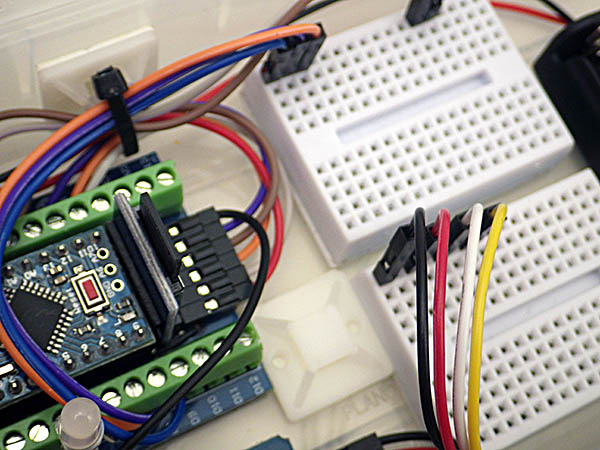
Released the classroom version of this 2-module logger, with substantial code simplifications that make it easier to add new sensors and 2Module code build has been updated to match. This new variant has two breadboards supported on 3D printed rails so that sensor connections can quickly be changed from one lab activity to the next. The default code reads temperature via the RTC, and NTC thermistor, Light via an LDR and the Bh1750, and Pressure via a Bmp280. It also has support for a PIR sensor, and a mini-OLED display screen.

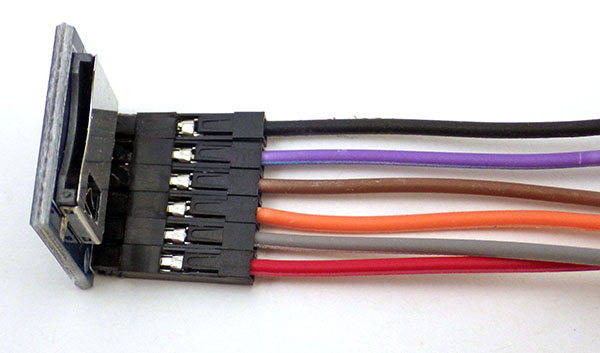
6pin Cp2102 UARTS are cheap, with good driver support, but you have to make your own crossover cable.

Macintosh users have been running into a very specific problem with this logger: their USB-c to USB-a adapter cables are smart devices with chips inside that will auto shut-down if you unplug them from the computer while they are connected to a battery powered logger. The VCC & GND header pins on the logger feed enough power/voltage back through the wires to make the chip in the dongle go into some kind of error state – after which it does not re-establish connection to the Mac properly until the adapter is completely de-powered. So you must unplug your loggers at the UART module to logger connection FIRST instead of simply pulling the whole string of still-attached devices out of the USBc port.


Last Word:

“If you need one, then you need two. And if you need two, you better have three.” The benefit of loggers this easy to produce is that you can dedicate one to each sensor, since the sensors often cost more than the rest of the unit combined. Then you can deploy duplicates to capture long time-series. This gives you redundancy in case of failure and makes it easier to spot when sensors start to drift. Deploying at least two loggers to every site also lets you use a trick from the old days when even the expensive commercial loggers didn’t have enough memory to capture an annual cycle: Set each logger to sample at twice the interval you actually want, and then stagger the readings (or set one of the logger clocks late by 1/2 of that interval). This way both loggers operate long enough to capture the entire dataset, and you can weave the readings from the two machines back together to get the higher sampling interval you originally wanted but did not have enough memory for. If one of the loggers fails you still get the complete season, but at the longer interval.
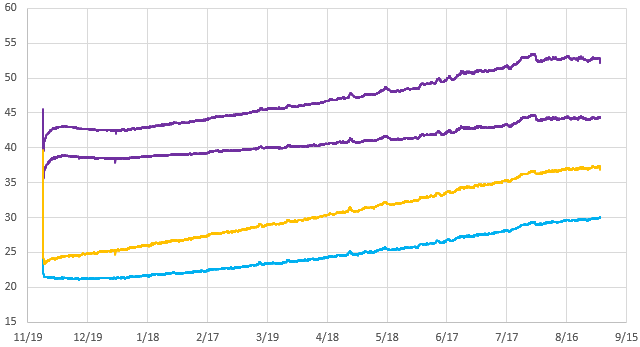
RH% gain (Y axis) over time (X axis) in submerged 30mL housings: The upper purple lines were controls with no desiccant added to the logger, the orange curve had 0.5 gram packet and the lowest blue curve had two 0.5 gram packets of small desiccant beads. So 1 to 1.5 grams are adequate for a typical one-year deployments with about 1 to 1.5% rise in RH% per month due to the vapour permeability of the centrifuge tubes. This test was done at typical room temps, but the rate increase bump near the end of the test was due to an 8°C rise – so the diffusion rate is temp dependant. BME280 sensors were used.

Dedicated loggers also provide the non-obvious benefit of reducing the potential for interference between sensors. Cross-talk is particularly common with water quality sensors because the water itself can form a circuit between them. It is nearly impossible to predict this kind of problem if all you did was benchtop calibration of the isolated sensors before your deployment. And even if your base code is robust, and you don’t have any weird ground-loops, it’s not unusual for sensor libraries to conflict with each other in a multi-sensor build.

Hopefully this new member of the Cave Pearl logger family goes some way toward explaining why we haven’t moved to a custom PCB: Using off-the-shelf modules that have global availability is critical to helping other researchers build on our work. And when you can build a logger in about 30 minutes, from the cheapest parts on eBay that still runs for a year on a coin cell – why bother? Bespoke PCBs are just another barrier to local fabrication, with potential for lengthy delays at customs to increase what may already be unpredictable shipping and import costs.

We’ve been having fun embedding these ‘ProMini-llennium Falcons’ into rain gauges and other equipment that predate the digital era. There’s a ton of old field kit like that collecting dust in the corner these days that’s still functional, but lacks any logging capability. Much of that older equipment was retired simply because the manufacturer stopped updating the software/drivers. While IOT visualization apps are all the rage in hobbyist electronics, they may end up creating similar dependencies that open source projects aiming for longevity should avoid. Not to mention the fact that those wireless packet transfers require a power budget orders of magnitude larger than the rest of the logger, while relying on back-end infrastructure that doesn’t exist in the parts of the world where more environmental monitoring is desperately needed.


References & Links:

Setting Accurate Logger time with a GPS
How to calibrate the NTC thermistors on this logger
Heliosoph: Arduino powered by a capacitor
Nick Gammon: Power Saving techniques for microprocessors
AVR4013: picoPower Basics for AVR Microcontrollers
Jack Ganssle: Hardware & Firmware Issues Using Ultra-Low Power MCUs
An Arduino-Based Platform for Monitoring Harsh Environments
Oregon Embedded Battery Life Calculator & our Cr2032 battery tests
A summary of Port/PIN mappings for Atmel based Arduinos
Waterproofing your Electronics Project
Calibrating a BH1750 Lux Sensor to Measure PAR
How to Normalize a Set of Pressure Sensors
WormFood’s AVR Baud Rate Calculator
ATmega328P Datasheet
AVR Application Notes
Timing an LED light-sensor with Pin Change Interrupts

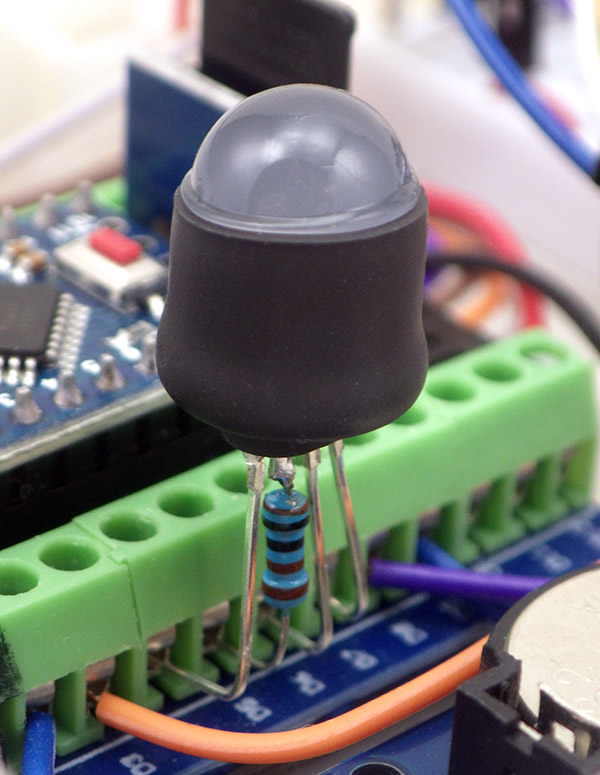
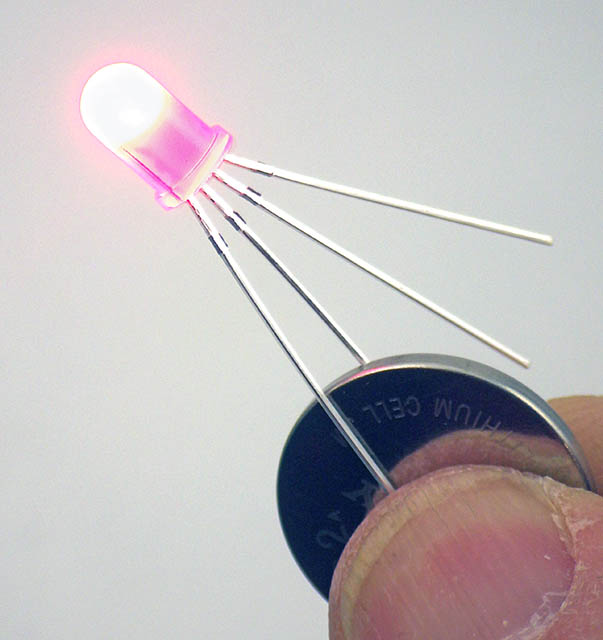
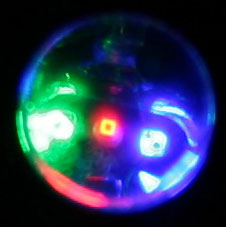
Individual sub-channels in an RGB LED are off center, and the chemistries have different overall sensitivity. So you see substantial offsets btw colors on  spatial distribution charts.   Image from: Detail of a RGB LED 2.jpg by Viferico

We’ve been using a reverse bias discharge technique to turn the indicator LEDs on our loggers into light (& temperature) sensors for several years. The starter code on GitHub demonstrates the basic method but as the efficiency of garden variety RGBs continues to improve, I’ve noticed that the new ‘super-bright’s also seem to photo-discharge more rapidly than older LEDs. Sometimes the red channel discharges so quickly that we hit the limit of that simple loop-counting method with our 8Mhz processors.

Normally when I want more precise timing, I use the Input Capture Unit (ICU) which takes a snapshot of the timer1 register the moment an event occurs. This is now our preferred way to read thermistors, but that means on most of our deployed loggers the ICU on D8 is already spoken for. And a multi-color LED offers interesting ratio-metric possibilities if you measure each channel separately. That prompted me to look into PIN CHANGE interrupts, and I’m happy to report that, with a few tweaks to suspend other interrupt sources, Pin Change & Timer1 can approach the limits of your system clock. So results are on par with the ICU, but Pin Change extends that ability to every I/O line. With slow sensors, where the counts are high, I usually put the system into sleep mode IDLE to save battery power while counting, but that adds another 6-8 clock cycles of jitter. Sleep modes like power_down are not used because the ~16,000 clock cycles that the processor waits for oscilator stabilization after deep sleeps makes accurate timing impossible.

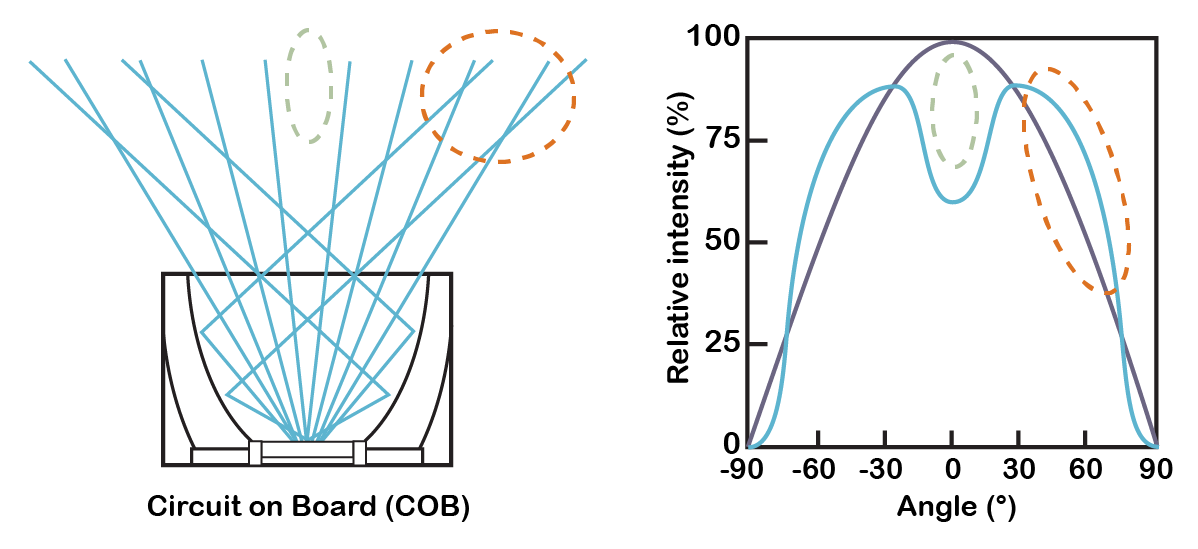
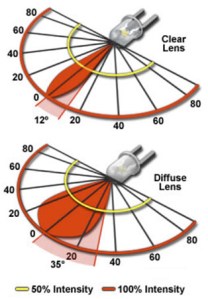
Fig 5. Light Cones emitted by Clear and Diffuse LED Lenses from Olympus document Introduction to Light Emitting Diodes There is another good LED primer from Zeiss. For more: this paper does a deep dive into LED radiation patterns.

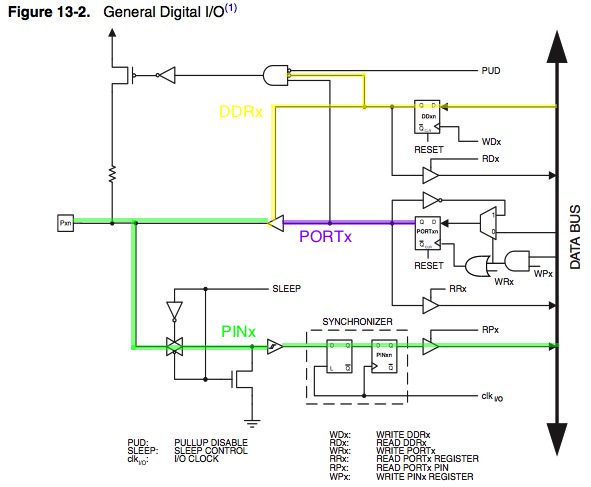
If you are new to interrupts then Nick Gammons interrupt page is definitely the place to start. (seriously, read that first, then come back & continue here…)  The thing that makes working with interrupts complicated is that microcontrollers are cobbled together from pre-existing chips, and then wires are routed inside the package to connect the various ‘functional parts’ to each other and to leads outside the black epoxy brick. Each ‘internal peripheral’ uses a memory register to control whether it is connected (1) or not (0) and several sub-systems are usually connected to the same physical wires. Each of those ‘control bits’ have names which are completely unrelated to the pin labels you see on the Arduino. So you end up with a confusing situation where a given I/O line is referenced with ‘named bits’ in the GPIO register, and other ‘named bits’ in the interrupt peripheral register, and yet more ‘named bits’ in the ADC register, etc.   Pin Maps try to make it clear what’s connected where but even with those in hand it always takes a couple of hours of noodling to get the details right.  I’m not going to delve into that or this post would scroll on forever, but there are good refs out there to Googlize.

Fast Reading of LED light sensors:

#include <avr/power.h>
#define
   RED_PIN   4             // my typical indicator LED connections
#define   GREEN_PIN   6
#define   BLUE_PIN   7
#define   LED_GROUND_PIN   5     //common cathode on D5
volatile unsigned long timer1overflowCount;


//  Reading the red channel as  a stand alone function:

uint32_t readRedPinDischarge_Timer1() {   

// discharge ALL channels by lighting them briefly before the reading
digitalWrite(LED_GROUND_PIN,LOW);  pinMode(LED_GROUND_PIN,OUTPUT);
pinMode(BLUE_PIN,INPUT_PULLUP);   pinMode(GREEN_PIN,INPUT_PULLUP);
pinMode(RED_PIN,INPUT_PULLUP);

    //execution time here also serves as the LED discharge time
    byte gndPin =(1 << LED_GROUND_PIN); 
    byte keep_ADCSRA=ADCSRA;ADCSRA=0;   byte keep_SPCR=SPCR;
    power_all_disable();   // stops All TIMERS, save power and reduce spurious interrupts
    bitSet(ACSR,ACD);      // disables the analog comparator

digitalWrite(BLUE_PIN, LOW);digitalWrite(GREEN_PIN, LOW);
digitalWrite(RED_PIN, LOW);   //end of the LED discharge stage

//reverse prolarity to charge the red channels internal capacitance:
pinMode(RED_PIN, OUTPUT); pinMode(LED_GROUND_PIN, INPUT_PULLUP);
_delay_us(24);  //alternative to delayMicroseconds() that does not need timer0

noInterrupts();
// enable pin change interrupts on the D5 ground line
bitSet(PCMSK2,PCINT21); // set Pin Change Mask Register to respond only to D5
bitSet(PCIFR,PCIF2);  // clears any outstanding Pin Change interrupts (from PortD)
bitSet(PCICR,PCIE2); // enable PinChange interrupts for portD ( D0 to D7 )

set_sleep_mode (SLEEP_MODE_IDLE);    // this mode leaves Timer1 running
timer1overflowCount = 0;                          // zero our T1 overflow counter

// reset & start timer1
TCCR1A = 0;    // Compare mode bits & wave generation bits set to zero (default)
TCCR1B = 0;    // Stop timer1 by setting Clock input Select bits to zero (default)
TCNT1 = 0;      // reset the Timer1 ‘count register’ to zero
bitSet(TIMSK1,TOIE1);   // enable Timer1 overflow Interrupt so we can count them
bitSet(TCCR1B,CS10);    // starts timer1 prescaler counting @ 8mHz (on 3v ProMini)
interrupts();

PIND = gndPin;    // faster equivalent of digitalWrite(LED_GROUND_PIN,LOW);

do{ 
sleep_cpu(); 
     }while ( PIND & gndPin );      //evaluates true as long as gndPin is HIGH

TCCR1B = 0;                           // STOPs timer1 (this redundant – but just making sure)
bitClear(TIMSK1,TOIE1);      // T1 Overflow Interrupt also disabled
sleep_disable();

bitClear (PCIFR, PCIE2);          // now disable the pin change interrupts (D0 to D7)
bitClear (PCMSK2,PCINT21); // reset the PC Mask Register so we no longer listen to D5
bitSet (PCIFR, PCIF2);              // clear any outstanding pin change interrupt flags

power_timer0_enable();        // re-enable the peripherals
power_twi_enable();
power_spi_enable();    SPCR=keep_SPCR;
power_adc_enable();   ADCSRA = keep_ADCSRA;
power_usart0_enable();

pinMode(RED_PIN,INPUT);
pinMode(LED_GROUND_PIN,OUTPUT);  // normal ‘ground’ pin function for indicator LED
return ((timer1overflowCount << 16) + TCNT1);
              //returning this as uint32_t, so max allowed is 4,294,967,295
}


// and the required ISR’s
ISR (TIMER1_OVF_vect)  {
timer1overflowCount++;
      if(timer1overflowCount>10000){         // this low light limiter must be <65534
         DDRD |= (_BV(LED_GROUND_PIN));    // sets our gnd/D5 pin to output (is already LOW)
                                                               // Bringing D5 low breaks out of the main do-while loop 
         TCCR1B = 0;  // STOPs timer1 //CS12-CS11-CS10 = 0-0-0 = clock source is removed
      }
}

ISR (PCINT2_vect)  {                                   // pin change interrupt vector (for D0 to D7)
    TCCR1B = 0;                                             // STOPs timer1
    DDRD |= (_BV(LED_GROUND_PIN));    // forces GND pin low to break out of the sleep loop
}


Key details: 

A 1k resistor was present on the LED’s common GND line for all these tests, but the limit resistor has no effect on the photo discharge time.

The code above tweaks our standard discharge method (on GitHub) with port commands & PIND when things need to happen as fast as possible, but also uses slower digitalWrite/pinMode commands in places where you want to spend more time ( in the pre-read channel discharge steps ).  The power register lowers current draw during SLEEP_MODE_IDLE, but power_all_disable(); also shuts down Timer0, so those pesky 1msec overflows don’t disturb the count. Waking from SLEEP_IDLE  adds a constant offset of about 8 clock cycles , but it reduces the jitter you’d normally see with the CPU running. One or two clock cycles of jitter is normally unavoidable with a running processor because you can’t respond to an interrupt flag in the middle of an instruction. Interrupts are also blocked when you are processing some other interrupt, so if the AVR is dealing with a timer0 overflow – the LED triggered pin change would have to wait in line.

This Timer1 method increases resolution by an order of magnitude (so you can measure higher light levels) but that lead me to the realization timing jitter is not the major source of error in this system. Before light even reaches the diode it is redirected by the LED’s reflective cavity and the encapsulating lens. Sampling time is also a factor during calibration because light levels can change instantaneously, so any temporal offsets between your reference and your LED reading will also add noise.

Does light sensing with LEDs really work?

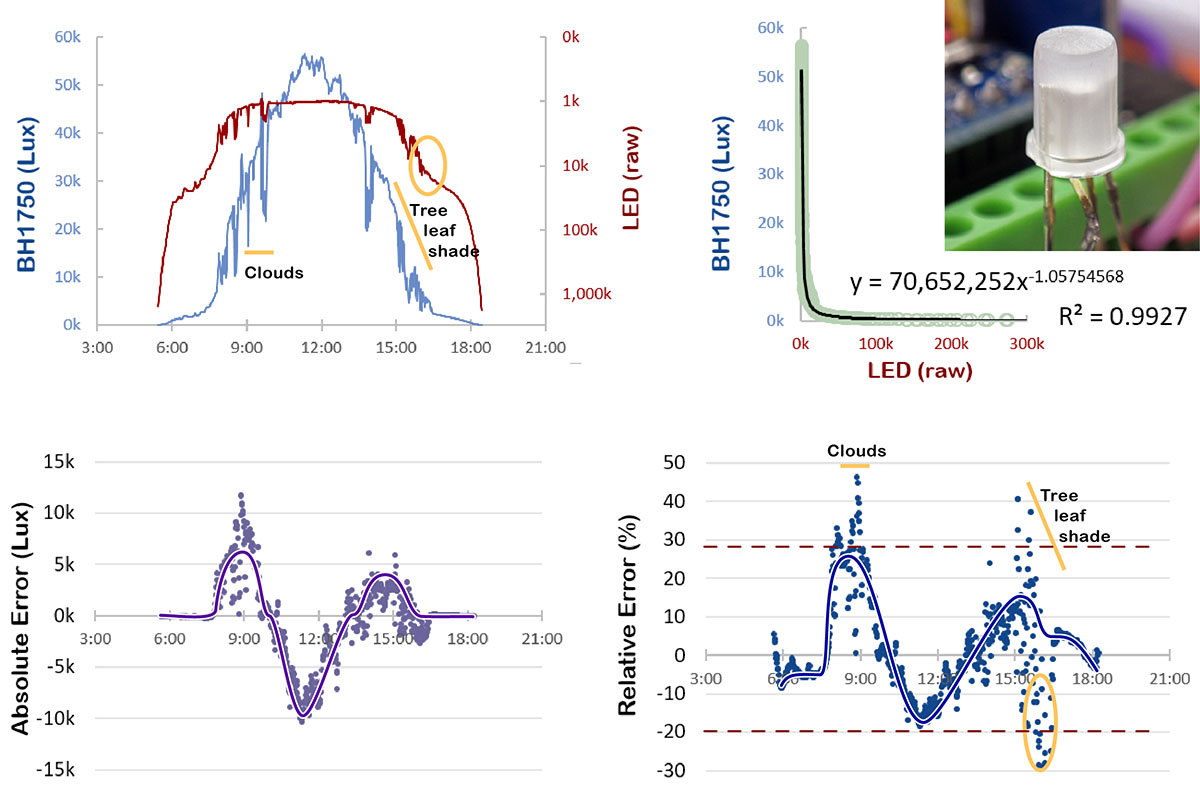
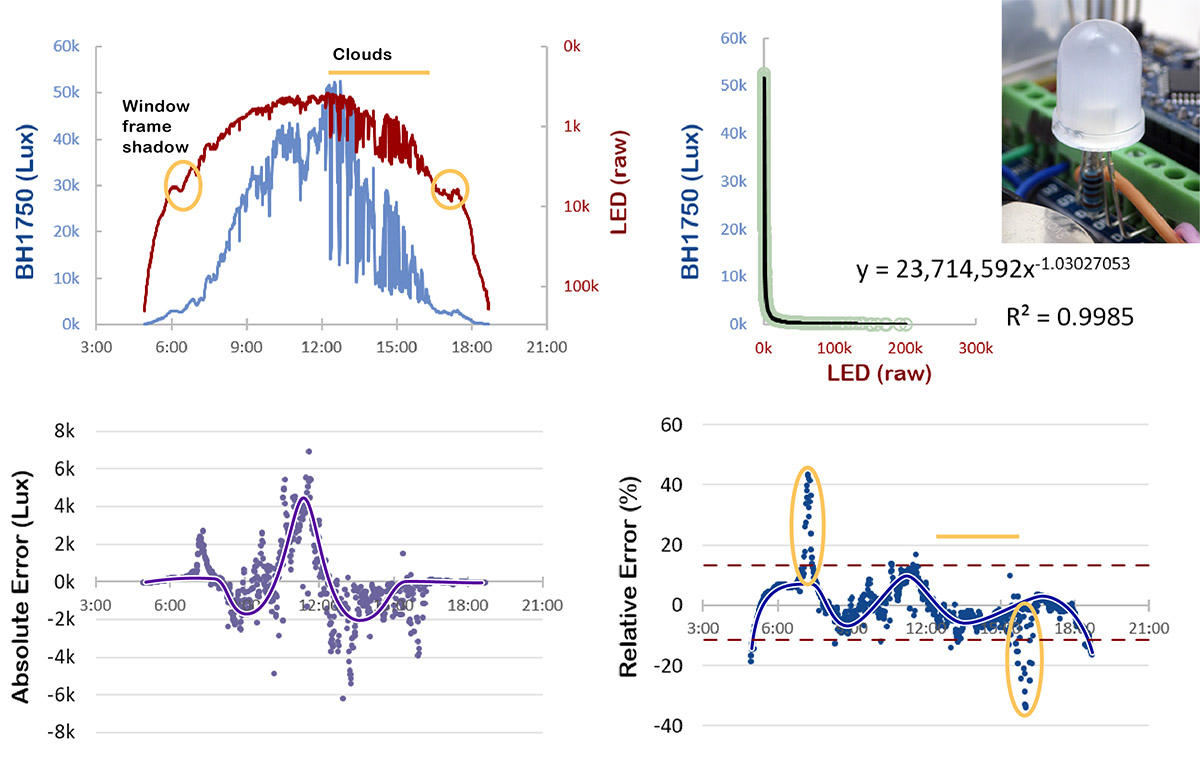
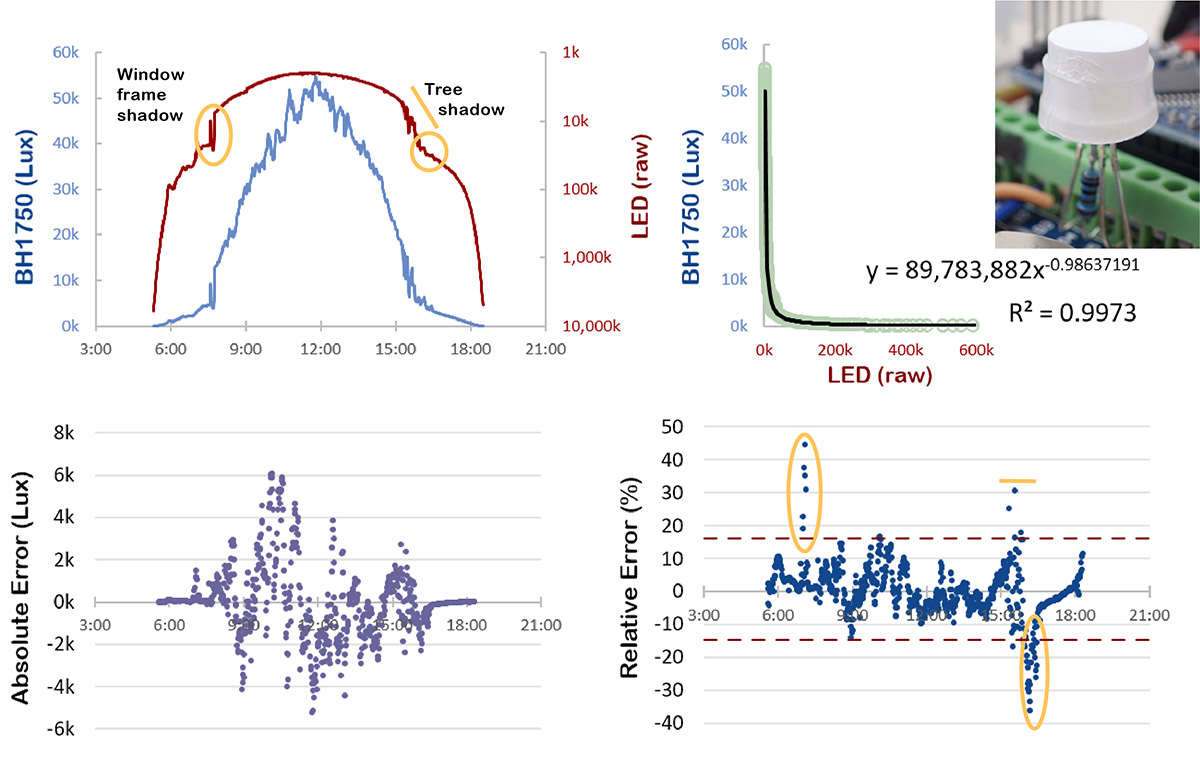
One way to demonstrate the limits of a garden variety RGB is to cross-calibrate against the kind of LUX sensors already in common use. Most LED manufacturers don’t worry much about standardizing these ‘penny parts’, so {insert here} all the standard quid pro quos about the limitations of empirically derived constants.  I covered frequency shift in the index-sensor post, and there’s an obvious mismatch between the wide spectral range of a BH1750 (Lux sensor) and the sensitivity band of our LED’s red channel:

Spectra sensitivity of BH1750BH1750 datasheet: (Pg 3)
Fig.4.24, pg49, Approximated Emission and Sensitivity Spectra (of an OSRAM LH-W5AM RGB led)  from: Using an LED as a Sensor and Visible Light Communication Device in a Smart Illumination System

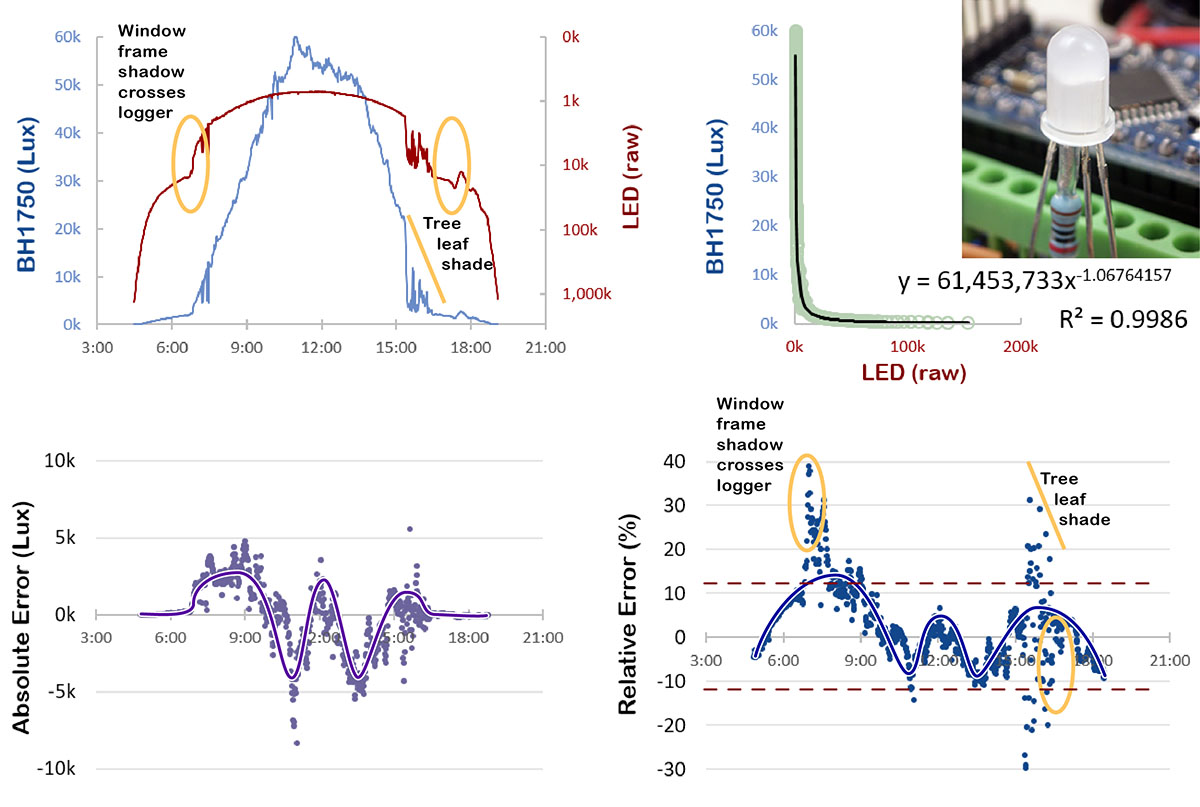
Most of us don’t have a benchtop source to play with so I’m going try this using sunlight.  The variability of natural light is challenging, and the only thing that lets me use that LED band as a proxy for LUX is that intensity from 400-700nm is relatively consistent at the earths surface.

The most difficult lighting conditions to work with are partially cloudy days with many transitions from shadow to full sun. Because the reference and LED sensors are in different physical locations within the housing shadows that cross the logger as the sun moves across the sky will darken one of the two sensors before the other if they are not aligned on the same north-to-south axis before your tests.

Skylight also undergoes a substantial redistribution of frequencies at sunrise/sunset and that may produce a separation between the response of the ‘yellow-green’ sensitive red LED channel, and the wider sensitivity range of the BH1750. 

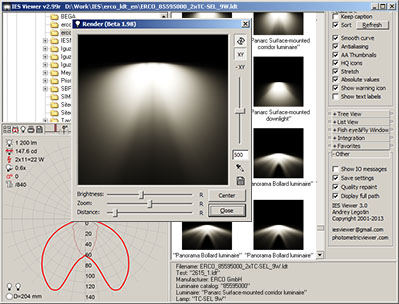
The biggest challenge for a cross calibration is that LEDs don’t match the ‘Lambertian’ response of our reference. A bare silicon cell has a near perfect cosine response (as do all diffuse planar surfaces) producing a perfectly spherical pattern on polar intensity diagrams. The BH1750 comes very close to that, but LED’s have a range of different patterns because of their optics:

Directional Characteristics of the BH1750 from the BH1750 datasheet (Fig.5 Pg 3) This plot is in the style of the right hand side of the Broadcom diagram which shows both polar and linear equivalents.
Relative luminous intensity versus angular displacement. from: Broadcom Datasheet (Fig.10) for HLMP-Pxxx Series Subminiature LED Lamps

But those challenges are good things: most tutorial videos on youTube use ‘perfect datasets’ to illustrate concepts.  Data from real-world sensors is never that clean, in fact the biggest challenge for educators is finding systems that are ‘constrained enough’ that the experiment will work, but ‘messy enough’ that students develop some data-wrangling chops. Many beginners are unaware of the danger of trusting R-squared values without understanding the physical & temporal limitations of the system: (you may want to expand this video to full screen for better viewing)

A note about the graphs shown below:
I’m lucky to get one clear day per week my location, and the search for ‘the best’ LED light sensor will continue through the summer. I will update these plots with ‘cleaner’ runs as more data becomes available.

The metal reflecting cup around the diode is an unavoidable source of error in this system:

Reflectors cause convergence leading to complex dispersion angle plots (blue) when compared to a Lambertian cosign response (purple)

The curve will also be affected by the shape and volume of the encapsulation. Some LED suppliers provide photometric files in addition to FWHM plots for their LEDs. Of course at the hobbyists level just finding datasheets is challenging so it’s usually easier to just take some photos of the LED against a dark grey card.

IESviewer features a rendering tool that can be used to show the spread & intensity of light emitted using photometric files from the manufacturer.

I could not find any information for the cheap eBay parts I’m using, so I decided to start with a 5050 LED with very little lens material over the LED:

Both sensors are suspended on the inside of the logger housing with transparent Gorilla-brand mounting tape. Orange lines highlight areas where my deployment location suffers from unavoidable interference with the calibration, The light is reduced by passing through both the HDPE of housing lid & a glass window.

The 5050 response crosses the Lambertian curve several times but the pattern still broadly follows the reflector cup diagram: the LED response shows a noon-time ‘deficit’ relative to the brighter ‘shoulders’ at midmorning & midafternoon.

The logger was suspended in a south facing skylight window during these tests. Window frame shadow crossing events produce error spikes in opposite directions at ~6:30 am & pm, while wind-driven tree leaf shadows can produce errors in both directions from about 3:00 to 6:65 pm depending on whether the BH1750 or the LED is temporarily shaded. This was the least compromised location I could find in my urban environment.

Now lets look at a clear 5mm RGB led:

After omitting the shadow-cross events (orange circles), the 5mm clear LED has large % errors due to strong focusing of the lens when the sun is directly above the emitter. This LED would make a terrible ambient light sensor, but the curves are so well defined that with a little work it could be used to determine the angle of the sun as it progresses across the sky without any moving parts.

This non-diffused pattern is predicted by Figure 10 in the Broadcom datasheet, with the tight dispersion angle of lens producing a strong central ‘hot spot’. The overall pattern is inverted relative to the 5050 (which is primarily just the metal reflector cup) although the effect of the lens is much stronger. Adding small glass particles to the epoxy will diffuse the light, reducing the ‘focusing power’ of that lens:

5mm diffused round RGB vs BH1750 lux. Outside areas with external interference the %RE is ±12%

The diffused 5mm response could be seen as an ‘intermediate mix’ of the 5050 & CLEAR led response curves. We can modify the response by sanding the top of the LED flat:

5mm diffused LED with lens sanded off. Morning was overcast on this day till about 10am, with full sun after that. This eliminated the expected 7AM ‘shadow crossing’ error, however the change in lighting conditions also upset the symmetry of the overall response in terms of the trendline fit.

Removing the lens returns to a pattern similar to the 5050 – dominated by the effect of the metal reflector. So the key to making this calibration work will be finding a combination of lens & diffuser that brings the LED response closer to the BH1750:

10mm diffused LED vs BH1750 lux. The overall shape & %error range is similar to the 5mm diffused but the slopes are reduced because the lens is less aggressive & the diffusing epoxy is thicker.
10mm diffused LED covered with 2 thin sheets of PTFE over dome. The two layers of plumbers tape are applied perpendicular to each other and held in place with clear heat shrink.

PTFE tape is such a good diffusing material that it has disrupted the smooth refraction surface of the lens – essentially returning us to the 5050 pattern we saw with the physical removal of the lens from the 5mm led.

10 mm diffused LED with top sanded flat & two crossing layers of PTFE tape to provide a ‘diffusely reflecting’ surface -> one of the requirements for Lambert’s cosine law

Finally we have a combination where the errors no longer show a clearly defined structure, with noise randomly distributed around zero. We still have ±10% cloud-noise but that is related to the time delta between the reference readings and the LED reading – so data from the LED alone will be cleaner. This two step modification will turn a garden variety LED into a reasonable ambient light sensor and the PTFE tape is thin enough that the LED is still useable as a status indicator.

Why is the LED a power law sensor?

Power laws are common in nature, arising when a relationship is controlled by surface area to volume ratios. As near as I understand it; when absorbed photons generate electron-hole pairs in the diode, only those pairs generated in the depletion region, or very close to it, have a chance to contribute to the discharge current, because there is an electric field present to separate the two charge carriers. In a reverse biased p-n junction, the thickness of this depletion region is proportional to the square root of the bias voltage. So the volume of diode material that can ‘catch photons’ is proportional to the voltage we initially placed across the diode – but this voltage falls as each captured photon reduces the capacitive charge stored at ‘surfaces’ of the diode. So the active volume gets smaller but the surface area is left relatively unchanged. I’m sure the low level details are more complicated than that, and power law patterns arise in so many different systems that it might be something entirely different (?)

Enhance your Logger with an OLED & TTP223 Capacitive Touch Switch

A capacitive touch switch works through the lid of the housing. This lets you do things like check the battery status without disturbing your experiment on long runs.

I highlighted these cheap OLED screens as a useful addition in the 2020 build tutorial, but given that a typical deployment leaves the logger for long periods of time where nobody will see it, some have been asking if it’s worth sand-bagging the unit with a 20mA drain on every reading cycle. (ie: larger than the rest of the logger combined) So the today I want to explore another addition to the EDU build that makes screens viable without hurting the power budget. In sleep mode these screens only draw about ~20 μA. (even if you leave it’s redundant regulator in place) So the key is only triggering the pixels when there’s someone around to actually see it.

For text output l like the SSD1306Ascii library which is available through the library manager.  Grieman’s libraries are some of the best on offer whenever you need low power operation and a small memory footprint. With that installed you can drive the SSD1306 with a basic set of commands:

//  Compiler instructions at the start of your program: 
#include <SSD1306Ascii.h>                   // includes the main library itself
#include <SSD1306AsciiWire.h>          // use I2C peripheral inside the Arduino (optional)
SSD1306AsciiWire oled;                         // create a library object calledoled
#define   oled_I2C_Address   0x3C        // 0x3C or 0x3D depending on manufacturer

//  basic screen initialization in Setup{}  -this MUST be after wire.begin starts the I2C bus
oled.begin(&Adafruit128x64, oled_I2C_Address);
oled.setFont(System5x7);     // fonts specified in setup are included with the compile

// sending information the screen at end of the main Loop after the SD save
// you can also package these up into a stand-alone function (see below)

oled.clear();                          // erases anything displayed on the screen
oled.setCursor(0,2);           // ( 0-127 pixel columns , 0-7 text rows)
oled.set1X();                        // set single-row font height for labels
oled.print(F(“B280 T”));      // standard .print syntax supported
oled.setCursor(46,2);         // move cursor to column 46, but remain in same row
oled.set2X();                         // set double-row font height for readability
oled.print(bmp280_temp,2);    // a float variable, limited to two decimal places
oled.set1X();
oled.print(F(“o”));                    // a lower case ‘o’ for the degree symbol
oled.set2X();
oled.print(F(“C”));
 // … etc ... add more here until the display is ‘full’

// display pixels can be enabled at ANY time later . . .
oled.ssd1306WriteCmd(SSD1306_DISPLAYON);   // turn on the screen pixels
    delay(10000); // enough time to read the information 
oled.ssd1306WriteCmd(SSD1306_DISPLAYOFF);   // turn OFF the screen pixels

I’m only including the print statements for one line of the the display shown here ->  (click to enlarge)  but hopefully you see the pattern well enough to lather-rinse-repeat. The pixels do not need to be ‘turned on’ while you load the screen memory, and that data is persistent as long as the screen has power.  So if you wanted to tackle more advanced graphic output, you could build plots ‘one line at a time’ in the eeprom without needing a 127 field array to buffer that data.

The TTP223 Touch Switch:

Here I disabled the LED by removing the limit resistor, set the mode to momentary low, and trimmed the header pins so the upper surface is flat. The unmarked solder pads on the upper right are were you would add trimming caps to reduce sensitivity. These switches self calibrate for 0.5 sec at startup, so they need a bit of ‘settling time’ at power-on.

These small capacitive switches can be had for less than ~20¢ each on eBay. The power LED wastes about 8mA, so that needs to be disabled for logger applications. Then you set the operating modes by bridging the A / B solder pads. These switches are so sensitive that moving a finger within 2cm of the surface will trigger them. In applications where the sensor is exposed you probably need to add a 10-20 pF ‘trimming cap’ to prevent self triggering. Noise on your rail can also set them off, and you don’t want loose wires inside the housing near that sensing pad. TTP223 chips do not go rail to rail, but they still work ok driving MOSFETS.

A small square of double sided tape holds the T233 inside the student build just above the batteries. (The outer most rows of the breadboards are power rails)

In our case the sensor will be under 1.5mm of HDPE and another millimeter of double sided foam tape. So the default sensitivity level is  almost perfect for sensing through the lid of the  housing. With the LED disabled the TTP223 module pulls about 5μA when NOT being triggered, and 100μA when actively signaling the logger. Here I’ve connected the switch using 10cm pre-made jumpers but you want to be careful that you don’t put the switch in a position on the lid where it might cast a shadow over any light sensors as the sun moves through the sky. With our most recent student logger, you also need to shift the indicator led over to R4-GND5-Gr6-Bl7 so that the switch output (orange wire) can be fed into the hardware interrupt on D3. This chip produces ‘clean’ transitions so you don’t need to worry about de-bouncing. These switches seem to work fine without pullup, but I’ve been enabling the internal pull on D3 anyway.

Sensors such as rain gauges generate on/off interrupt signals at any time due to environmental conditions. But no matter how many times that happens, only the RTC’s sampling interval alarm should control the ‘regular’ read cycles in the main loop. To handle multiple interrupt sources we ‘trap’ the processor in a Do-While loop that checks flag variables (set in the associated ISR functions) to see where the wake-up signal originated.

In the code below; if the RTC flag variable is false when the processor reaches the while(flag status check) at the end of the loop, then the program gets sent back to the initial do{  statement. This code assumes you have already programmed the screens memory with data to display:

//  when you are about to put the logger to sleep  (after setting the RTC alarm)

pinMode( 0, INPUT_PULLUP );        // I always use pin D2 for the RTC alarm signal
rtc_d2_INT0_Flag = false;                 // D2 interrupt flag – this can only be set true in the ISR

pinMode ( 1 , INPUT_PULLUP );            // Cap. switch output is connected to D3
d3_INT1_Flag =
false;      // setting false here prevents any display until TTP223 is pressed

EIFR=EIFR;           // clears old ‘EMI noise triggers’ on BOTH hardware interrupt lines

do {                       // The ‘nesting order’ here is critical:

attachInterrupt (1,switchPressed_ISR, FALLING);
            attachInterrupt(0, rtc_d2_ISR_function, LOW);
                         LowPower.powerDown(SLEEP_FOREVER, ADC_OFF, BOD_ON);
            detachInterrupt(0);                    // MUST detach the high priority D2 first
detachInterrupt (1);                               // then detach the lower priority D3 interrupt

// Here we are simply powering the OLED display pixels but any other code put here
// is isolated from the main sequence, so you could trigger ‘special’ sensor readings, etc. 

  if (d3_INT1_Flag == true){
        oled.ssd1306WriteCmd(SSD1306_DISPLAYON);   // turn on the screen pixels
             attachInterrupt(0, rtc_d2_ISR_function, LOW);
               LowPower.powerDown(SLEEP_8S, ADC_OFF, BOD_ON);  // long enough to read
             detachInterrupt(0);
        oled.ssd1306WriteCmd(SSD1306_DISPLAYOFF);   // turn OFF the screen pixels
        d3_INT1_Flag = false;   // reset D3 interrupt flag
        }

} while (rtc_d2_INT0_Flag == false);    // if RTC flag has not changed repeat the ‘trap’ loop 

if (rtc.checkIfAlarm(1)) { rtc.turnOffAlarm(1); }   // processor awake so disable the RTC alarm
EIFR=EIFR;    // clears leftover trigger-flags from BOTH D2 & D3

// now return to the start of the main loop & capture the next round of sensor readings


// and each attached interrupt requires an ISR function   (outside the main loop!)
switchPressed_ISR() {
if (d3_INT1_Flag==false)
{ d3_INT1_Flag = true; }     // Flag variables set in an ISR must be global & ‘volatile’
}

rtc_d2_ISR_function() {
if (rtc_d2_INT0_Flag==false)
{ rtc_d2_INT0_Flag= true; }
}

BOTH the TTP on D3 and the RTC alarm on D2 can wake the logger from sleep – but switchPressed_ISR() does not change the critical flag variable so a wakeup caused by the D3 will not break out of the Do-While loop. Only the rtc_d2_ISR_function() can set the tested flag to true and thus escape from the trap.  This general method that works equally well with inputs from reed switch sensors for wind, rain, etc. With a few tweaks the same basic idea can also be used to capture ‘opportunistic’ sensor readings  – provided you save those to a different logfile, or tag the ‘extra’ records with something that’s easily sorted from the regular records later in Excel.

Note that the two interrupt sources use different triggers: FALLING for the TTP223, and LOW for the RTC. It doesn’t really affect anything if the switch transition is missed (you can just tap it again), but the whole logger operation is affected if the RTC alarm fails. The RTC must also be able to interrupt the ‘display time’. Fortunately the RTC’s alarm output is ‘latched’ so it will cascade the wake-ups until we exit the do-while loop. The most important thing to know when using HIGH or LOW as your interrupt state is that you MUST detach the interrupt IMMEDIATELY upon waking. If you forget to detach a HIGH or LOW triggered ISR it will just keep on firing until it fills all of the variable memory with stack pointers and crashes your logger.

In addition to preventing the display from using power when nobody is around, having the ability to trigger the display ‘at any time’ is a great way to make sure the logger is OK without opening it – especially if all you want to see is the most recent timestamp & battery level.  This is also helpful when students are running labs that can’t be ‘physically disturbed’ ( for example, soil sensors tend to produce significant discontinuities if they get bumped in the middle of a run)  Nothing is worse than letting an experiment run for a week, only to find that the system froze up a few hours after it was started.

Handling multiple screens of information

Once you’ve got the basic screen operation working you might want to check our page on using two displays. Keeping each display in different ‘memory access modes’ lets you do some interesting graphical output tricks.  But what if you only have one screen and there just isn’t enough room to display everything at one time?

You can use flag variables &  switch-case to toggle between different screens of information:

//  I use defines in setup{} so the code is more readable, but these are just numbers
#define displaySOILdataNext 0

#define displayTEMPdataNext 1

//  set the ‘first screen’ you want to display before entering the do-while trapping loop
uint8_t next_OLED_info = displaySOILdataNext;

do {       // our processor ‘trapping loop’ described above

// load the screen’s eeprom at the start of the do-while loop
// each successive press of the touch-switch changes which data gets loaded

switch (next_OLED_info{

case
displaySOILdataNext:      // case where next_OLED_info = 0
{
         sendSOILdata2OLED();    // a separate function to program the display memory
         next_OLED_info=displayTEMPdataNext;  //toggles to send different info on next pass
break;
}

case displayTEMPdataNext:    // case where next_OLED_info = 1
{
         sendTEMPdata2OLED();   // a separate function to load the eeprom
         next_OLED_info=displaySOILdataNext;  //toggle to opposite screen on next pass
break;
}
}  // terminator for switch (next_OLED_info)

      {insert here} all the loop content controlling wake/sleep described earlier

} while (rtc_d2_INT0_Flag == false);    // end of our processor ‘trapping loop’


// and you will need stand-alone functions for each screen of information:

void sendTEMPdata2OLED() {
oled.clear();
oled.set2X();
oled.setCursor(0,0);
oled.print(TimeStamp+5);   // +5 skips first 5 characters of the string because it’s too long

oled.set1X();
oled.setCursor(0,2);
oled.print(F(“Temp1: “));
oled.set2X();
oled.setCursor(46,2);
oled.print(ds18b20_short_degC,2);
               // … etc ... add more here until the display is ‘full’
}

void sendSOILdata2OLED() {
oled.clear();
oled.set1X();
oled.setCursor(0,0);
oled.print(F(“RAIL”));
oled.set2X();
oled.setCursor(70,0);
oled.print((float)ads1115_rail*0.000125,3);
                // … etc ... add more here until the display is ‘full’ 
}

The nice thing about this method is that you can toggle your way through as many different screens of information as you need simply by adding more ‘cases’ and screen ‘loading’ functions.

Adding two OLED displays to your Arduino logger (without a library)

Two I2C 0.96″ OLED screens used simultaneously. Left is split Yellow: 128×16 pixels & Blue: 128×48 pixels while the right screen is mono-white. The CODE ON GITHUB drives each screen in different memory modes to simplify the functions and uses internal eeprom memory to store fonts/bitmaps.

Oceanographic instruments rarely have displays, because they don’t contribute much to profilers being lowered off the side of a boat on long cables. And most of our instruments spend months-to-years in underground darkness, far from any observer.  But a few years ago we built a hand-held flow sensor that needed to provide operator feedback while the diver hunted for the peak discharge point of an underwater spring. That prototype was our first compelling use-case for a display screen, and we used cheap Nokia 5110 LCDs because they were large enough to see in murky water.  While driver libraries were plentiful, I realized that Julian Ilett’s shift-out method could pull font maps from the Arduino’s internal eeprom rather than progmem. This let us add those SPI screens to a codebase that was already near the memory limits of a 328p.

Modifications done to the second display: The only thing you must do for dual screens is change the bus address. Here I’ve also removed the redundant I2C  pullups (R6&R7, 4k7) and bridged out the 662k regulator which isn’t needed on a 3.3v system. These changes usually bring sleep-mode current on 0.96″ OLEDs to about 2μA per screen. (or ~5μA ea. with the 662k regulator left in place)

Now it’s time to work on the next gen, and the 0.96″ OLEDs that we initially ignored have dropped to ~$2.50 each.  Popular graphic libraries for these displays (Adafruit, U8G2, etc)  provide more options than a swiss army knife but require similarly prodigious system resources. Hackaday highlighted the work of David Johnson-Davies who’s been using these screens with ATtiny processors where such extravagant memory allocations aren’t possible. His Tiny Function Plotter leverages the ssd1306‘s vertical access mode to plot a graph with a remarkably simple function.  These OLED screens support two bus addresses, and that set me to work combining that elegant  grapher with my eeprom/fonts method for a two screen combo. Updating Iletts shiftout cascade to I2C would loose some of the memory benefit, but I was already embedding wire.h in the codebuild for other sensors. It’s worth noting that David also posted a full featured plotter for the 1106, but these tiny displays are already at the limits of legibility and I didn’t want to lose any of those precious pixels. Moving the axis labels to the other screen forced me to add some leading lines so the eye could ‘jump the gap’:

My eyes had trouble with single-pixel plots so I made the line 2-pixels thick.

Histogram seems the best underwater visibility mode. Dashed lead-lines toggle off

A little repetition produces a bar graph variant.

The battery indicator at upper left uses the same function as the buffer memory progress bar in the center. Axis label dashes along the right hand side correspond to the lead lines on the next screen. My goal with this layout was ‘at-a-glance” readability. Horizontal addressing makes it easy to update these elements without refreshing the rest of the screen; so there is no frame buffer.

To drive these screens without a library it helps  to understand the controllers different memory addressing modes. There are plenty of good tutorials out there, but the gist is that you first specify a target area on screen by sending (8-pixel high) row and (single pixel wide) column ranges.  These define upper left  & lower right corners of a modifiable region and the ssd1306 plugs any subsequent data that gets sent into the pixels between those corner points using a horizontal or vertical flow pattern. If you send more data than the square can hold, it jumps back to the upper left starting point and continues to fill over top the previous data. In ALL memory modes: each received byte represents a vertical 8-pixel stripe of pixels , which is perfect for displaying small fonts defined in 6×8-bit blocks. For the taller characters I use a two-pass process that prints the top of the large numbers first, changes eeprom memory offset, and then does a second pass in the next row to create the bottoms of the characters. This is different from typical scaling approaches, but gives the option of creating a three-row (24 pixel high) font with basically the same method, and since the fonts are stored in eeprom there’s no real penalty for those extra bits.

In addition to text & graphs, I need a battery status indicator and some way to tell the operator when they have waited long enough to fill sampling buffers. In the first gen units I used LED pips, but similar to the way vertical addressing made the Tiny Function Plotter so clean, horizontal mode makes it very easy to generate single-row progress bars:

void ssd1306_HorizontalProgressBar
(int8_t rowint percentCompleteint barColumnMin,  int barColumnMax)    {

// Set boundary area for the progress bar
Wire.beginTransmission(ssd1306_address);
Wire.write(ssd1306_commandStream);
Wire.write(ssd1306_SET_ADDRESSING);
Wire.write(ssd1306_ADDRESSING_HORIZONTAL);
Wire.write(ssd1306_SET_PAGE_RANGE);
Wire.write(row); Wire.write(row);    // page  start / end  are the same in this case 
Wire.write(ssd1306_SET_COLUMN_RANGE);
Wire.write(barColumnMin); Wire.write(barColumnMax); // column start / end
Wire.endTransmission();

//determine column for the progress bar transition
int changePoint = ((percentComplete*(barColumnMax-barColumnMin))/100)
+barColumnMin;

//loop through the column range, sending a ‘full’ or ’empty’ byte pattern
for (int col = barColumnMin ; col < barColumnMax+1; col++) {
   Wire.beginTransmission(ssd1306_address);
   Wire.write(ssd1306_oneData);   // send 1 data byte at a time to avoid wire.h limits

        // full indicator = all but top pixel on,  also using the ‘filled’ byte as end caps
        if
(col<changePoint || col<=barColumnMin || col>=barColumnMax)
        { Wire.write(0b11111110);  }
        else   Wire.write(0b10000010);   }    // empty indicator  = edge pixels only

    Wire.endTransmission();
  }
}

I mount screens under epoxy & acrylic for field  units but hot glue holds alignment just fine at the prototyping stage, and it can be undone later.

And just for the fun of it, I added a splash screen bitmap that’s only displayed at startup. Since the processors internal eeprom is already being used to store the font definitions, this 1024 byte graphic gets shuttled from progmem into the 4k EEprom on the RTC modules we use on our loggers. It’s important to note that I’ve wrapped the font & bitmap arrays, and the eeprom transfer steps, within a define at the start of the program:

#define runONCE_addData2EEproms
—progmem functions that only need to execute once —
#endif

Since data stored in eeprom is persistent, you can eliminate those functions (and the memory they require) from the compile by commenting-out that define after it’s been run. One thing to note is that the older AT24c32 eeprom on our RTC module is only rated to 100kHz, while bus coms to the OLED work well at 400kHz.

You can update the memory in these screens even if the display is sleeping. So a typical logger could send single line updates to the graph display over the course of a day. There’s a scrolling feature buried in the 1306 that would make this perpetual without any buffer variables on the main system.  Color might make it possible to do this with three separate sensor streams, and the 1106 lets you read back from the screens memory, providing an interesting possibility for ancillary storage. However with Arduino migrating to newer mcu’s I think creative code tricks like that are more likely to emerge from ATtiny users in future. As a logger jockey, the first questions that comes to mind are: can I use these screens as the light source in some interesting sensor arrangement that leverages the way I could vary the output?
What’s the spectra of the output?  Could they be calibrated?   What’s the maximum switch rate?

Screens are quite readable through the clear 3440 Plano Stowaway boxes used for our classroom logger. (here I’ve hot glued them into place on the lid) Avoid taking new sensor readings while information is being displayed on the OLED screens because they ‘pulse’ power to the pixels (100ms default) when information is being displayed. Each screen shown here peaks at about 20 mA (this varies with the number of pixels lit) so you could be hitting the rail with a high frequency load of about 40mA with dual screens – which could cause noise in your readings unless you buffer with some beefy caps. Also note that the screens tiny solder connections are somewhat fragile, so avoid putting hot glue on the ribbon cable.

As a final comment, the code on github is just an exploration of concepts so it’s written with readability in mind rather than efficiency.  It’s just a repository of functions that will be patched into other projects when needed, and as such it will change/grow over time as I explore other dual screen ideasKris Kasprzak has a slick looking oscilloscope example (+more here) , and Larry Banks BitBang library lets you drive as many I2C screens as you have the pins for – or you could try a multiplexer on the I2C bus. The TCA9548 I2C multiplexer lets you drive up to 8 OLED displays or connect several of those cheap Bme280 sensors to your build.

These OLEDs will only get larger and cheaper over time. (& it will be a while before we see that with e-paper) An important question for our project is: which screens hold up best when subjected to pressure at depth? This was a real problem with the Nokia LCDs.

Addendum 2021-04-05:

I finally took a closer look at the noise from those cheap SSD1306 OLED screens, and was surprised to find the usual [104] & [106] decoupling combo simply weren’t up to the task. So I had to go to a 1000uF Tantalum [108] to really make a dent in it. Contrast settings reduced the current spikes somewhat, but did not change the overall picture very much.

The following are before & after graph of a start sequence from one loggers that end with 8 seconds of the logger sleeping while the latest readings get displayed on screen:

Logger current with a SSD1306 0.96″ OLED display: before & after the addition of a 1000uF Tantalum [108]

This unit was running without a regulator on 2x Lithium AA’s , and I had noticed intermittently flakey coms when the screen pixels were on. A forum search reveal people complaining about ‘audible’ noise problems in music applications, and others finding that their screens charge pump was driving the pixels near the default I2C bus frequency of 100kHz. I’ve dozens of these things lying around, and will add more to this post if testing reveals anything else interesting. The cap. pulls about 1A at startup so I’m not even sure I could put one that large on a regulated ProMini without pushing the MIC5205 into over-current shutdown.

Addendum 2023-12-01: Mini OLED display only draws about half a milliamp!

Our 2-Module classroom data logger uses a 50mL falcon tube housing and is powered from a Cr2032. So we had to go hunting for much smaller displays. Mini 0.49″ OLEDs are an excellent low power option that sleeps below 10 µA and will run about two weeks on a coin cell at 15 minute intervals, depending on contrast, pixel coverage, and display time. A 220µF tantalum right next to them on the breadboard protects the rail from the OLEDs charge pump noise.

These micro OLEDs are driven by a 1306 so you can use standard libraries like SSD1306Ascii. HOWEVER they only display a weirdly located sub-sample of that controllers 1k memory – so you have to offset the origin on your print statements accordingly.

Hacking a Capacitive Soil Moisture Sensor (v1.2) for Frequency Output

A $1.50 soil moisture sensor: ready to deploy. My first experiments with the pulsed output hack didn’t quite work due to probe polarization at low frequencies…but I’m still noodling with it.

There’s something of a cultural divide between the OpAmp/555 crowd and Arduino users. I think that goes some way to explaining the number of crummy sensor modules in the hobbyist market: engineers probably assume that anyone playing in the Arduino sandbox can’t handle anything beyond analogRead().  So it’s not unusual to find cheap IC sensor modules with cool features simply grounded out, because how many ‘duino users could config those registers anyway – right?

Legit suppliers like Adafruit do a much better job in that regard, but our project rarely uses their sensors because they are often festooned with regulators, level shifters, and other ‘user-friendly’ elements that push the sleep current out of our power budget. Sparkfun boards usually have leaner trim, but with all the cheap PCB services available now I’m tempted to just roll my own. Thing is, I keep running into the problem that in ‘prototype quantities’ the individual sub-components often cost more than complete modules with the reflow already done – and that’s before everything gets sand-bagged with shipping charges larger than the rest of the project combined.

So we still use a lot of eBay modules – after removing the usual load of redundant pullups and those ubiquitous 662k regulators.  Once you go down that rabbit hole you discover a surprising number of those cheap boards can be improved with ‘other’ alterations. The reward can be substantial, with our low power RTC mod bringing $1 DS3231 modules from ~0.1 mA down to less than 3µA sleep current – which is quite useful if you want to power the entire logger from a coin cell.

Another easily modified board is the soil moisture probe I flagged in the electrical conductivity post:

Schematic before conversion:  (regulator not shown). The output frequency is controlled by the time constant when  charging/discharging C3 through R2/R3. Gadget Reboot gives a good overview of how the basic configuration works, feeding the RC filtered 555 output into a simple peak detector. Older NE555 based probes run at 370khz but the V1.2 probes with the TLC555 run at a higher 1.5Mhz frequency with a 34% duty cycle. It’s worth noting that dissolved salts, etc affect soil moisture readings until you reach the 20-30MHz range.

These sensors use coplanar traces to filter high frequency output from a 555 oscillator, but you’re lucky to see a range of more than 400 raw counts reading that filtered output with Arduino’s 10-bit ADC.  On 3.3v systems, you can remove the regulator and combine the sensor with an ADS1115 for 15-bit resolution. I found you can’t push that combination past the ±4.096V gain setting or the 1115’s low input impedance starts draining the output capacitor. But that still gives you a working range of several thousand counts as long as you remember that the ADS1115 uses an internal vRef – so you also need to monitor the voltage supplied to the sensor to correct for battery variation.  Trying to read the sensors output with my EX330 when the sensor was running brought the output voltage down by about 0.33v and it’s got 10MΩ internal impedance similar to the ADS so a cheaper voltmeter will knock the output from this sensor around even more. Differential readings can reduce this problem because that doubles the ADC’s impedance.

Analog mode works well with long cable runs and piping that through an ADS1115 lets you communicate with three soil sensors over I2C if you are low on ports.  And up to four of those $1 ADC could be hung off the same bus – though I’ve learned the hard way not to put too many sensors on one logger because it risks more data loss if you have a point failure due to battery leaks, critters, or vandalism. It only takes a couple of hours to build another logger for each set anyway.

3.3v ProMini ADC readings from an analog soil moisture sensor at ~8cm depth (vertical insertion) with  DS18b20 temp from the same depth. We ran several of these sensors in our back yard this summer. This segment shows daily drawdown by vegetation during the hottest/driest month of the year – followed by several rainfall events starting on 9/4 . This logger was running unregulated from 2x lithium AA cells and the regulator was also removed from the soil sensor. Aref moves in step with the supply voltage so we didn’t have interference from battery variation. C5&6 were removed from the board and the sensor was powered from a digital pin with 8 seconds to stabilize ( probably more time than needed). This humble sensor was less affected by daily temperature cycles than I was expecting but if you use ‘field capacity’ as your starting point the delta was only ~200 raw ADC counts. I manually watered the garden on 8/23 & 8/24 to keep the flowers from dying; but it was only a brief sprinkle. We have 6 months of continuous operation on these probes so far but with only that thin ink-mask protecting the copper traces I’d be surprised if they go more than a year. Even with epoxy encapsulating the 555 circuit, small rocks could easily scratch the probe surface on insertion leading to accelerated corrosion.

These things are cheap enough that I’ve started noodling around with them for other tasks like measuring water level.  With a water/air dielectric difference of about 80:1 even unmodified soil probes do that job well if you put in a little calibration time. When powered at 3.3v, the default config outputs a range of ~3.0v dry to 1.5v fully submerged in water. So Arduino’s 10-bit ADC gives you decent resolution over the probes 10cm length. And since the TL555 doesn’t draw more than 5mA (after settling), you can supply it from a digital I/O pin to save power – provided you give the sensor a couple of seconds to charge the output capacitor after power on. Adding 120-150Ω in series to throttle capacitor inrush still leaves you with ~1.2v air/water delta. The sensors I tested stabilize at power on after ~1 second but take more than 35 seconds to ‘discharge’ down if you suddenly move the probe from air to water – this behavior indicates the boards are missing the R4 ground connection. (Note: After checking batches from MANY different suppliers I’ve now started adding a 1Meg ohm resistor across the output of any sensors that output ~95% of their supply voltage in ‘free air’. Sensors with the 1meg already connected the way it’s supposed to be on the board usually output ~85% of their supply voltage with the sensor in air & about 35% of their supply when completely submerged in water.)

A quick search reveals plenty of approaches to making the sensor ready for the real world, but we’ve had success hardening different types of sensor modules with a epoxy + heat-shrink method that lets you inspect the circuits over time:

Cable & Epoxy Mounting:                               (click images to enlarge)

Clean the sensor with 90% isopropyl alcohol. An old USB or phone cable works for light – duty sensor applications. Here I’ve combined two of the four wires to carry the output.

3/4″(18mm) to 1″(24mm), 2:1 heat-shrink forms a container around the circuits, with smaller adhesive lined 3:1 at the cable to provide a seal to hold the liquid epoxy.

Only fill to about 15% of the volume with epoxy. Here I’m using Loctite E30-CL. This epoxy takes 24 hours to fully cure.

GENTLE heating compresses the tubing from the bottom up. This forces the epoxy over the components

Before finishing, use a cotton swab to seal the edges of the probe with the epoxy. Cut PCBs can absorb several % water if edges are left exposed.

Complete the heating over a rubbish bin to catch the overflow & wipe the front surface of the probe so that you don’t have any epoxy on the sensing surfaces.

Soil moisture sensors measure the volumetric water content of a soil indirectly by using some other property such as electrical resistance or dielectric permittivity. The relation between the measurement and soil moisture varies depending on environmental factors such as soil type, temperature, or the amount of salt dissolved in the pore water.  This is kind of obvious if you think about how differently sand behaves with respect to water infiltration & retention compared to a soil high in clay content – but the low level details get quite complex.

I generally use our Classroom logger for backyard experiments. You want at least 2-3 monitoring locations due to the spatial variability of infiltration pathways, and then 2-3 sampling depths at each spot for a complete profile. Agricultural applications usually install two sensors, with one shallow sensor at 25-30% of the root zone depth and one deep at 65-80% of the root zone depth. But research projects install up to one sensor every 10cm through the soil profile. If you are doing that then you might want to install the sensor boards parallel to the ground surface and only power them one at a time so they don’t interfere with each other.

Vernier outlines a basic volumetric calibration procedure for soil sensors which starts by measuring soil from your target area that’s been dried in an oven for 24 hours. To get another calibration point you add an amount of water equivalent to some percentage (say 5%) of that soils dry volume and take another sensor reading after that’s had a chance to equilibrate.  To get a complete response curve you would use 5-10 jars of dry soil, adding different relative %-volumes of water to each pot from 5 to 50%. (Even in clay the %volume of water at field capacity is usually less than 50%.) Then you can interpolate any intermediate sensor readings with something like Multimap.

If the distance between interdigital coplanar electrodes is comparable to the smallest dimension of each electrode, then ‘fringe fields’ are significant.  As a rule of thumb, the field usually has a penetration distance of between 0.5-1x the distance between the centers of the electrodes.  I found several papers modeling that as one third of the width of the electrode plus the gap between electrodes: EPD ≈ (W + G)/3. In this case I estimate the useful sensing distance is less, say 3-6 millimeters from the probes surface, so you have to take care there are no air gaps near the sensor surface during the calibration, and when you deploy. Agricultural sensors are often placed in an augured hole filled with a screen filtered soil slurry to avoid air bubbles. One of the biggest challenges is that even after a good deployment, the soil dries out and ‘break away’ from contact with the surface on your sensor. This will give you grief with almost all of the soil measuring sensors on the market. (with the possible exception of neutron probes) Another issue with this method is drilling the hole necessarily cuts any moisture pulling roots away from the probe, creating offsets relative to the root-permeated soil nearby. 

The story gets more complicated with respect to growing things because the pores of a sandy soil might provide more plant available water than absorbent clay soils (see: matric potential) So it’s worth taking the time to determine the texture of your soil, and you have consider the root depth of your crop. (typically 6-24 inches)  With all the confounding factors, soil sensors are often used in the context of ‘relative’ boundaries by setting an arbitrary upper threshold for the instrument’s raw output at field capacity (~ two days after a rain event) and the lower threshold when plant wilting is observed. Soil moisture sensors also need to be placed in a location that receives a similar amount of sunlight to account for evapotranspiration. Then there’s all the factors related to your sampling technique.

Using ‘field capacity’ as our upper limit might make it possible to do a basic three -point calibration of your sensors: Dig your trench and take ‘in situ’ measurements with your probe before you disturb the rest of the soil. Extract two samples  with a tubular ‘cutter’  who’s volume is large enough to cover your sensor and weigh them (you can back-calculate the gravimetric % moisture for those in-situ readings later from the sample you dry out ).  Dry one completely in an oven and the raise the other one to field capacity by adding water and then letting it drain & stabilize for a day or so in a 100% humidity chamber. (a big zip-lock bag?)  The wet sample must be allowed to drain under gravity until water is no longer actively dripping from it. Then weigh both samples again & take readings with your sensor embedded in the wet & dry soil samples packed back into their original sampling volume. The tricky part is that you probably need to use a metal tube for cutting your sample (and for the oven drying) but you don’t want metal near a capacitance probe later on – so you would want to transfer your soil plugs into a PVC pipe with the same internal volume using some kind of plunger before the final measurements. The idea is you want to keep the relative ‘density’ of the sample similar to the original soil insitu.


The Hack:                                                               (click images to enlarge)

After testing some ‘naked’ boards ( where I had removed all the components)  I realized that the bare traces fell within a workable capacitance range for the same astable configuration the timer was already configured for:

Get the regulated boards with the CMOS TLC555 chip rather than the NE555. 3.3v operation is out-of-spec for the NE and 1/2 the NE’s I’ve tried didn’t even work in their default analog config at 5v. (& the 3.3v 662k reg is below spec if your supply falls below ~3.4v)

I remove the regulator & bridge the Vin to Vout pads. If you are going to pin-power the sensor you also need to remove the reg caps C5 (10µF) & C6 (160nF) as their inrush current could damage your MCU. Or add  ~150 limit resistor in series, but that will drop output voltage.

Note that some variants of these sensors come with the regulator already removed DO NOT BUY THESE BOARDS  – they use older NE555 chips which won’t operate at 3.3v.

Remove the T4 diode, C3 & C4 caps and R2& R3 resistors as shown.

Move the10k R1 to the R3 pads, and the 1Meg ohm R4 to the R2 pads. When the new R2 exceeds is more than 10x the new R3 resistor you approach a 50% duty cycle on the FM output.

Bridge the R1/T4 pads closest to the 555. This patches the frequency output to AOUT. Linking the other T4 pad to C3 replaces put’s the probes capacitance in its place.

There isn’t much left after the mod. It’s important to leave the C1 bypass in place but I haven’t had problems pin-powering other sensor boards with similar caps. It’s the bare minimum you can get away with. (& add a series limiter if pin powering)

It’s worth mentioning that the 555’s notorious supply-current spikes during output transitions might give you bad reads or weird voltage spikes. I tried pin powering anyway because the TLC555 is so much better than the the old NE555s which would surely destroy any IO pin used to supply it.  So I’m sailing pretty close to the wind here: it would be much wiser to just leave the original C5/6 caps in place and skip pin powering all together. Using a mosfet is the safer choice, but hey – this is a hack…right? Officially, as little as 0.1uF needs a limit resistor to protect I/O pins, but ‘unofficially’ pin-powering dodgey circuits with AVR pins is surprisingly robust.

With the probe capacitance varying from <30 pF to ~400 pF (air/water), using 1M/10K resistors on the R2&R3 pads will give you about 50 kHz output in air, and ~1.5 kHz in water. Or you could drop in your own resistor combination to tune the output.  Our ProMini based loggers have a relatively slow 8MHz clock so the upper limit for measuring period intervals is about 120kHz before things get flakey. On a 16MHz board you can reach 200 kHz easily and with a faster MCU you could tweak that to even higher speeds. But at first bounce, with parts I already had, the 1M&10K combination seemed  workable.

the TLC555 draws far less current and works at 3.3v.  It can also be pushed to 2 MHz in astable mode, though you’d need a more advanced counter to keep up. LMC555 & TLC551 work at even lower voltages than TLC555

You have variety of options to read pulsed signals with an Arduino. We reviewed those in the ‘Adding Sensors to an Arduino Datalogger‘ but the short version of that is:  Tillart’s TSL235R example works, or you could try PJRC’s FreqCount Library. Gate interval methods count many output cycles. This reduces error and lets you approach frequencies to about 1/2 your uC clock speed (depending on the interrupt handling). However at lower frequencies the precision suffers, so measuring the elapsed time during a single cycle is better.  Since I’ve already switched over to using the Input Capture Unit to read thermistors, I started with  Reply #12, on Nick’s Timers & Counters page.  This works with these hacked soil sensors, though it will occasionally throw a spurious High/Low outlier with those rounded trapezoidal pulses. Putting a few repeats through Paul Badgers digital smooth filter crops away those glitch reads and median filters are also good for single spike suppression.  Denes Sene’s Simple Kalman filter is also fun to play with, though in this case that’s  killing flies with a sledge hammer.

As usual, I pretty much ignored all the calibration homework and simply stuck the thing in the ground for a couple of weeks to see what I’d get. Which was fortunate in a way, because the sensor developed a problem which I probably would have missed during short calibration runs:

Probe Frequency [Hz] (left axis) at 5cm soil depth. Rain event on 9/5 reset the probe to normal for a few days.

The  daily thermal wobble was expected, but the probe repeatedly displayed an upward bend which did not match the daily ‘stair-step’ drying cycles seen with other nearby soil sensors. Were we slowly pulling the ions out of the soil matrix? Rain events would reset back to normal  behavior, but eventually the rising curve would happen again.  Perhaps that was because the water was leaving, but the ions were being held on the probe surface?  When I looked into the frequency of commercial sensors, they were running at least 100 kHz, and most were in the 10’s of MHz range. Some of them automatically increased frequency with increasing conductance specifically to avoid this type of problem.

While the heat shrink/epoxy method is our gold standard for sensor encapsulation, adhesive lined 3:1 heat-shrink can do a reasonable job on these sensors if you make sure the surfaces are super-clean with isopropyl alcohol & take time to carefully push out any air bubbles. (use gloves so you don’t burn your fingers!) A third alternative is to use hot glue inside regular heat shrink tubing – squashing it into full contact with the circuits while the glue is still warm & pliable. You still have to treat the edges of the PCB, but that can also be done with nail polish. While much faster to prepare: the heat-shrink (shown in the photo above) & hot glue methods will‘pull away’ from the smooth sensor surface after about 1 year in service – epoxy encapsulation lasts for the lifetime of the probe.

I also tried to measure the electrical conductivity of solutions with this hacked probe. But without polarity reversals, polarization again became a limiting problem – and this only gets worse if you increase resistor values to resolve more detail with slower 555 pulses.  So at low freshwater conductivities, where polarization is negligible, the probe works ‘ok’ as a low-resolution EC sensor if you take your readings quickly & then de-power the probe for a long rest period. (while stirring the heck out of it..? ) However the readings ‘plateau’ as you approach 10 mS/cm – so it’s not much use in the kind of brackish coastal environments we play in.

At it’s heart, this is just a variation of standard RC rise-time methods with the 555 converting that into pulsed output.  While my attempts with the 1M&10K pair didn’t deliver much, the parrot ain’t dead yet.  Changing that R2/R3 resistor combination to boost frequencies to much higher frequencies when the probe is in dry soil might reduce that polarization problem.  Or, with a fixed capacitor instead of the probe I could try replacing a resistor with some plaster of Paris & carbon rods for a matric potential sensor with pulsed output. Essentially using the circuit as a cheap resistance to frequency converter.

And then there’s all the other capacitive sensors that I could jumper onto the C3 pads.  At that point I might as well get out the hack-saw, because I’m really just using the top section of the board as a TLC555 breakout that I can mount under epoxy. When you consider how many of us are working with 3.3v MCUs, a low voltage 555 module should have been on the market already.  And while I’m thinking about that – where are all the 3v op-amp boards, with each stage jumper-able into several ‘standard recipes’, and linkable to the next by solder pads or holes along the outer edge?  I’m envisioning an SMD quad in the middle, and a few layers of elegantly designed traces & well labeled through-holes for population with resistors & caps.  Even at eBay prices, you’d think the mark-up would have made those common as dirt a long time ago . . .


Addendum 2023-12-11

Daniel Robertson posted some pictures of the electrode problems with these cheap soil sensors and his attempts to fix them.

Selected References:


Addendum: 2020-12-18

The analog soil sensor from the start of the post is still chugging away, but (with the exception of a few rainy days) after leaf-fall the soil sensor has basically leveled out at ‘field capacity’

Two heavy rain events in this record. With no more evapotranspiration, the soil stays saturated between them.

So there won’t be much going on over winter but, I will be leaving most of the loggers outside anyway. We have some northern projects waiting in the wings and I want to see how well the unregulated student builds stand up to the cold. Be interesting to see if the soil sensor can withstand being frozen right into the soil.  I expect those events will register as ‘extremely dry’ due to the reduced dielectric of ice.

Addendum 2021-05-02

Lately it’s been challenging to get the 3.3v regulated versions of theses soil sensors. Vendors on eBay have started listing 3.3-5v compatibility, and even posting the schematic showing the regulated TLC555 circuit, and then shipping the ‘5v only’ NE555 sensors. This kind of bait & switch is common with low end stuff from China and the problem is your shipping charge from the US back to Shenzhen usually costs more than the items. So I just started replacing the NE555 chips myself, since TLC555’s are only about 50¢ each:

A few moments with a heat gun easily lifts the old NE555 chip
Add a good amount of solder to the legs of the replacement chip
With a block to steady your hand, tack down opposite diagonal corners first
The TLC555 is pin compatible, and runs down to 2v. You need that range because pin powering the sensor through a 150 ohm limit resistor (average ~5mA draw) leaves only 2.65v to drive the sensor on a 3.3v system. The lost voltage necessarily compresses the output range too.

The Touchstone TS3002 timer IC could be another interesting 555 replacement option as it’s spec’d to draw only 1μA from a 1.8-V supply. A drain that low brings these soil sensors within the power budget of our 2-Part falcon tube loggers that run for a year on a coin cell.

Addendum 2023-03-18

From an electronics point of view, putting stuff in the ground isn’t really much different than putting it underwater. So people reading this post will probably some more useful information in our post about Waterproofing Electronics Projects.

Pro Mini Classroom Datalogger [2020 No-Solder Update]

2020 update to the Cave Pearl Classroom logger. This is a combination of inexpensive pre-made modules from the open-source Arduino ecosystem, and can usually be assembled by beginners in 1-2 hours.

(Latest Update: Mar 9, 2022)

Covid has thrown a spanner into the works for hands-on learning because even if you have the space to run a ‘socially distanced’ course, your students could still be sent home at any time.  With that in mind, we’ve divided the build tutorial from 2019 into separate stages that make it easier to restructure the labs:

1) Component prep:  requires the equipment you  normally have access to in the lab like soldering irons, heat guns, drills, etc.

2) Logger assembly: can be done remotely with scissors, wire strippers & a screwdriver. All connections are made by Dupont connectors or by clamping wires under screw terminals.

The complete tutorial can be run in person or if students are ‘distance learning’, the instructor can do the soldering (~15-20 minutes per set) and send out kits for the overall assembly. Even that will be challenging through a zoom window, so you might want to add USB isolators to protect tethered student laptops from accidental shorts. One big challenge of running a course remotely is the extra time to test all the parts before sending them out. A ‘breadboard logger’ like the one shown later in this post lets you do that testing quickly. Another challenge is that other USB devices can push the bus too fast for the slow serial UARTS, causing them to drop off the system due to timing conflicts. (this is more common on Apple computers).

During ‘normal’ runs if a student gets a bad component, or accidentally zaps something in one of the labs, then it simply triggers a brief process-of-elimination lesson while they swap in replacements from the storage cabinet until things are working. But remote students won’t have that option unless you send two of every part – which might be viable approach considering how cheap these components are:

This is a variation of the logger described in our 2018 paper but we’ve removed the regulator/ voltage divider and added screw terminals + breadboards for faster sensor connections during labs.  Bridging the I2C bus over the A2 & A3 pins leaves only two analog inputs on the screw-terminals. However for ~$1 you can add a 15-bit ADS1115 which provides differential analog readings using a fixed internal reference. So it’s unaffected by changes in battery voltage.

The main components:

 (NOTE: complete parts list with supplier links can be found at the end of this post) You don’t need the cable glands if you are using sensors that will work inside the housing (light, temp, acceleration, magnetometers, GPS, etc.) Don’t put holes in your housing unless you are sure you need them.

   
Cave Pearl data loggers

Two FT232 adapters (in red) & a CP2102 UART module (blk) with a pin order that matches the ProMini headers:[DTR-RX-TX-3v3-CTS-GND]  

You will need a UART adapter module to program your logger This must support 3.3v output & is easier to use if the pin order matches the ProMini connections. UART modules available with the FT232, CP2102, & CH340 chips will all work if the chip maker supplies drivers for your operating system.
The Arduino IDE will NOT be able to communicate with your logger unless the driver for your UART module is installed on your Windows or MAC operating system. We use FTDI basic UART modules & you can download the driver at the FTDI website.   There’s a basic installation guide at Adafruit , a more detailed one at Sparkfun, and PDF guides from FTDI.UART chips can only supply ~50mA so if your sensors need more current you might run out of power causing a restart of the ProMini. (A somewhat common problem when testing high-drain GPS modules or wireless transmitters)

(NOTE: I have connected ProMini’s to UART modules the wrong way round many, many, times, and none have been harmed by the temporary reversal. Also note that FAKE FTDI chips are a common problem with cheap eBay vendors, so it might be safer to buy a  SiLabs CP2102, or CH340 UART from those sources. If you are using the ‘cheap ones’ it’s a good idea to include UART modules from two different manufacturers in the student kits to deal with the inevitable driver compatibility issues.)

Component Prep.  Part 1:   Pro Mini   ( 3.3v 8Mhz )                       (click any image to enlarge)

Install the UART driver & IDE. Solder the UART pins & test ProMini board with the blink sketch:  Set the IDE to (1) TOOLS> Board: Arduino Pro or Pro Mini (2)TOOLS> ATmega328(3.3v, 8mhz) in addition to the (3)TOOLS> COM port to match the # that appears when you plug in the serial adapter.

Remove Limit Resistor to disable power indicator

With a known good Promini: Remove the power LED [in red square].                               SPI bus clock pulses will flash the pin 13 LED – so  leaving the pin13 LED connected will show you when data is being saved to the SD card.

Carefully remove the voltage regulator from the two leg side with snips. System voltage will vary over time, but the logging code we’ve provided on gitHub records the rail  without a voltage divider by comparing it to the 328p’s internal bandgap. Lithium AA’s also provide a very flat discharge curve.

Add header pins to the sides but DO NOT SOLDER THE RESET pin HEADERS – we will be using those screw terminals as power rails.

Bridge the two I2C bus connections with the wire leg of a resistor. Connect A4->A2 & A5->A3.

A4 & A5 I2C bus bridged to side rails

Adding:   DIDR0 = 0x0F;  in Setup disables digital I/O on pins A0-A3 so they can’t interfere with I2C bus.

Lithium AA batteries are preferred when running a 2-cell unregulated system because the slope of an alkaline discharge curve will reach the ProMini’s 2.7v brown-out with >50% of the battery capacity unused. (note that SD cards are safe down to ~1.8v) While the voltage of a newLithium AA is usually 1.8v/cell, that upper plateau usually settles at ~1.79 v/cell within an hour or two of starting the logger. That briefly dips to 1.6v/cell during >100mA SD card save events at room temp. At temps near 5°C (in my refrigerator) the SD write battery-droop reached about 1.5 v/cell while on the upper plateau. Lithium cells only deliver ~50% of their rated capacity at temps below freezing, but that’s still an improvement. And alkaline batteries leak quite ofteneven when they are not fully discharged. To date, leaking batteries have been the most common reason for data loss on our project.

The MIC5205 regulator is not efficient at low currents, so removing it reduces your sleep current by ~50%. However that modification also forces you to deal with a rail voltage that changes over time. Thermal rise from 15 to 45°C will raise your rail voltage by about 100 millivolts on lithium cells that have been in service for a few months. (~ 5mv /°C)  If your sensor circuit is a voltage divider that is being powered by the same  voltage the ADC is using as a reference then the ADC readings are unaffected by this.  However you will need to compensate for this in your calculations if your analog sensor circuits are not ratio-metric.  Battery thermal mass will cause hysteresis unless you read your reference resistors under the same conditions. Regulated ProMini’s usually see the rail vary by ~10-20 millivolts over a similar range of temperatures however it’s worth noting the reg/cap combinations on cheap eBay modules can be subject to other problems such as noise; which can be even more problematic wrt the quality of your data.  Most chip-based I2C sensor modules carry their own regulators (usually a 662k LDO) and use internal bandgap reference voltages so they are unaffected by the changing rail.

So making students deal with deal with power supply variation right from the start will save them from making more serious mistakes later because every component in your logger is a temperature sensor.  

Component Prep. Part 2:     Screw-Terminal Board & SD adapter

Reset terminals repurposed with jumpers under the board

At the UART end of the board: Use a tinned resistor leg to repurpose the RESET terminals: Join RST & GND pins on the digital side and link the pins labeled RST, 5v and Vin for the positive rail.  (include Vin only if the reg. has been removed! )

Label the screw terminal blocks that were connected under the shield with red & black markers to indicate the power rail connections. We have no reverse voltage protection – so insert AA’s w the correct polarity or the polarized Tantalum caps will burst.

Gently rock the Pro Mini back to front (holding the two short sides) until the pins are fully inserted. Some ST shields have slightly misaligned headers so this insertion can be tricky.

Remove the last three ‘unused’ female headers to make room for the SD adapter which fits perfectly into that pocket

NOTE: The SDfat library uses SPI mode 0 which sets the SCLK line low when sleeping causing a 0.33mA drain through the 10k SCLK pullup on the module.

Remove the bottom 3 resistors from the SD adapter – leave the top resistor near the C1 label in place!

Connection map for analog side of Nano S-Terminal board

NOTE: The Screw Terminal board we use in this build was designed for the 5v Arduino NANO, so the shield labels don’t match the Pro Mini pins on the ‘analog’ side. (the digital side does match) To avoid confusion may want to tape over those incorrect labels and hand write new labels to match the pattern above. Wire connections in this tutorial will be specified by ProMini pins:  D10-13 are used for the SD card, A4/A2 is the I2C Data line, and A5/A3 is the I2C clock line.

Technically speaking, bridging the I2C bus (A4=data & A5=clock) over top of A2 & A3 subjects those lines to more capacitance and pin leakage. (regardless of whether that channel is selected as input for the ADC p257).  However in practice, the 4K7 pull-up resistors on the RTC module handle that OK at the 100 kHz default bus speed.

Adding DIDR0 = 0x0F;

in setup disables digital I/O on pins A0-A3 to prevent interference with A0/1 ADC readings and the I2C bus on A2/3. If you want to disable only the digital IO on only A2 & A3 add

bitSet (DIDR0, ADC2D);
bitSet (DIDR0, ADC3D);

to setup{}.

Component Prep.  Part 3:     RTC Module,  Indicator  LED  &  Plano 3440 Housing

Remove two SMD resistors from the RTC board with the tip of your soldering iron. Note that this module includes 4k7 pullup resistors on SQW, SCL & SDA – leave those in place!

Optional! Cutting the Vcc leg lowers sleep current by 0.1mA but no I2C bus coms until coincell is installed.

Add 90 degree header pins to the I2C cascade port. Note: Cutting the VCC leg also requires you to ‘enable alarms from the backup battery’ with a registry setting.

Clean flux residue from both the main & cascade header pins with 90% isopropyl alcohol

Use a coin cell to determine the GND leg of a diffused common cathode RGB LED

Solder a 1-2k ohm limit resistor on the common GND. The precise value is not critical.

Add heat shrink, bend & trim the pins for connection to the screw terminal board. Pre-made 5050 modules also work but are not as good in light sensing mode.

Add holes in the rear struts of the Plano 3440 Stowaway housing to provide logger tie-down points later.

Stepped drill bits make clean holes in plastic  housings for different thread diameters. We use glands with waterproof DS18b20 sensors on 1m cables.

Centered holes are ‘slightly’ closer the bottom of the box to allow the gland to rotate without hitting the rim. Inner nuts must also be able to rotate for tightening.

Rubber washers are added to both the inside AND the outside surfaces. PG7 sized washers also fit the M12 cable glands we use.

A 3440 Plano Box configured for two external sensors with nylon M12 cable glands for 3-6mm cables. After threading  sensor cables I often seal the outside of the glands with a layer of silicone goop or nail polish.

As with the ProMini, it’s worth testing the RTC modules  & SD adapters before logger assembly. I keep a breadboard version of the logger handy so I can test several at a time. If the RTC temp register reads too high I throw them out because the clock time is corrected based on those internal readings. You could also set the clock at this point if the coin-cell is already in place. Note the 5050 LED module on the breadboard shown above could replace the 5mm LED in this tutorial.

Forcing the RTC to run from the backup coin cell reduces sleep current by ~0.1mA, bringing a typical “no-reg & noRTCvcc” build to ~0.15 mA  between readings. (with most of that for the sleeping SD card)  As a rough estimate, Lithium AA’s provide ~7 million milliamp-seconds of power, and your logger will burn ~12,960 mAs/day at 0.15mA. So ‘in theory’ you could approach a year before you fall off the ‘upper plateau’.  The clock will reset to Jan 1st, 2000 if you disconnect the RTC’s coin cell with a hard bump, but a couple of drops of hot glue should prevent this. If a reset does occur the time stamps will be wrong, but the logger will continue running the next day once the clock rolls around to the previous hour/minute alarm that was set.  A CR2032 can power the RTC for about four years but if you cut the vcc leg you must set bit six of the DS3231_CONTROL_REG to 1 to enable alarms or the logger will not be able to wake up. (NOTE: our logger code does this by at startup with the enableRTCAlarmsonBackupBattery function, which only has to run once – the RTC remembers the setting after that)

The soldered components ready for assembly.

Cutting the Vcc leg on the RTC is optional: if you leave the RTC power leg attached you’ll see typical logger sleep sleep currents in the 0.25 mA range, which should still give at least 4 months of operation before you trigger a low voltage shutdown. I’m being conservative here because runtime also depends on sensors and other additions you make to the base configuration.

See our RTC page for more detailed information on this DS3231 module.


Assembly Part 1:  The Screw-Terminal Stack

Part 1: This stack is the ‘core’ of your data logger.

It is very easy to get a couple of wires switched around at this stage so work through these instructions slowly & carefully.  Connect the Dupont jumpers to the SD module so that the metal retainer clips are facing upwards after the logger is assembled. That way you can diagnose connection issues with the tip of a meter probe on the exposed metal and, if necessary, pull out & replace a single bad wire without taking everything apart. The extra wires you trim from the SD module are re-used.

Add 2-3 layers of double sided foam tape to the sides & center of the screw terminal shield. The tape needs to extend farther the height of the solder points.

Add single wires from the 20cm M-F Dupont cable to the SD adapter.

The ‘metal tabs’ of the Dupont ends are facing the large metal shield over the SD card.

A layer of double sided foam tape secures the connectors & extends over the solder points.

Red=3v3
Grey=CableSelect [d10]
Orange=MOSI [d11]
Brown=CLocK [d13]
Purple=MISO [d12]
Black =GND

Tape the SD adapter into place on the area that’s been cleared at the back of  the screw terminal board.

Bend the jumper wires into place, mark the length & trim the original 20cm wires so that the final insulation length is 9cm or less.

Score the wire insulation about 1.5cm back from the wire end but do not remove the insulation.

Gently ‘pull & twist’ the  scored insulation away from the wire to wind the thin strands together.

‘Fold-back’ about half of the stripped wire to provide more copper surface for the screw terminals to bite on to.

SD Connection pattern:    Grey (CS) to ProMini D10Orange (MOSI) -> pm D11Purple (MISO) ->pm D12,      Brown (CLK) -> pm D13  (NOTE the shield labels say A0-A3 which do not match the D10-13 pattern of the Pro Mini pins)

Bring the red SD wire over to the re-purposed RST power connection

and the black wire to GND on the digital side. At this point you could test the  connections by inserting an SD card & running the CardInfo utility.

Connect the legs of the indicator LED at: D3=red, D4=GND, D5=green, D6=blue

Use the male ends of the wires you trimmed from the SD module to break out pin connections: Grey to A0, Brown to A1, Orange to D7, Purple to D8.

Add a layer of heavy duty (30Lb) double sided mounting tape to the back of the 2xAA battery holder. The battery holder wires need to be approx. 6inches/15cm long.

Attach the battery holder wires to RED>Vin & black>GND.  The breakout wires from A0/1 & D7/8  should be about 12cm long to comfortably reach the breadboard area.

Checking continuity to the top of the ProMini confirms the header pins & solder connections under the terminal board are good.

Take a moment to check the continuity of the SD module wires. With one probe on the Dupont metal & the other on top of the corresponding ProMini pin – you should read ~1 ohm or less for each connection path. Occasionally you get a bad crimp-end on those multi-wire Dupont ribbons, and it’s easier to replace a bad wire at this stage than it is after the parts are in the housing.

Note: We’ve used the hardware interrupt port at D3 for the red LED channel, but if you have sensors that need that simply shift the LED over by one. Any digital I/O pins can be used for the LED, but 3,5 & 6 have PWM outputs which lets you do multi-color fades with analogWrite()

Assembly Part 2: Add RTC Module Jumper Wires

Attach Dupont jumper wires to the RTC module using White=I2C Data, Yellow = I2C Clock. Blue is the SQW alarm output line. Nothing is attached to the 32k output pin (cutting the Vcc leg disables 32k output)

Use 20cm M-F jumpers on the 6-pin side of the RTC module and shorter 10cm M-F wires on the smaller 4-pin cascade port.

Add a layer of double sided tape to secure the jumper shrouds, and provide housing attachment points for the module.

Add as small piece of 1/16″ heat shrink tubing to reinforce the contact spring. This reduces the chance that the connection will be bumped loose if the logger is dropped.

Write the installation date on the coin cell with a marker. A new coin cell should power the RTC for about 4 years.          To avoid accidentally disconnecting the coin cell battery after the logger is assembled ->

Always check the backup voltage by placing the positive probe tip between the spring plates rather than on the surface of the cell.

Assembly Part 3:    Connect modules inside the housing:

Part 3: This is what you are aiming for. (click any images in the table below to enlarge them)

The final assembly stage can be a bit tricky – sometimes the metal contact flaps under the green screw terminals are ‘sticky’ so take some time to loosen  the screws and poke with the sharp end of your tweezers to make sure you can insert the bus wires from the RTC. It’s helpful to mark the wire lengths with a pen before cutting or stripping the RTC connections. When in doubt leave them a bit long. With screw terminals you always have the option of shortening those wire later on.

Attach the screw terminal stack onto the upper left corner of the housing, and the 2xAA battery holder in the lower right corner. These parts sb as far from each other as possible.

Add the first mini breadboard against the back so that it’s rear right edge aligns with the second rear support strut on the housing. Connect the long stack jumpers to that bboard to keep them out of the way.

Tape the RTC module into the lower left side of the housing, The blue board should be up against the front edge of the housing  so that you can easily access the nearby screw terminals.

Measure, mark and trim:  Red=3.3v, Yellow=>A3/A5 I2C clock, & White=>A2/A4 I2C data with enough wire to twist & fold the stripped ends under the terminals (~10cm of insulation length)

RTC module power & I2C bus connections:  All ports on the analog side of the Pro Mini / Shield combination are occupied with a wire connection.

Connect the black wire to the re-purposed RST=GND, and the blue alarm wire to  D2, leaving some extra wire length in a loop for strain relief. (5-6cm of insulation length)

Use the other side of the trimmed blue jumper wire  to extend the D9 connection over to the breadboard. You want enough wire length that the pins reach back-most row on the breadboard.

Attach a cable mount to the back of the housing, as close to the bottom of the box as possible so that it does not interfere with closing the housing lid. You can trim those plastic mounts with scissors to make them thinner.

‘Loosely’ tie the long wires to the rear mount. Add another cable mount near the center and attach the 2nd b-board leaving equal side of the 2nd board.

Every year at least one student gets confused about the orientation of the connections inside the breadboard and connects all the jumper wires together in the same row – including the red and black power wires. The resulting short circuit usually kills either the Pro Mini, the UART module, and/or possibly even the USB port on the computer it’s connected to:

Each 5-hole row on the top of the breadboard is connected by a metal rail of spring contacts.

Also note that the internal connectors do not cross the ‘gutter’ depression in the middle, so each side of the breadboard board has its own separate set of connections.


Your Logger is now ready for testing!

A typical I2C sensor configuration with: BMP280 pressure, BH1750 lux & 0.96″ I2C OLED display – connected by short jumper wires made with a crimping tool. The combination shown above averages ~10mA with screen & cpu running, and a sleep current of 0.147 mA with a 1Gb Sandisk SD card. Without the SD, the sleep current on this unit was 37µA; with the sensor modules needing 2-3µA each & the sleeping 0.96″ OLED drawing ~7µA.  A 25µA sleep current from the ProMini clone hints that the MCU might be fake but with a AA power supply it doesn’t really matter. Anything up to 250uA sleep current for a student build with an SD card connected should be considered good.  Watch out for SD cards that don’t go to sleep properly as they can draw up to 30-50mA all the time.

(Note: Most of the time the tests listed below go well, however if you run into trouble at any point read through the steps suggested for Diagnosing Connection Problems at the end of this page.)

1. If you have not already done so, Install the UART driver. The IDE will NOT be able to communicate with your logger unless the driver for your UART module is installed on your operating system.

2. Install the Arduino IDE into whatever default directory it wants – we’ve had several issues where students tried to install the IDE into some other custom sub-directory, and then code wouldn’t verify without errors because the IDE could not find the libraries. The programming environment is written in Java, and the IDE installer comes with its own bundled Java runtime so there should be no need for an extra Java installation. However we have seen machines in the past which would not compile known-good code until Java was updated on those machines; but this problem is rare.

If you have not already done so, there are three things you need to set under the IDE>TOOLS menu to enable communication with the logger:

Note: that the “COM’ setting will be different for each computer, so you will have to look for the one that appears on your system AFTER you plug in the UART module.

Using 22AWG solid core jumpers to bridge a set of ‘power rails’ along each side keeps the wiring tidy. If you are using several I2C sensors you could also do this with those bus lines.  After testing your prototypes, you can make them permanent by  transferring your circuit to solder-able mini breadboards.

The one that’s easy to forget is choosing the 328P 3.3v 8Mhz clock speed. If you leave the 328p 5v 16mhz (default), the programs will upload OK, but any text displayed on the serial monitor will be random garbled characters because of the clock speed mismatch.  Also be sure to disconnect battery power (by removing one of the AA batteries) whenever you connect your logger to a computer.  There is no power switch on the loggers, which are turned on or off via the battery insertion. Use a screwdriver when removing the batteries so that you don’t accidentally cause a series of disconnect-reconnect voltage spikes which might hurt the SD card.

3. Test the LED – the default blink sketch uses the pin13 LED, but because that pin is shared with the SD card’s clock line it’s recommended that you test the RGB indicator instead by adding commands in setup which set the digital pin 4 act as the ground line for the LED:
     pinMode(4, OUTPUT);   digitalWrite(4, LOW); 
Then change LED_BUILTIN in the blink code example to the number of a pin connected to your led module. (ie: for Red set it to 3, for Green use 5, or Blue use 6)

4. Scan the I2C bus with the scanner from the Arduino playgound. The RTC module has a 4K eeprom at address 0x56 (or 57) and the DS3231 RTC chip should show up at address 0x68.

The address of the eeprom can be changed via solder pads on the board, so it may have a different address. If you don’t see at least these two devices listed in the serial monitor when you run the scan, there is something wrong with your RTC module or the way it’s connected: It’s very common for a beginner to get some of the wire connections switched around during assembly but with the screw terminals this takes only a few moments to fix.

5. Set the RTC time, and check that the time was set – The easiest method would be to use the SetTime / Gettime scripts from our Github repository, but you first you need to download & install this RTC control library  The SetTime script automatically updates the RTC to the moment the code was compiled (just before uploading) so only run SetTime once, and then upload the GetTime sketch to remove SetTime from memory. Otherwise SetTime will keep setting the RTC to the old ‘code compile time’ every time it runs – and one of the quirks of the Arduino environment is that it restarts the processor EVERY TIME you open a serial window. The SetTime script also has a function which enables the alarm(s) while running the RTC from the backup coin cell battery.

Note:  the RTClib by Mr. Alvin that we use has the same name as the Adafruit library for this RTC and this can give you compiler errors if you let the IDE ‘auto-update’ all of your libraries because it will over-write the Alvin RTClib with Adafruit’s library of the same name. You then have to uninstall the Adafruit library ‘manually’ before re-installing Alvin’s RTClib again. This problem of ‘two different libraries with the same name’ was common back when this project started many years ago, but back then the IDE didn’t try to update them automatically.

Typical Cardinfo output on a windows computer when the connections are correct. If you format your SD card on an Apple computer there will also be a long list of ‘invisible’ .trash and .Spotlight files/folders at the root of the SDcard that show up with a CardInfo scan.

6. Check the SD card with Cardinfo
Note that the SDfat library we use to communicate with SD cards works well with smaller cards formatted as fat16, but ‘some’ Apple users find they can not write to cards in that format, requiring the SD cards to be reformatted as fat32 (note that most Apple systems have no problem with the fat16 SDcards). With either OS you should format the micoSD cards with this SDFormatter utility.  With a 15 minute sampling interval, most loggers generate ~ 5Mb of CSV format text files per year. Older, smaller SD cards in the 256-512Mb range often use less power. Note that we apply internal pullup resistors on some of the SD card lines in setup to help the SD cards go into low power sleep modes more reliably.

7. Calibrate your internal voltage reference with CalVref from OpenEnergyMonitor.

This logger uses an advanced code trick to read the positive rail voltage to ~11mv resolution by comparing it to an internal 1.1v bandgap reference inside the processor. That internal ref. can vary by ±10% from one chip to another, and CalVref gives you a numerical constant which usually brings the starter script’s rail=battery readings within ±20mv of actual. An accurate rail reading is more important when you are using ANALOG sensors where the positive rail directly affects the ADC output, but you can skip this procedure if you are only using digital sensors because they use their own internal reference voltages.

Typical CalVref output          (click to enlarge)

Load CalVref while the logger is running from USB power and then measure the voltage between GND and the positive rail with a  voltmeter. (this voltage will vary depending on your computer’s USB output, and the UART adapter you are using) Then type that voltage into the entry line at the top of the serial monitor window & press the enter key. Write down the reference voltage & constant which is then output to the serial monitor window. I write these ‘chip-specific’ numbers inside the logger with a black marker as they are related only to the 328p processor on the ProMini board used to make that particular logger. You then need to change the line #define InternalReferenceConstant 1126400L in our starter code to match the long number returned by CalVref. Alternatively you could just tweak the value of the reference constant ‘by hand’, increasing or decreasing the value till the reported rail readings match what you measure with a voltmeter. Add or subtract ~400 to/from the constant to raise/lower calculated output by ~1 millivolt. After you’ve done this once or twice you can usually reach the correct value with a few successive guesses.

8. Find a script to run your on logger. For test runs on a USB tether, the simplest bare-bones logger code is probably Tom Igoe’s 1-pager at the Arduino playground. It’s not really deploy-able because it never sleeps the processor, but it is still a useful ‘1-pager’ for teaching exercises and testing sensor libraries.  In 2016 we posted an extended version of Tom’s code for UNO based loggers that included sleeping the logger with RTC wakeup alarms. Our current logging “Starter Script” has grown since then to ~750 lines, but it should still be understandable once you have a few basic Arduino programming concepts under your belt.


Using the logger for experiments:

It’s important to understand that this logger was designed a teaching tool rather than a off the shelf, plug-&-play solution. Learning how to solder and getting some experience physically ‘putting things together’ are key outcomes.  Wrangling code into shape driving some new sensor combination is another vital part of that process.  So perhaps the best piece of advice I can give to new builders is:

Test,  Test,  and when you think your logger working: Test it Again

It’s nearly impossible to write code without little bugs and the only way to root them out is with multiple test runs. And even if the script you wrote is ‘perfect’ the processors on the sensor modules are also running code that you don’t have access to. For example, the mcu inside your SD card memory is more powerful, and may have more code on it than the ProMini at the heart of this logger. The only way to catch timing errors that might not get triggered until the 10th or 200th(?) pass is to run your code with a short 1 minute sampling interval until it’s crossed those roll-over thresholds many times. Use “Starting sensor X read” & “Finished sensor X read” print statements liberally during early USB tethered tests so you can observe the timing of events.

If you see water condensing like this on the lid of your logger then it’s time to examine the o-ring and add some extra sealant (nail polish or silicone) around the exterior of the cable glands. This logger quit after one week and it only lasted that long because of the desiccant pack.

Same thing applies to the sensor hardware in terms of durability, only now you have moisture to deal with. Everything that can be sealed in adhesive lined heat shrink, or potted in epoxy should be, once that hardware has passed your ‘dry’ tests. As a general rule no $10 sensor is going to be rated past IP68 which at best gives you 2-3 weeks of operation in the real world before water works it’s way in because of pressure imbalances caused by daily thermal cycling. You’d be surprised how easily moisture can wick along the air space ‘between the copper strands’ inside wires.

A doubling schedule works well for testing:  Check the logfile at 1 hour, 2 hours, 4 hours, overnight, 1 day, 2 days, 4 days, 8, 16, 32… etc. Move to the next longer test only when the data from the previous run is confirmed. Keep a close eye on that battery burn down rate: Until you get the hang of putting your sensors into low current ‘sleep’ states – getting your first logger builds to run for a couple of months on new batteries should be considered a spectacular success. At every startup watch and wait for the pattern of LED flashes to confirm that the launch went smoothly – it is very easy to insert a battery or SD card crooked by ‘just enough’ that the unit does not start, and it’s very frustrating to discover you have no data a week later.

You never really know how long a sensor is going to last until you’ve deployed it – no matter what the manufacturer says in the data sheet. Even then we usually deploy three of every ‘new’  combination, and if we are lucky we get one complete data set for the year.  Batteries leak, critters love to chew on things, and whenever humans come across something they’ve not seen before they will pick it up – especially if you had to invest a good deal of time securing your logger in exactly the correct position in the stream, on the tree, etc. We never deploy anything for real research until it has passed a several week-long rapid sample ‘burn-in’ test.


One positive aspect of the relatively loose fit of the Plano box lid is that it lets you run sensor tests quickly if you jumper your sensor module with thin 28-30 gauge wires:

A BMP280 pressure sensing module on long wires with crimped male dupont ends in the breadboard.

~1″ square of foam mounting tape with wires spaced evenly

Leave the red backing facing up as you fold the tape & wires over the corner edge.

The front corners of the box exert less pressure than the back corner shown here.

The sharp inner edge of the lid would cut the wire insulation if the tape was not there to protect, and even then you can only use this trick a few times.

The tape over the wires has to be replaced every time.

This gives you a chance to do some test runs before you commit to modifying the housing with holes or cable glands. For some indoor experiments this might be all you actually need, though I would still coat the ‘non-sensing’ parts of that dangling breakout with either conformal coating or clear nail polish. My general advice is: Do not put holes in the housing unless you are sure you need them.  The most common failure mode for student loggers used in outdoor environments is from moisture seeping into the through the cable gland. Natural heating and cooling cycles creates pressure differences between the inside and outside of the logger that drive this vapor exchange.  Moisture then condenses when temperatures fall at night, collecting on leftover flux residue to corrode contacts. An outer layer of self-fusing rubber mastic tape is often used on cable glands by electricians on out-door installations – even when using the expensive ones with soft rubber ‘cages‘.

After 1-2 minutes of kneading to mix the epoxy you have ~ 1 minute to work the putty into place. (it will become rock-hard within ~10 minutes). Be sure to leave yourself enough extra wire/space inside the housing so that you can open and close the lid easily without disconnecting anything after the putty hardens. This seal is not strong enough for underwater deployments, but it should easily withstand exposure to rain-storm events. HOT GLUE also works to seal pass-through ports with smaller wires & cables. Both pass-through methods can be helped by a layer of silicon caulking, nail polish, or conformal coating applied to the outside edges.

For a classroom project you could simply drill small a hole through the lid and stick the sensor/module on top of the housing, sealing the hole with double-sided tape. Thicker pass-throughs can be also be sealed reasonably well with plumbers epoxy putty which is non-conductive, and adheres quite well to  metal, glass & plastic surfaces->  This putty is also a quick way to make custom mounting brackets, or even threaded fittings if you wrap it around a bolt (which you carefully remove before the putty hardens completely)

No matter which pass-through method you are using: Silica gel desiccant packs are important for any outdoor deployments and 5-10 gram packets are a good size for this logger.

Don’t subject these loggers to a lot of bashing around by deploying them in a rough surf-wash zone, or swaying freely in the wind off the end of a tree branch. Solid core wires are pretty good if you cut them to exactly the right length , but longer beadboard jumpers are very easy to bump loose, so once you have your prototype working, it’s usually best to re-connect the sensors directly to the screw terminals before deploying a logger where it could get knocked around. In a pinch you can secure breadboard pins with a small drop of hot glue to keep them from wiggling.  Also remember that there are six ‘unused’ screw terminals on the base shield and these can be use to join wires together without soldering. 

2019 Logger mounted on a south-facing window. The top surface was covered with  white label-maker tape to act as a diffuser. 

[Click HERE] to read about the many types of sensors can be added to this logger The transparent enclosure makes it easy to do light-based experiments. Grounding the indicator LED through a digital pin allows it to be used as both a status indicator, and as a light sensorThe code we use is a polarity reversal technique that relies on the tiny capacitance inside the LED. (~5 to 20pF & the processor port adds 10pF) This technique requires the LED to connected directly to ProMini inputs because breadboards can add random amounts of changing capacitance. At these sub pF ranges, any humidity that condenses between the pins will also upset the readings, so desiccants are required. And finally the reverse bias decay is affected by the starting voltage, so if you want to use the technique in a rigorous ‘analytical’ setting you should leave the regulator on your logger.

We have integrated this LED sensor technique into the starter script on GitHub. I’ve tweaked the playground version with port commands so the loop execution takes about 100 clock cycles instead of the default of about 400 clock cycles.  The faster version was used to generate the following light exposure graph with a generic 5mm RGB LED, with a 4k7Ω limiter on the common ground.

Red, Green & Blue channel readings from the indicator LED  (from a regulated logger) over the course of one day (logger photo above)  The yellow line is from an LDR sensor the same unit, that was over-sampled to 16-bit resolution. The LED sensor has a logarithmic response and the left axis on the graph is a time- based measurement where more light hitting the LED sensor results in a lower number. Note how the RED signal changes before/after Blue & Green at sunrise & sunset.  LED’s work well with natural full-spectrum light, but their limited frequency bands can give you trouble with the odd spectral distribution of indoor light sources. The peak response of LED’s is usually 30–50nm lower than their peak emission wavelength If we assume the Red was Aluminum gallium arsenide (AlGaAs) then that channel probably had an absorption band @ ~680 nm (~15 nm FWHM?)  while the blue Indium gallium nitride (InGaN) channel is responding in the UV-A range, the Green channel (probably also InGaN ?) is most likely peaking around 420nm which is blue to our eyes. But without a spectrometer to test, these are just guesses. No temp. or cosine corrections were determined/applied, although blue/green channels tend to have low temperature coefficients because their bandgap is so far from the thermal spectrum. LED absorption bands have very little drift over time.

You can read more about LED based sensing techniques in the post about our leaf testing experiments which used two LEDs for a transmission-based variant of the NDVI ratio.

While the LED sensor idea is fun to work with, it’s a relatively slow method that can keep the logger running for many seconds when light levels are low. Figuring out how to take those light readings only during the day is a good coding exercise for students.

Note: VERY FEW light sensors can withstand exposure to direct sunlight. PTFE is an excellent light diffusing material which available in different sheet thickness.  The ‘divot’ on the lid of the Plano box is just a bit larger than 55mm x 130mm x 3mm (depth). The “teflon” tape that plumbers use to seal threaded joints can also be used. PTFE introduces fewer absorbance artifacts than other DIY diffusers like ping-pong balls, thermoplastic, or hot melt glue. Most light sensors like the TSL2561 need 3-5mm of that PTFE sheeting to prevent the sensors from saturating in full sun. LED’s have logarithmic response so you lose quite a bit of detail above 40,000 lux unless you add a diffusion layer to attenuate the signal.

Full sun exposure can also cook your logger. Internal temps above 80°C may cause batteries to leak or damage the SD card.  So if you are leaving the logger in full sun, add a bit of reflective film or some aluminum foil around the outside to protect the electronics. Of course if you have a light sensor you’ll need to leave some ‘window area’ for it to take a reading. 

The RTC has a built-in temperature register which automatically gets saved with our starter script however that record only resolves 0.25°C, so we’ve also added support for the DS18b20 temperature sensor to the base code. A genuine DS18b20 (yes, fake sensors are a thing) draws very little power between readings and you can add many DS18b’s to the same logger.


Addendum: Diagnosing Connection Problems

If you successfully loaded the blink sketch to test the ProMini during your initial assembly, then issues during the testing stage are often due to incomplete connections to the I/O pins.

If you see only “Scanning I2C….. ” but nothing else appears when running the bus scanner, then it means that the ProMini can not establish communication with the RTC module. One common cause of this problem is that the white & yellow wires have been switched around at one end or the other. It’s also easy to not quite remove enough insulation from the wires to provide a good electrical connection under the screw terminals, so undo those connection and check that the wires were stripped, cleaned & wrapped together before being put under the terminals.

Scanner lockup can also happen if one of the I2C devices on the bus is simply not working: usually about 1 in 6 logger builds ends up with some bad component that you have to identify by process of elimination. (These are 99¢ parts from eBay…right?) It only takes a moment to swap in a new RTC board via the black Dupont connector and re-run the scan. If the replacement RTC also does not show up with the I2C scanner then it’s likely that one of the four bus lines does not provide a complete connection between the ProMini & the RTC module.

On this unit I measured 1 ohm of resistance on the I2C clock line between the ProMini A5 pin (on top of the board) and the SCL header pin on the RTC module. So this electrical connection path is good. It’s not unusual for each ‘dry’ connection to add 0.5-1 ohm of resistance to a signal path.

To diagnose: Unplug any power sources to the logger. Set a multi-meter to measure resistance and put one probe lead on the topmost point of the promini header pins, and the other probe on the corresponding header pin of the RTC module. If there is a continuous electrical connection between the two points then the meter should read one ohm or less. Higher resistances mean that you don’t have a good electrical path between those points even if they look connected:

1) the ground (black) wire should provide a continuous path from the ground pin on the digital side of the Promini board to the GND pin on the RTC module
2) the positive power (red) wire should provide a continuous path from the Promini positive rail pin (the one with the bundle of 4 red wires) to the VCC pin on the RTC
3) A4 (I2C data) near the 328P chip on the Promini must connect all the way through the screw terminal board and through the white Dupont wires to the SDA post on the RTC
4) A5 (I2C clock) nearest the UART end on the Promini must connect through through the yellow Dupont wire to the SCL header on the RTC .

You occasionally get a bad Dupont wire where the silver metal end is not in contact with the  copper wire inside because the crimp ‘wings’ did not fold properly. With a pair of tweezers, you can ‘gently’ lift the little plastic tab on the black shrouds holding the female Dupont ends in place, and then replace any single bad wire. Be careful not to break the little black tab or you will have to replace the entire shroud.

Everyone uses short male-to-male Dupont jumper wires when they are creating test circuits because they are so convenient. But pre-made jumper wires are usually too long and so they get knocked around when you close the lid of the logger: so before you deploy take the time to convert your flexible-wire test circuit into one with solid core jumpers:

Flexible wires get used during the initial testing stages (when the lid of the logger is open).

Then the circuit gets re-done with solid core wires

Running wires ‘under’ the modules  makes it easier to close the lid  without disturbing the connections.

Also look at the little jumpers used to bridge the A4>A2 and A5>A3. If you have a ‘cold’ solder join, or an accidental bridge connection to something else, it could stop the bus from working. Re-melt each connection point one at a time, holding the iron long enough to make sure the solder melts into a nice ‘liquid flow’ shape for each solder point.

The connection diagnosis procedures described above also apply to the connections for the SD adapter board. Sometimes you end up with an adapter that has a defective spring contact inside the SD module, but the only way to figure that out is to swap it with another one.

Here a jumper wire from the ProMini pin is by-passing a bad connection on the screw terminal board.  This is also how you would break out A6 & A7 if you need them.

Sometimes those screw terminal boards have a poor connection inside the black female headers below the ProMini. It’s also possible to accidentally over-tighten a terminal and ‘crack’ the solder connection below the board – or there may simply be a cold solder joint on one of the terminal posts. If you have only one bad connection, you can jumper from the ProMini header pins on top, down to the other wires under the corresponding screw terminal. If you accidentally strip the threads on a screw terminal, you can use this same approach but move that set of wires over to one of the three ‘unused’ screw terminals at the far end of the board. (beside the SD card adapter) If you’ve gotten through all of the above steps and still have not fixed the problem, then it might be time to simply rebuild the logger with a different screw terminal adapter board.

If you do accidentally kill the ProMini by shorting a pin, etc, you can carefully lever it up away from the screw terminal shield and replace it without having to rebuild the whole logger.

Build two loggers at a time, because that lets you determine whether problems are code related (which will affect both machines the same way) or hardware related. (which will only affect one of your two units) At any given time I usually have 2-3 units running overnight tests so that I can compare the effect of two different code/hardware changes the next morning.  As a general rule you want to run a new build for at least a week before deploying to get beyond any ‘infant mortality’, and reach the good part of the bathtub curve.


An I2C OLED is quite readable through the lid of the housing. I often use Griemans text-only SSD1306Ascii library because it has a low memory footprint and sleeps well. While few loggers need live output when they are deployed, it’s often helpful to view diagnostic messages on battery power during testing. Adding two OLED displays let’s you view text & graphic output at the same time.  Adding a capacitive touch switch lets you check your logger’s status at any time.

Addendum:  A note about I2C sensors
The I²C bus is slow, so topology (star, daisy-chain, etc.) doesn’t matter much, but capacitance does. Both length & number of sensors increase capacitance. If you find that the devices work when you switch to a slower speed (e.g. 50 kHz), then this is probably your issue, and you need to minimize bus length and/or maybe decrease the combined resistance of the pull-ups to 2 kΩ or less. The DS3231 RTC module has 4k7 ohm pull-up resistors on the SDA & SCL lines & the Pro Mini adds internal 50k pull ups when the wire library is enabled. Typical I2C sensor modules usually add another set of 10k pullups so your ‘net pullup resistance’ on the I2C bus wires is usually:  50k // 4k7 // 10k = ~3k. With a 3.3v rail that means the devices draw 3.3v / 3k = 1 mA during communication which is fairly normal ( 3mA is max allowed) for total wire lengths below 1m. It’s common for pre-packaged sensors to arrive with housings at the end of about 1m of wire. If each sensor also adds another set of 10k pullups, the resistance generally compensates for the extra wire length, so the combination still works OK. But that depends on the cable too. A very bad cable might not even get to 0.5 meters and a very good cable (little capacitance to ground, no crosstalk between the wires) can go up to 6 meters.

For most sensor types there will be some options that draw much less power than others, and it’s always worth a look at the data sheet to make sure you are using one that will run longer.  The best chip based sensors automatically go into low current modes whenever the bus has been inactive, but more often you need to ‘manually’ put the sensors to sleep via specific commands. So it’s also important to check if your sensor library supports those ‘go to sleep’ & ‘wake up’ commands –  many common Arduino libraries do not.


Addendum:  The importance of moisture protection

I was noodling around in the garden recently and installed a few loggers without desiccants because it was only a short experiment. It rained immediately afterward and I noticed a small amount of moisture condensed inside the plano-box housing. While this didn’t prevent the logger from functioning, it completely disrupted the LED light sensors because the increased humidity provided an alternate discharge path for the reverse bias charge  on the LED’s:

Green channel data from a 5mm diffused RGB LED used as light level sensor. This logger was under some leaf cover, so there was considerable variability from the dappled light crossing over the sensor. An arbitrary cutoff of 200,000 was set in the code at low light levels.

After examining the O-ring I decided to add a little silicone to the channel holding the o-ring to improve the seal:

Gently pry the O-ring loose and apply sealant in the groove before replacing.

Bead only needs to be 3-4mm in diameter.

Close the housing & let the sealant set for a few days. The improved seal is especially visible at the corners

If you already have your logger assembled, try to find a silicone sealant that does not off-gas acetic acid (smells like vinegar) which could harm your circuits. If you are simply preparing empty boxes before assembly, then any regular bathroom sealant will do provided you give it about a week to finish curing.

Attach a mounting base to the lid so that a dessicant pack can be secured above the battery holder without interfering with any breadboard jumpers. Use a desiccant pack with color indicator beads, so you can check whether they are still working simply by looking through the transparent lid.


Addendum:  If you want to leave the original regulator in place

It’s worth mentioning that an unregulated build will run for many months – even on 2x regular alkaline batteries which reach the system cutoff (at 2750mv) more quickly. The key deciding factor is whether your sensors require tight voltage regulation. The DS18b20 has a nominal low voltage limit of 3v.  So if your project is making heavy use of those then there are only a few of modifications to the tutorial shown above to leave the ProMini’s default MIC5205 regulator in place:

Use straight header pins on the RTC modules cascade port to leave more space for the battery holder.

Only bridge the unused RST terminals to the rail connections Leave the Vin terminal separate for the raw battery input.

Add a 10/3.3 Meg voltage divider to read the raw battery voltage on A0

You will need more space for the extra batteries. You could go with a 3xAA holder but that leaves about 50% or your alkaline battery capacity unused. Or you could keep the standard layout and use 4xAAA batteries.

An alternative would be to add a better regulator to some kind of intermediate battery connector. The the photo on the right shows two ceramic 105’s stabilizing an MCP1702-3302E/TO, while the 10/3.3M ohm divider provides a third output  line so the ADC channel can monitor the raw battery voltage. This is the simplest way to retro-fit a unit that was built without a reg, with the added benefit that the new regulator is far more efficient than the original MIC5205 on the ProMini. It’s worth noting that even on a regulated logger you can monitor the rail voltage to determine when the main batteries are depleted because the regulators output will fall if the batteries reach a point below the minimum dropout voltage. If the rail falls under load by more than ~40mv, then it’s probably time to shut down the logger. With the regulator in place you probably don’t need the USB isolator, as the reg. itself cant pass more current than a USB port.


Addendum:  Things to keep in mind when ordering parts

When a finished module arrives at your doorstep for less than you’d pay for any of its sub-components – it’s because you are doing the quality control.

My advice is to order at least 5-6 of each of the core components (Promini, RTC, SD module, screw terminal board, etc) with the expectation that about 10% of any cheap eBay modules will be DOA or have some other problem. I build in batches of six, and one logger typically ends up with a bad part somewhere. Having replacement bits on hand is your #1 way to diagnose and fix these issues. Bad parts tend to come “in bunches”, so if you scale up to ordering in quantities of 10’s & 20’s then spread those orders to a few different suppliers so you don’t end up with all your parts from the same flakey grey market production run. Order from different vendors in different odd-number quantities (11, 21, 9, etc.) because that will be the only way you can distinguish which supplier, sent which parts, because nothing on the package will be written in English.

The other thing I can’t stress enough is CLEAN ALL THE PARTS as soon as they arrive. Leftover flux is very hygroscopic, and solder points will start to corrode the moment your logger gets exposed to atmospheric moisture. I usually give everything about 10 minutes in a cheap sonic bath with 90% isopropyl alcohol, rinse with water, and then dry the parts out in front of a strong fan for an hour. Clean parts that can’t take the sonic vibration (RTC modules, humidity sensors, accelerometers, etc) by hand with a cotton swab. Then store parts in a sealed container with desiccant packs till you need them.  I also coat the non-sensing/non-contact surfaces with a layer of MG Chemicals 422B Silicone Conformal Coating and let that dry for a day before assembling the loggers.  One hint that you may have moisture issues is that the sensors seem to run fine during indoor tests  but start to act strangely when you deploy the unit outside.

Used nut containers make excellent “dry storage” once the parts have been cleaned – but any air-tight container will do.

Another insight I can offer is that the quality of a sensor component is often related to the current it draws – if your ‘cheap module’ is pulling significantly more power than the data sheet indicates, then theres a good chance it’s a junk part. Usually if the sleep current is near spec, then the sensor is probably going to work. It is much easier to check low currents with a µCurrent or a Current Ranger. (I prefer the CR for it’s auto-ranging features) Sensors which automatically go into low current sleep modes take time – so you might need to watch the  current for several seconds before they enter their quiescent states. A common reason for a short operating lifespan on a logger is an SD card that refuses to go into sleep mode. If there is an SD card connected to your logger you must initialize it (with sd.begin in setup) or it may ‘stay awake’ causing a constant 30-40mA drain and/or may even cause the logger to freeze up. Also with SD cards, if the freshly formatted throughput drops below its rated write speeds when tested with H2testw, then find another card to use. I avoid cards bigger than 2Gb because they usually draw too much current, and it’s rare to need that much space for a logger.

With cheap part variation & beginner soldering skills, student builds range from 0.15mA to .5mA sleep current. But even at that high end you should still get a couple of months of operation of from the logger on fresh batteries.

TransparentSinglePixl
Bill of Materials: ~$22.00
  Plano 3440-10 Waterproof Stowaway Box
Sometimes cheaper at Amazon. $4.96 at Walmart and there are a selection of larger size boxes in the series. 6″ Husky storage bins are an alternate option.
$5.00
  Pro Mini Style clone 3.3v 8mHz
Get the ones with A6 & A7 broken out at the back edge of the board. Just make sure its the 8 MHz 3.3v version because you can’t direct-connect the SD cards to a 5v board. Watch out for non Atmel 328p chips.
$2.20
  ‘Pre-assembled’ Nano V1.O Screw Terminal Expansion Board
by Deek Robot, Keyes, & Gravitech (CHECK: some of them have the GND terminals interconnected)  You will also need to have a few 2.0-2.5mm flat head screw drivers to tighten those terminals down.  Since this shield is was originally designed for an Arduino Nano many of the labels on ST board will not agree with the pins on the ‘analog side’ of the ProMini.
$1.85
  DS3231 IIC RTC with 4K AT24C32 EEprom (zs-042)
Some ship with CR2032 batteries already installed.  These will pop if you don’t disable the charging circuit!  
$1.25
  CR2032 lithium battery  $0.40
  SPI Mini SD card Module for Arduino AVR
Buy the ones with four ‘separate’ pull-up resistors for removal if you decide to mosfet-switch the SD power lines.
$0.50
  SD card 256mb -to-1Gb 
 Test used cards from eBay before putting them in service. Older Nokia 256 & 512mb cards have lower write currents in the 50-75mA range. This is less than half the current draw on most cards 1gb or larger. I tend to avoid older cards labeled as ‘TransFlash’ because they seem to have more controller artifacts during saves. Small 128mb & 256mb cards under the name Cloudisk have appeared on eBay, and so far they seem to be working ok.
$2.00
  Small White 170 Tie-Points Prototype Breadboard
These mini breadboards for inside the logger are also available in other colors.
$0.60
  30cm Dupont 2.54mm M2F 40wire ribbon cable
Dupont connector hook-up wires might be expected to add an ohm or two of resistance and carry at most 100mA reliably with their thin 28-30 gauge wires.  Each 40-wire cable will let you make at least 2 loggers.
$1.55
  10cm Dupont 2.54mm M2F ribbon cable
Sometimes these 10cm cables are harder to find, so you can just use the longer 20cm wires in a pinch.  It’s usually also helpful to have a few Male-to-Male 10cm cables for interconnections on the breadboard.
$1.00
  2×1.5V AA Battery Batteries Holder w Wire Leads
If you are running an unregulated system on 2 lithium batteries, then you can use a 2x AA battery holder. If you need to keep the regulator in place to stabilize the rail voltage for particularly picky sensors, use alkaline batteries and a 4xAA battery holder. Watch out for ‘cheap’ battery holders with weak plastic at the connection ends which will slowly bend away from the batteries until they pop out in warmer climates. If that happens you can add a zip tie belt around the holder to keep the cells in place when the plastic softens.
$0.50
  5mm Common cathode RGB LED
Although you might want to use 10mm LEDs to increase surface area when using the LED as a light sensor. They also look better.
$0.10
  M12 Nylon Cable Glands (pack of 20 pcs) 
You will also need some extra rubber washers.
$0.70 /2pcs
  3.3V FT232 UART Module (get at least 2-3 modules – they are easy kill with a brief short)
 *jumper the pads on your UART module to 3.3v output before using it!* You will also need a few USB 2.0 A Male to Mini B cables. You may need to install drivers from the FTDI website depending on your OS. These boards can only supply ~50mA which can be tricky if your sensors need more for sustained periods. If you are running the class via distance learning it’s probably a good idea to also get some CP2102 (c231932) UART boards and send your students one of each type. If they are unable to get the drivers working for the FT232, they have a second option. You may have to hunt around for non-FTDI chip boards with the same pin order as the ProMini [ DTR-RX-TX-3v3-CTS/gnd-GND ]  The DTR pin is critical for uploading code, while the CTS (clear to send) is an input pin for the FTDI chip only and CTS is not used by the ProMini (so it’s usually just tied to ground).  So many UART adapters only have 5 connections and you have to cross the wires over each other to get the connections sorted out.  Watch out for 6-pin UART modules that put a (+)ive power connection in the same physical alignment as the GND connection on the ProMini  –  those boards can create a short circuit unless you re-route the wires. It’s also worth knowing that UARTs can communicate directly to serial sensors like GPS modules for testing. Premade 30cm 6-pin Dupont jumper cables are also available..
$2.75
  3M Double-side Foam Tape, LEDs, header pins, 3/4 inch zip Tie Mounts, etc…
I use 30lb ‘outdoor’ or VHB (high bond) foam tape, each logger takes ~30cm length
$1.00
Some extra tools you may need to get started:                (not included in the total above)
  2in1 862D+ Soldering Iron & Hot Air station Combination
a combination unit which you can sometimes find as low as $40 on eBay.
Or you can get the Yihua 936 soldering iron alone for about $25. While the Yihua is a so-so iron, replacement handles and soldering tips cost very little, and that’s very important in a classroom situation where you can count on replacing at least 1-2 tips per student, per course, because they let them run dry till they oxidize and won’t hold solder any more.  Smaller hand-held heat-shrink guns are available for ~$15, $10 80Watt-AC &  $5 USB soldering irons are quite useable.
$15.00 – $50.00
  SYB-46 270 breadboards (used ONLY for soldering header pins )
Soldering the header pins on the pro-mini is MUCH easier if you use a scrap breadboard to hold everything in place while you work. I use white plastic breadboards that only have one power rail on the side since I won’t mistake them for my regular breadboards. I also write ‘for soldering only’ on them with a black marker.
$1.30
  SN-01BM Crimp Plier Tool 2.0mm 2.54mm 28-20 AWG Crimper Dupont JST
I use my crimping pliers almost as often as my soldering iron –  usually to add male pins to component lead wires for connection on a breadboard. But making good crimp ends takes some practice.  But once you get the hang of it,  Jumper wires that you make yourself are always better quality than the cheap premade ones.
$16.00
  Micro SD TF Flash Memory Card Reader
Get several, as these things are lost easily. My preferred model at the moment is the SanDisk MobileMate SD+ SDDR-103 or 104 which can usually be found on the ‘bay for ~$6.
$1.00
  Side Shear Flush Wire Cutters & Precision Wire Stripper AWG 30-20
HAKKO is the brand name I use most often for these, but there are much cheaper versions.
$5-10
  Dt380 Multimeter
Dirt Cheap & good enough for most classroom uses.
$3.50
  Syba SY-ACC65018 Precision Screwdriver Set
A good precision screwdriver set makes it so much easier to work with the screw terminal boards. But there are many cheaper options. The screw terminal boards need 2mm (or less) flat slot tips.
$12.00
  Donation to Arduino.cc
If you don’t use a ‘real’ Pro Mini from Sparkfun to build your logger, you should at least consider sending a buck or two back to the mother-ship to keep the open source hardware movement going…
$1.00

.. and the required lithium AA batteries are also somewhat expensive, so a realistic estimate is about $25-30 for each logger when you add a couple of sensors. Expect parts from low-end suppliers to take 4-6 weeks to arrive and always order at least 50% more than you actually need so you have spares. If you’re pressed for time everything on this list is also available from trusted first-tier suppliers like Sparkfun, Adafruit, Pololu, etc – but you will pay 5-10x as much, with an additional $10-15 shipping charge unless you pass the minimum order level. Amazon is now in a kind of weird grey zone between the two as many vendors that sell on eBay, are also selling on Amazon for 2-3x the price. 


Addendum:  Using a more advanced processor

Moteino MEGA based Cave Pearl Logger

After you’ve built a few ProMini based loggers, you might want to try a processor upgrade. The 1284p CPU has twice the speed & 4x the memory, but delivers comparable sleep current & operating life.


Addendum:  Low Temp. effects on 2x Lithium powered logger

2x LithiumAA millivolts (blue-left) vs RTC Temp °C (orange-right) on cells that have been in service for 5 months. We will leave this unit running over winter to see how DS18b20 on that logger handles it if/when the cells fall below the DS18’s 3V minimum, and then rise back up again. (click image to enlarge)

A crop of these loggers have been running in our back-yard garden since mid-summer with various sensor combinations. Winter is finally reaching us so we can now observe how the cold affects an unregulated 2x Lithium AA supply.  This ‘student build’ sleeps at ~170uA and has been running for five months. The battery curve was virtually flat above 15°C but it is now being quite strongly affected. Peak loads from the SD card are in the range of about 150mA and the unit is running with a 5 minute sampling interval.

Note: 2022-10-01: We’ve had several unregulated 2xLithium cell loggers running over winter now, with temperatures varying from -20°C to +40°C throughout the year. On units where the sleep current is in the low 20uA range, we typically see the voltage supplied by two cells in series vary due to that that 60 degree range from a low of 3350 to about 3550 mv on hot summer days. So about 200mV thermal delta in normal environmental conditions.

According to Energizer: In ultra-low drain applications like these dataloggers, the discharge curve has a distinct two stage profile. The first ‘very flat’ plateau occurs at slightly higher voltage (nominally 1.79V (or ~3.58v for two cells) @ 21°C) is nearly independent of depth of discharge. This unchanging stage lasts for about 2/3 of the batteries lifetime. The second stage occurs at a slightly lower voltage (nominally 1.7V (or ~3.4v for two cells) @ 21° C) where the cell voltage then decreases slowly as a function of depth of discharge.  In my longer run tests, when the two lithium AA cells in series have fallen below ~3.1v, it’s time to shut down the logger.


Addendum:  Adding a TTP233 Capacitive Switch lets you check your logger ‘any time’

With a capacitive touch switch that works through the housing, you can check the status of your logger at any time.

Our next tutorial post in the student logger series: Enhance your Logger with an OLED & T233 Capacitive Touch Switch  is an excellent ‘next step’ for people using this logger in a classroom setting. The method is easily adapted to trigger ‘opportunistic’ readings in environments that require manual control, but it’s also handy when you need to check the battery level on a complex installation that you don’t want to disturb before the end of the experiment.


Addendum:  Another fine crop of student loggers this year!

A soil sensing lab where students characterize daily water use by various potted plants.


A 2-Part ‘mini’ logger released in 2023

Dr. Beddows instrumentation students have been building this Plano-boxed logger for years, and the ability to swap sensors or add an OLED screen has allowed continuous course development. But for those wanting a simpler ‘bare-bones’ version we’ve developed a 2 module classroom logger using 3D printed rails. Without the SD card this unit is memory constrained, and data download is handled via through the serial monitor window in the IDE. This model requires fairly detailed soldering so students get a complete practice lab soldering header pins onto perf-board before attempting the assembly. Running from a coin cell required the addition of several more advanced code techniques than the 2020 student logger at the beginning of this post. But for instructors, this is the least expensive option that still provides your students with an opportunity to change the sensors to develop their own projects.


Using the ADS1115 16-bit differential ADC for Rapid Burst-Sampling

Testing configuration w differential reads from a piezo triggering burst-samples with a $1 ADS1115 module.

The 16-bit ADS1115 has a programmable amplifier at the front end, with the highest gain setting providing a range of +/- 0.256 v and a resolution of about 8 micro volts.  But readers of this blog know you can already approach 14-16 bit sensitivity levels with Arduino’s ADC by oversampling with lower Arefs & scaled ranges. PA1EJO demonstrated a ADS1115 / thermistor combination which resolved 5 milli Kelvin, but we can reach that resolution on our NTC’s using the ICU peripheral with no ADC at all. The beauty of time-based methods is that they scale gracefully with sensors that change over a huge range of values.  So why am I noodling around with this ADC module?

The primary attraction is this ADC has differential inputs. This is especially useful with Wheatstone bridge arrangements. A typical combination would be a two element varying bridge, and an inexpensive voltage reference like the LM4040, or the TL431. Adding the second sensor doubles the voltage swing, and the ADC’s  -32768 to +32767 raw output fits perfectly into Arduino’s 16-bit integer variables. It’s also worth noting that unlike most ADC’s – the ‘volts per bit’ via the gain settings are independent of the rail voltage supplying the chip. This means that the ADS1115 can measure it’s own supply using that internal reference without a divider. The drawback of that is I have to set full-scale as +/-4.096V on my 3.3v loggers, so the ADC only uses ~80% of the bit-range.   

Read the difference between A0 and A1 as a differential input, and read A2 as a single-ended input. That will give you an ‘almost‘ ratio-metric measurement because you record every voltage affecting the output. (although since the supply is not Aref like it would be in a regular ADC – the uncorrelated noise in the LM4040 excitation voltage ‘between’ those two readings will not get corrected)  I treat the ref. resistors as ‘perfect’ in my calculations, which forces their tempco errors into the thermistor constants during calibration.

The diodes shunt any voltages that exceed their vF, protecting the ADC from spikes beyond the +/-0.256v range at high gain. AND the leakage that Shottky’s are known for bleeds away residual charge on the piezo, preventing drift from the 1.65v bias point. All the data presented in this post used this circuit. Other diodes, or even garden variety LED’s, could also be used to clip the signal at different voltages. Most have far less leakage than Shottkys, so you might need to add a large value bleed resistor. If you do end up with an offset, an old trick is to run a very aggressive low pass filter on your readings to obtain the offset and then remove it by  subtraction.

Piezos can also be read with bridge arrangements if they are physically connected with alternating polarities, but that’s not usually the case for active sensors. I have a new project in the works where the sensor will only generate +/- 5mv, and I’d like to see if capturing signals that small is even possible with the ADS1115. To reveal where the weak points are I’ll test it with a single piezo disk reading at the highest gain and fastest sample rates. At this sensitivity a 5mv swing will only produce ~640 counts.  With my signal only covering 2% of the bit range, I’m hoping that the differential readings will compensate (?) for  noise on the rails. The data sheet warns about low input impedance (710kΩ) but I don’t think that will affect this test. Another significant limitation of the ADS1115 is that, like the Arduino driving it, no voltages below GND, or above Vcc are allowed on any input. Bridge arrangements automatically bias to the mid-point, so while the tie-in points might go ‘negative’ relative to each other, they are still positive relative to GND on the ADC.  For single sensor applications with +/- output, you need to provide that biasing with a couple of resistors.

An often overlooked feature of the ADS is the programmable comparator which can set threshold alarms on the ALRT/RDY output. Most loggers operate with fixed interval sampling, but this makes it difficult to measure things like airborne exposure peaks for chemical vapors; even with short intervals. Sensor-triggered sampling can also save battery power by letting you sleep the CPU – especially when you are monitoring environments that are only ‘active’ during certain seasons, or with rainfall events. The different comparator modes on the ADS1115 also offer some interesting possibilities for system control.

Driving the ADS1115:

This chip’s been around for a long time, so there are several libraries to choose from. And, as usual, many of them don’t support the features that a project building loggers would be most interested in. I suspect this is because wireless coms use such a prodigious amount of power that few in the IOT crowd would bother writing efficient code for chips that already auto-sleep. The Adafruit library even inserts 8ms delay statements – wasting cpu power and throttling the sample rate to 125sps. Rowberg’s I2Cdevlib does a better job with setConversionReadyPinMode() functions. But his code example only polls the I/O status, rather than using the hardware interrupts available on the same pin.

Perhaps the easiest starting point for beginners is the ADS1115 lite library This is a stripped down version of Adafruit’s lib. but Myers has removed the explicit delays and replaced them with a do-while loop which polls the Operational Status bit to see when the ADC has a new reading in the output registers. This minimalist approach uses only two main functions:

triggerConversion() – Sets config register bits  & then writes that register back to the sensor (which automatically starts a single-shot reading) The ADS1115 auto-sleeps after the reading.

getConversion() – A do-while loop forces the CPU to continuously check the Operational Status bit. That bit change breaks the loop, and getConversion then reads the 16-bit output register.

With this single-shot approach, a short for-loop takes burst of readings:

#include <ADS1115_lite.h>    // https://github.com/terryjmyers/ADS1115-Lite
#define numberOfSamples 500
int16_t ADS1115raw[numberOfSamples];

setMux(ADS1115_REG_CONFIG_MUX_DIFF_0_1);          // uses #define statements
setSampleRate(ADS1115_REG_CONFIG_DR_860SPS);  // for the config bitmasks from
setGain(ADS1115_REG_CONFIG_PGA_0_256V);             // the original Adafruit library

for (int i = 0; i < numberOfSamples ; i++) {     //  I usually read 500 samples
triggerConversion();                                           //  during testing, which fills the
ADS1115raw[i] = getConversion();                   //  the serial plotter window nicely
}

In single shot mode, you have to re-write the configuration register every time you want a reading:

Myers triggerConversion() function sets the config register with a common Bitwise-OR method. I’m going use this as a starting point, tweaking a few things for better readability and including my standard a 16-bit register functions so this page doesn’t scroll on forever.
(also note that in addition to my typos, wordpress inserts a ton of invisible cruft characters that will mess with the IDE – so don’t copy/paste directly from this post…)

uint16_t config = 0;   //  All bits set to 0
config |= _rate;   config |= _gain;   config |= _mux;    // sets matching bits to 1
bitSet(config, 8);      // MODE set to 1 = single-shot & power-down  (the default)
bitSet(config, 15);    // setting oneshot bit starts a conversion, bit goes low when done
i2c_write16bitRegister(ADS1115address, ADS1115_REG_POINTER_CONFIG, config);

Sensor Triggered Sampling:

Let’s use the comparator to start each burst of readings in response to me tapping the surface of the desk that the piezo sensor is resting on. Although Myers polling method doesn’t use the ADC’s ALERT/RDY output, we are already set up for triggered bursts because all the comparator control bits were zeroed with config = 0 at the start. 

COMP_MODE: 0    =>   Traditional hysteresis mode (On above Hi_thresh, Off below Lo_thresh)
COMP_POL:  0       =>   ALERT active brings the pin LOW
COMP_LAT: 0         =>   NON latching
COMP_QUE: 00     =>   ALERT after one reading above Hi_thresh  (01=2reads, 10=4reads)

With this as the starting point all you have to do to initiate comparator threshold alerts is load some non-default trigger values into the Hi_thresh & Lo_thresh registers.  Hi_thresh must be greater than Lo_thresh, and you have to use ‘2s complement’ values

// set Lo_threshold register (0x02) to ‘2’s complement’ equivalent of decimal 250:  
i2c_write16bitRegister(ADS1115address,  0x02,  0x00FA);
// set Hi_threshold register (0x03) to equivalent of decimal 300:
i2c_write16bitRegister(ADS1115address,  0x03,  0x012C);

Now we need a way to make the processor respond the ADC’s alert. If I wanted to use the same power wasting methods you find in most sensor libraries, I’d connect ALRT/RDY  from the ADC to any digital input pin, and poll the pin until it goes low:  

void pollAlertReadyPin() {   // this code will time out eventually
for (uint32_t i = 0; i<100000; i++) {
if (!digitalRead(AlertReadyPin)) return; }
Serial.println(“Timeout waiting for AlertReadyPin, it’s stuck high!”);
}

This might be OK for an IOT sensor hanging off of a wall-wart. But for logging applications a hardware interrupt based approach lets you save power by sleeping the processor until the trigger event happens:

void INT1pin_triggered() {
INT1_Flag = true;
}

// – – – – – – later on – – – – – – – – in the main loop – – – – – – – – – – –
uint16_t
config = 0;   //  All bits set to 0
config |=  ADS1115_REG_CONFIG_MUX_DIFF_0_1 ; // using #defines from Adafruit lib
config |=  ADS1115_REG_CONFIG_DR_475SPS ;
config |=  ADS1115_REG_CONFIG_PGA_0_256V ;

bitClear(config, 8);   // MODE set to zero = continuous sampling – redundant here
i2c_write16bitRegister(ADS1115address, ADS1115_REG_POINTER_CONFIG, config);

i2c_write16bitRegister(ADS1115address,  0x02,  0x00FA); // set Lo_thresh = 250
i2c_write16bitRegister(ADS1115address,  0x03,  0x012C);  // set Hi_thresh = 300

// ALRT/RDY output from ADC is connected to the hardware INT1 pin
set_sleep_mode(SLEEP_MODE_PWR_DOWN);
bitSet(EIFR,INTF1);    //  clear pre-existing system flags on INT1 pin
noInterrupts ();  
attachInterrupt(1,INT1pin_triggered,FALLING); 
INT1_Flag = false;     //  reset the flag before the do loop
sleep_enable(); 

    do {       // loop keeps the processor asleep until INT1pin_Flag = true
          interrupts ();   
          sleep_cpu ();   
          noInterrupts ();    
    } while ( !INT1_Flag );   
detachInterrupt(1);
sleep_disable ();
interrupts ();

// after waking, reset the threshold registers to their defaults to disable the ALERTs
i2c_write16bitRegister(ADS1115address,0x02,0x8000);// Lo_thresh default = 8000h
i2c_write16bitRegister(ADS1115address,0x03,0x7FFF);// Hi_thresh default = 7FFFh

// now gather single-shot readings as before
for (int i = 0; i < numberOfSamples ; i++) {
triggerConversion();    //  resets the config register to single shot mode every cycle
ADS1115raw[i] = getConversion();    
}

With 200 / 300 set as thresholds, tapping the desk beside the piezo produced:

RAW ADC output vs Sample Number: Threshold triggered: A0-A1 differential, 475SPS, 16x PGA,500 samples

With readings above 2000, I was hitting the desk a bit too hard for that 5mv target range. And 475 samples-per-second is not quite fast enough to show piezo sensor behavior. Zooming in also shows that the ADC was aliasing through some background signal:

RAW ADC output vs Sample Number: ADS1115 & piezo sensor, A0-A1 differential, 475SPS, 16x PGA, 500 samples

That’s a classic ‘mains hum’ problem.  Annoying, but from a research perspective the loss of information from the start of the event was is a more of an issue: What happens if we only get one chance to record our event?

Pretriggered acquisition:

To capture infrequent events, I need to start acquiring data before the reference trigger. And since the waiting period is unknown, those readings need to go into a circular buffer that wraps around and stores each new sample over the oldest one in memory. With this approach the trigger event actually serves to stop the acquisition rather than to start it. And you want to do this gradually, so the samples in the array represent a “slice-in-time” covering the entire event.

The real trick is to sleep the main processor as much as possible during the pre-fetch period. In continuous conversion mode the ADS1115 can alert completion with an 8 msec pulse, but with only one alarm output, the ‘threshold detection’ will have to be done in software:

void INT1pin_triggered() {
INT1_Flag = true;
}

//  – – – – – – – – in the main loop – – – – – – – – – – –
uint16_t
config = 0;   //  All bits set to 0
config |=  ADS1115_REG_CONFIG_MUX_DIFF_0_1 ; // #defines from Adafruit lib
config |=  ADS1115_REG_CONFIG_DR_860SPS ;       // the max speed
config |=  ADS1115_REG_CONFIG_PGA_0_256V ;     // maximum gain

bitClear(config, 8);   // MODE set to zero = continuous sampling – redundant
i2c_write16bitRegister(ADS1115address, ADS1115_REG_POINTER_CONFIG, config);

// continuous mode 8ms ‘pulses’ require these specific values in the threshold registers:
i2c_write16bitRegister(ADS1115address,  0x02,  0x0000); //Lo_thresh MS bit must be 0
i2c_write16bitRegister(ADS1115address,  0x03,  0x8000);  //Hi_thresh  MS bit must be 1

// ALRT/RDY output from ADC is connected to the hardware INT1 pin
// housekeeping variables for sampling loop control:

bool
triggerHasHappened = false
int countdown = numberOfSamples/2; // sets # of samples taken AFTER trigger event
int countup = 0; // If triggered before the array is 1/2 full, countup used to fill remaining
int arrayPointer =0; // tracks where we are in the circular buffer

set_sleep_mode(SLEEP_MODE_PWR_DOWN);
// now loop forever till trigger event starts the countdown
// then collect  numberOfSamples/2  more readings
while ( countdown>0 ){  
  bitSet(EIFR,INTF1);   //  clear any pre-existing system flags on INT1 pin
noInterrupts
();  
  attachInterrupt(1,INT1pin_triggered,FALLING); 
  INT1_Flag = false;     //  reset the flag before the do loop
  sleep_enable(); 

      do      // short sleeps while waiting for each ADC reading
          {  interrupts ();  sleep_cpu ();   noInterrupts ();  }
      while ( !INT1_Flag );   
      detachInterrupt(1);  sleep_disable ();   interrupts ();

// load one reading into the ADS1115raw array
ADS1115raw[arrayPointer] =
i2c_read16bitRegister (ADS1115address , ADS1115_REG_POINTER_CONVERT);

// here I’m using 200 as the threshold reading to start the countdown
if
(( ADS1115raw [ arrayPointer ] > 200) && ( !triggerHasHappened ) ){
triggerHasHappened = true //only needs to occur once
if (countup < (numberOfSamples/2)){  // trigger happened b4 array was 1/2 full
countdown=countdown+((numberOfSamples/2)-countup);
 // increases countdown by the difference so you always capture numberOfSamples
}
}

if ( triggerHasHappened ){  //then only fill the last half of the array
countdown = countdown-1; // limits the number of new readings
}

// advance arrayPointer with ring-buffer MODULUS formula:
// automatically goes back to zero when the pointer reaches the end of the array

arrayPointer = (arrayPointer + 1) % numberOfSamples;
countup=countup+1;

 // =====end of while ( countdown>0 ) loop======
sleep_disable ();

// reset the registers to startup defaults to stop ADC continuous running
i2c_write16bitRegister(ADS1115address,ADS1115_REG_POINTER_CONFIG,0x8583);
//sets: ±2.048V,128SPS,NoCOMParator,AIN0&AIN1,Trad,NoLAT,NoALERTs,ActiveLOW
i2c_write16bitRegister(ADS1115address,0x02,0x8000);  // Lo_thresh default
i2c_write16bitRegister(ADS1115address,0x03,0x7FFF);   // Hi_thresh default
//read the ADC output registers to remove any residual ALERT/RDY latches
i2c_read16bitRegister(ADS1115address,ADS1115_REG_POINTER_CONVERT);

Setting countdown = numberOfSamples/2 centers the event in the array. (although 1/3 to 2/3 split might be better?) A tap on the desk with a pencil produced a +/- 5mv swing (~640 raw counts), and my breadboard proto circuit is picking up almost 100 counts of mains hum. 

RAW ADC output vs Sample #: 860sps, 16xPGA, diff. A0-A1, USB powered from laptop

Losing 20% of my available signal range to background cruft is a problem. Adding a $10 USB isolator, reduced that by about 1/3. But the 60 Hz signal was still distorting the shape of the waveform significantly or we’d be seeing a smoother damped harmonic..

RAW ADC output vs Sample #: 860sps, 16xPGA, diff. A0-A1, with USB isolator. Hit the desk a bit to hard on this one.

My first thought was ‘This is a well behaved, repeating signal – I’ll just subtract it out’. Unfortunately 860 SPS is not a multiple of 60Hz, so simple corrections tend to pass in & out of phase with the hum – eventually making the situation worse.  The misalignment means we’d need to do some serious math for the correction at 860SPS, so I’m probably not going to be implementing that filtering on an 8-bit processor. Alternatively I could go back to single shot sampling and use the processors internal timers to only request each new sample at some  whole number multiple of the 60 Hz mains cycles, like for example at 600 readings a second. The maximum possible would be 840, and you’d might want to add some jitter to that.

Next I tried a run from batteries only, with the nearby electrical devices all turned off. This reduced the mains hum by ~10x relative to the USB tethered operation:

RAW ADC output vs Sample #: 860sps, 16xpga, differential A0-A1, Battery powered logger

A dramatic improvement, with the ‘pre-event’ noise falling below +/- 10 counts. Most of our field deployments are in caves and this ADC looks like it has an acceptable noise floor for work in that kind of isolated environment . But the project also has a teaching component so I’d also like to use this ADC module in classroom settings.  Zooming in on that last graphs shows that working with tiny sensor signals will be challenging if we are anywhere inside a building – even if the resting state of the system looks OK:

Once the sensor is set in motion, even tiny interferences from the mains will reinforce each other before the system settles again. Even if I use internal timing control to synchronize the readings with a whole number multiple of the mains, it looks like I still won’t be able to use the ‘before’ data to fully correct the ‘after’ effects. This might be specific to way piezo sensor’s resonate, but I’ve got some homework to characterize the effect before we start building a student lab with this module.

Looking in the bright side, even with a power hungry 1284p based logger, the current draw while capturing the pre-event readings averaged less than ~450 μA for the whole system.

The path forward:

The successor to the ADS1115 is the 24-bit ADS1219 which reads up to 1000 SPS (20 Effective Bits, PGA x4). It has integrated input buffers to allow measurement of high impedance inputs & separate inputs for analog vref (true ratiometric!) and digital power/ground. This gives you more options to mitigate power supply noise, which as we’ve seen can be important for small signals. It also offers some built in 50-Hz and 60-Hz rejection, but only at slow sample rates. The ADS1115 is a delta-sigma converter so it continuously samples its inputs (oversampling @250kHz internally) which causes a transfer of charge. From the outside, this appears as a resistance which depends on the sampling rate and depends on the gain of the input stage. Higher gain for more sensitivity yields lower effective input resistance which adds in parallel to the resistance of your sensor circuit. So if you were reading the output of a voltage divider (equivalent) the ADS1115 itself would change the result. So input buffers on the ADS1219 are a welcome addition.

The low input impedance of the ADS1115 can prevent you from using the higher gain settings in differential mode  unless you add an opamp/buffer to prevent the ADC from putting to much drain on the sensors output. This is really what separates the ADS from ‘Instrumentation quality ‘ components which generally have much higher input impedances.

There are other 24-bit options in the hobbyist market like the HX711 (24-bit, PGA x32,64,128 – but only x32 on the 2nd channel? ) that is commonly sold with load cells, and I’ve seen it mentioned that the SPI HX711 works with libraries written for the ADS123x series. The ADS1232  (24 bit, fixed x128 gain) might be a easier option for dedicated bridge sensors, and they can be found on eBay for ~$7. One advantage of the ADS123x over the HX711 is that they have a switch that can shut off current to the sensor bridge when the ADC is in Standby or PowerDown mode. Of course then you have the problem that load cells take some time to warm up when power is applied, often taking several minutes to stabilize.   You occasionally see seismometer projects using the 32-bit ADS1262, which has a sensitivity >1000x better than the 1115, but with a fairly slow sample rate.

This circuit from Gadget Reboot shows one method of obtaining programmable gain control using an X9C digital potentiometer in the opamp feedback loop. See: Part1 & Part2    The DS3502 gives you an I2C bus version with the same 10k range, though I have no idea what the long term stability of these digital pots is. And 5% tolerance is a bit grim.

But this little experiment has me wondering if for signals in the 1mV range it might be better to spend more effort amplifying rather than moving to higher resolution ADCs. If the real issues are going to be noise and drift, then those might be easier to deal with if the level is boosted first. Microphone preamps can be made from a single 2N3904 transistor and placed in front of a (200x) LM386 modules for less than 50¢ though I suspect there might be lots of distortion. A general purpose (100x) LM358 might do the job on its own, or a (1000x) INA333 or AD623 modules (with the trimpot) which can usually be had for less than $6, as can the AD8221AR. The INA129-HT gets you to 10,000x for ~$9.  What I’d really like is an amplifier with the same simplicity of the ADS1115’s PGA. If anyone knows of a cheap I2C/register controlled opamp module in the hobby market price range, I’d love to hear about it.

Addendum 2020-05-24:   Interrupt latency with wake from sleep

I just watched an interesting video about the sleeping the ESP32 processors and was quite surprised to find out how long (150 µS) and how variable the hardware interrupt latency is on these expressive processors. This set me down the rabbit hole to find out what the latency is on the AVR processors. On a normally running processor you enter the ISR in 23 clock cycles, which is about 1.5µS @16MHz. However if you loop through POWER_DOWN there are extra things to consider like the fact that disabling the BOD in software (just before sleep) is going to add 60 µS to your wake-up time. You also have an ‘oscillator stabilization period’ of 16k CPU cycles with a  standard external oscillator. [see Sect.10.2 of the datasheet] The net result is that the Wake/Start-up time for a 8MHz Arduino is ~1.95ms.  AVR’s with 16MHz clocks like the one I used for this test should have a wake-up time of less than 1ms.  So I was actually cutting it close to combine full POWER_DOWN sleep & the ADS1115’s highest sampling rate. A 3.3v Pro Mini based build @8MHz would not have kept up unless I used SLEEP_MODE_IDLE to keep the main oscillator running which avoids that long stabilization delay.


Other projects using this ADC:

While I’m giving it a B rating for my current use case, this $1 ADC module is probably one of the best options once your signals get above above 10 mv.  The UNO/ADS1115 combo is a ready replacement for benchtop DAQs. Especially since you can add up to four of the modules on the same bus for a multi channel capability.  This build of InstESRE’s Pyranometer solders a PDB-C139 directly onto the ADS1115 module, and adds an analog TMP36 for temperature correction.

If you actually want mains signals in your data, then Open energy monitor has a project reading AC with the YHDC SCT-013-000 . Current sensors like that often make readings that are not referenced to ground so you have to use an ADC capable of differential readings. Although this project focuses getting the most out of cheap eBay modules, the ADS1115 repeatedly makes appearances alongside more pricey sensors like this DIY nitrox tester, and this rather impressive Air Quality Index (AQI) monitor from Ryan Kinnett; Those low power modules from Spec-Sensor look very interesting…

Building an ATmega 1284p based Data Logger

In this tutorial, a logger is built using a 3.3v Moteino MEGA with a 1284p CPU @ 16Mhz, w 4K eeprom,16K SRAM for variables & 128K program space. Considerably more than the 328’s 1K eeprom, 2K ram & 32K progmem. Also has a spare serial port for GPS/NEMA sensors.

In the 2018 paper we tried to convey that it doesn’t matter which processor you use with our system as long as it’s supported by the Arduino IDE. The ATmega family includes several CPUs more capable than the humble 328p in the Pro Mini / UNO. In fact, some have suggested that the 1284 would have been a better choice right from the start, with full code compatibility once you account for the different port / pin mapping.  We built several loggers around that chip early in the project, but at the time I was mostly just leaning on the extra memory to compensate for some fairly crude programming. As my skills improved, and I stopped using bloated sensor libraries, that problem went away.  So it’s been a while since I needed anything more than the 328p. But we have a new project spinning up this year that calls for burst sampling of high-bit ADC channels, and we’ll need more SRAM to juggle that data with some fairly large buffer-arrays.

Dave’s protoboard build

For those who build from scratch, Dave Cheney shows one approach to starting with the raw chip.  At the opposite end of the spectrum, Stroud Research Center’s Mayfly is a good combination if you’d prefer something ready-made.  But I still have a a few Moteino MEGAs lying around, and this project has always followed the ‘middle path’ to enlightenment.  So we’ll use one of those boards to demonstrate how easy it is to give our classroom logger a processor upgrade:

Add Screw Terminals to the Moteino:   (click images to enlarge)

Raspberry Pi expansion terminal boards are about $1 each, use 3mm pitch blocks from Nano kits. SPLIT Nano shields also work in a pinch, but you loose A4-A7 & D19-23

20 screw terminal ports per side, OR you could solder 2.54mm blocks directly to the MEGA. But they are not as robust for multiple reconnects during prototype experiments.

The Moteno MEGA from ‘just fits’ between the rails on the Raspberry Pi adapter. The ProMini XL fits on a Nano shield – but I like having all those extra I/O pins on the MEGA to play with.

Pins on the MEGA board need to be bent ‘slightly’ to align with the header holes on the Rpi shield.

10 / 3 Meg divider to track battery voltage

This is the basic version of the MEGA, but it’s also available with flash & radio transceiver options. LowPowerLabs also sells the Current Rangeran extremely useful tool for checking the sleep current on my loggers.   The shiny surface is due to the conformal coating we put on all our components. Clear nail polish also works once you’ve cleaned all the flux.

At the time of this writing there are a few 1284  boards on the market: the Moteino MEGA , the Megabrick, the Dwee, and the ultra compact Pro Mini XL. Other projects sporting the chip seem to pop up regularly, though few  seem to last very long.  This is a shame because 1284 has enough juice to do single-chip emulation of early 8-bit computers.  But perhaps the chip never really caught on in Arduino-land because few beginners need that much capability. Sustained interest from dedicated makers means that some version, or at least DIY instructions, will will be available as long as the chip is in production. If I had to, the terminal expansion board I’ve used here would let me build one of those from the raw chip & a few passives. The trick would be making templates for the boards.txt and pins_arduino.h, and finding a bootloader that matches the system clock.

Component Prep & Logger Assembly:

Black =GND,
Purple=MISO,
Brown=CLocK,
Orange=MOSI,
Grey=CSelect,
Red=3v3

Foam tape holds the  Dupont jumpers together & provides accidental contact protection on the header pins. 3.3v system lets you connect the SD card directly

Place the SD module to one side, leaving room for wire pass-through under MEGA Board. Note:a 10k pullup on the CLocK line was removed because mode0 sleeps low

Route all but the GND wire  under the main board

Score the insulation at ~15mm, and ROLL THE INSULATION between your fingers to TWIST the thin 30AWG strands together.

Add a 5mm ‘hook’ to provide more wire under the screw terminal contacts

SD card connections:
Grey= (CS) -> D4,
Orange= (MOSI) ->  D5,
Purple= (MISO) -> D6,
Brown= (CLK) ->  D7,
Vcc 3.3v

SD power is controlled by switching the GND line with a TN0702 logic level mosfet on D0 -> After <- SPI peripheral is disabled & all SPI bus lines are pulled up.


Diffused common cathode RGB w GND pin bent to identify. No limit resistor is needed if you use INPUT_PULLUP to light each color channel.

Any 4 unused pins would work for the  indicator.

We add NTC thermistors to all of our builds & read them with the Input Capture unit on D14.


Attach the GND wires before putting the MEGA into the Plano 3440 stowaway box being use as a housing.

Here using 3xAA to supply the MCP1700 reg. on the MEGA. For unregulated builds, I use 2x Lithium AAs with flat discharge curves.

Blk(GND), Red(3.3v), White(SDA), Yellow(SCL), Blue(SQW)  with Dupont pin headers added to the cascade port. 32K is not used as our power-mod disables that output.

The DS3231 Vcc pin is clipped to force battery power & 1N1418 isolates the coin-cell (see end of the RTC post for details on this power-saving modification)

SCL=>D16 (yellow), SDA=>D17 (white), &
SQW =>D10 = Int0 (blue)

170 tie point breadboard completes assembly. I2C bus is tapped from the RTC modules 4-pin cascade port.

For comparison, here’s a regulated Pro-Mini based build from 2019 . In 2020 we switched the 328p builds to 2xAA with no regulator.

The Moteino MEGA also makes Aref available (purple). Setting that to the internal1.1v bandgap gives you a reference voltage with thermal stability similar to a T431 provided you leave the ADC running long enough to stabilize the cap on aref & account for the internal resistance.

Now all I have is a bit of code tweaking to change the I/O in the codebase so those commands match the Moteino’s pinmap.

To complete the trim on this prototype I’ve added a 16-Bit ADS1115 (I’ll be giving that ADC a serious workout soon & will post any interesting results). Pinning the add-on module vertically preserves space on that tiny breadboard. With the ADS I won’t be using the internal ADC for much other than battery tracking. However analog pins will safely tolerate mid-range voltages which cause serious leakage problems on normal digital I/O pins. This lets you use a resistor bridge for scaled ranging techniques.

With all that extra memory to play with I’ll finally get to try some graphing libraries with that OLED – a luxury I can’t usually afford with ProMini based builds (though tiny plotter works in a pinch). And rumor has it that you can bit-bang I2C on ‘any’ GPIO pins, driving SSD1306 displays up to 10 frames per second. We have plenty of I/O lines to spare now for those experiments.

All of Atmels ‘-P’ variants have low power modes, and the logger shown here sleeps below 20μA (without the OLED, which draws ~25uA while sleeping) – that’s the about the same as I usually get with the 328p based units.  The 1284 draws more runtime current (~17mA), but you can reduce that considerably by throttling the system with a prescaler.  If you then accelerate the I2C bus by the same factor with TWBR, your sensors are  none the wiser.  In fact I’ve had no problem polling the 1115  with the system clock brought all the way down to 62.5 Khz with clock_prescale_set(clock_div_256); 

I guess the last thing on my list is a name for this beast. I had been thinking of calling it the ‘MEGA pearl’, but a quick google search convinced me otherwise. So I’m open to suggestions.

Addendum 2020-05-12:

There are also 2650 (not-P) based options between $10-$20. The board shown above has double rows, so you’re stuck using straight pin headers unless you put 0.1” terminal blocks both above AND below. Plenty of ports there for hexapods, gigantic LED displays, musical instruments, or perhaps a game of chess. It is somewhat hard to find these boards at 3.3v 8mhz.

Well that didn’t take long: a few have already pointed out that I missed the Microduino Core + in the ‘currently available’ list. I’m sure there’s more so I’ll add them if I hear about others with a physical footprint that’s small enough to work as a drop-in replacement with the student build. I skipped the 644p in the preamble, but it’s another good low-power option if you are looking for more program memory.  The 1284 is pin compatible with the 644, ATmega16, ATmega32 and probably a lot more.

Now that I’m playing with the 1284 again, I’ll also post any interesting projects I come across using these more powerful processors, such as this acoustic impulse marker or this body fat analyzer.


Addendum 2020-05-21:   Using the ADS1115 in Continuous Mode for Burst Sampling

As promised, here’s a first look at that ADS1115 ADC module.  For day to day tasks, it’s already something of a work-horse for Makers. But I wanted to push it out to the max settings to see if it’s ready for some typical research level applications. The answer is a tentative yes, but only at the fastest 860 sample per second speed. And with small signals EMI is more of a problem than the limitations of the ADC itself. I’m sure that’s not news to the analog hardware hackers out there, but I’m kind of a digital kid who’s still learning as I go along.

DIY Data Logger Housing from PVC parts (2020 update)

Basic concept: two table leg caps held together with 3″ 1/4-20 bolts & 332 EPDM o-ring. Internal length is 2x3cm for the caps + about 5mm for each o-ring. SS bolts work fine dry, but we use nylon in salt water due to corrosion; tightening the bolts enough that the o-rings will expand to compensate for nylons 2-3% length expansion when hydrated. PVC is another good bolt material option if you deploy in harsh environments.

We’ve been building our underwater housings from 2″ Formufit Table Screw Caps since 2015. Those housings have proven robust on multi year deployments to 50m. While that’s a respectable record for DIY kit, we probably over-shot the mark for the kind of surface & shallow water environments that typical logger builders are aiming for.

The additional RTC & SD power control steps that we’ve added to the basic ‘logger stack’ since 2017 are now bringing typical sleep currents below 25μA.  So the extra batteries our original ‘long-tube’ design can accommodate are rarely needed. (described in Fig. A1 ‘Exploded view’ at the end of the Sensors paperIn fact, pressure sensors often expire before power runs out on even a single set of 2xAA lithium cells.

This raises the possibility of reducing the overall size of the housing, while addressing the problem that some were having drilling out the slip ring in that design. Any time I can reduce the amount of solvent welding is an improvement, as those chemicals are nasty:
(click to enlarge)

Basic components of the  smaller 2020 housing cost about $10. O-rings shown  are 332 3/16″width 2 3/8″ID x 2 3/4″OD EPDM (or other compound )

Double sided tape attaches a 2xAA battery pack to the logger stack from 2017 ( w MIC5205 reg. removed, unit runs on 2x Lithium AA batteries)

The o-ring backer tube does not need to be solvent welded. Cut ~5cm for 1-ring build, & 5.5cm for a 2-ring. Leaving ~1.5cm head-space for wires in the top cap.

The logger stack fits snugly into the 5.5cm backer tube with room for a 2 gram desiccant pack down the side.

The screw-terminal board is only 5.5cm long, but the 2x AA battery stack is just under 6cm long.  With shorter AAA cells you can use only one o-ring.

With several 4-pin Deans micro-plug breakouts & AA batteries things get a bit tight with one o-ring. So I add a second o-ring for more interior space.

Sand away any logos or casting sprues on the plugs & clamp the pass-through fitting to the upper cap for at least 4 hours to make sure the solvent weld is really solid. (I usually leave them overnight) Then wet-sand the large O-ring seat to about 800 grit.  Sensor connections are threaded 1/2″ NPT, but I use a slip fit for the indicator LED, which gets potted in clear Loctite E30-CL epoxy w silica desiccant beads as filler. Most clear epoxies will yellow over time with salt water exposure, so for optical sensors or display screens I usually add an acrylic disk at the upper surface.

The only real challenge in this build is solvent welding the pass through ports. In the 2017 build video we describe connectors with pigtails epoxied to the housing.  But you don’t necessarily need that level of hardening for shallow / surface deployments. The potted sensor connections shown in the video (& our connectors tutorial) can be threaded directly to the logger body via 1/2 threaded NTP male plugs. 

Note: Position the NPT risers on the caps directly opposite the bolt struts, and as near to the edges of the cap as you can so that there is enough separation distance to spin the lock down nuts on your sensor dongles. In the photos below I had the pass-through in line with the struts, but with long bolts this may limit your finger room when tightening the sensor cable swivel nuts. These direct-to-housing connections do make the unit somewhat more vulnerable to failures at the cone washer, or cuts in the PUR insulating jacket of the sensor dongle.

Threaded bulkhead pass-throughs get drilled out with a 1/2″ bit. Alignment with bolt struts shown here is suboptimal.

This closeup shows a slight gap near the center – I could have done a better job sanding the base of the NPT to make it completely flat before gluing & clamping!

the pass through style sensor cap mates to the the lower half of the housing. We’ve always used our o-rings “dry” on these pvc housings.

I describe the creation of the sensor dongles with pex swivel connectors in the 2017 build video series.

Dongle wires need to be at least 6cm long to pass completely through the cap.

“2-Cap” housing: Aim for 5 to 15% o-ring compression but stop if there is too much bending in the PVC struts.

It’s also worth noting that there are situations where it’s a good idea to have another connector to break the line between the sensor and the logger. (shown in 2017)  We often mount rain gauges on top of buildings with 10-20m of cable – so we aren’t going to haul the whole thing in just to service the logger. But on-hull connections like the ones shown with this new housing necessarily open the body cavity to moisture when you disconnect a sensor, and nothing makes a tropical rainstorm more likely to occur during fieldwork than disconnecting the loggers that were supposed to be measuring rainfall.

With a double o-ring and additional seal(s) in the cap, we probably won’t be deploying this new design past ~10m. Given how quickly they can be made, this short body will be a standard for the next few years; perhaps by then those fancy resin printers will be cheap enough for regular DIY builders to start using them – at least for shallow water work.  For now we’ll continue with the long body style for deeper deployments or remote locations that we might not get to again for a long time. The second o-ring is not really necessary if you make a nice tight stack when you assemble the logger.

In general I’d say these ‘plumbing part’ housings reach their long term deployment limit at about ~60m because the the flat end caps starts blowing noticeably at that depth. That overlaps nicely with the limit of standard sport diving, but if your research needs more depth it’s worth looking into the aluminum body tubes/endcaps becoming available in the ROV market. As an example:  Blue robotics makes some interesting enclosures if you need clear acrylic endcaps for camera based work.

(UPDATE: the double o-ring shown in the photo above was required when using 3.5″ bolts. That was a mistake as they tended to extrude easily.  Using shorter 3″ bolts lets you go with only a single o-ring which is gives you a solid seal with no accidental extrusions.)

Addendum 2023-05-25

We needed a way to see how far we could take the new falcon tube loggers and water filter housings are a good solution as the domestic water pressure range of 40-80psi overlaps nicely with sport diving depths. The internal clearance of the filter housing we used is slightly larger than 4.5″ x 9.5″ so could accommodate these older PVC style housings as well:
https://thecavepearlproject.org/2023/05/24/a-diy-pressure-chamber-to-test-housings/

A household water filters make a good low-range pressure chamber.

Single Diode Temperature Sensor with Arduino ICU (& reverse-bias leakage)

Our LED sensor experiments lead to an interesting observation: When these ‘light-sensing’ loggers are left running overnight they still produce readings because reverse-bias ‘leakage-current’ eventually triggers the Interrupt Capture Unit (ICU) – in the absence of any light. The speed of this self-discharge depends on the ambient temperature. If you cover an rgb LED with black heat shrink, the different color channels have different rates of thermal decay:

Temp (Celsius) vs ‘Covered’ LED reverse-bias discharge time (Seconds) , Red, Blue & Green channels, generic rgb LED.  The LED was encapsulated in black heat shrink tubing and was connected directly to the IO pins with no limit resistor. LED’s take a very long time to discharge compared to other diodes, so at those time scales you can capture the data with the non-ICU based timing method of simply reading the high/low pin state in a loop. We use that simpler method in the 2019 classroom logger starter code on Github.

Both voltage and temperature affect reverse current, so these measurements must start from from a stable, regulated voltage.  Increasing the temperature by almost 20°C reduced the time to 20% of the low-temp value. The green channel appears to be more resistant to leakage which is surprising given that reverse bias currents are usually rated at ~1 µA for RY and ~10 µA for BGW colors. So perhaps this result says more about the volume & surface area of this particular unit than it does about LED color chemistry.

Even if I sleep the processor to save power, multi-minute readings would interfere with the other things we are recording on the Cave Pearl loggers.  However, this LED-based approach has interesting applications where space is limited and temps fall within a warmer range. The idea also has a lot of potential in situations that require high levels of sensitivity, although there aren’t many of those that can wait such a long time for readings.

Checking if I could use the technique with other types of diodes led to this jeelabs post where he compares the reverse bias leakage in three common diodes at 5V:

1N4004 – a high power diode: = 1.3 nA
1N4148 – a low power diode: = 3.4 nA
BAT34 – a Schottky diode:  = 50 nA

He also had the realization that “the reverse current could even be used as a temperature sensor.”  Small diodes have internal capacitance of a few pico-farads, so 5-50 nA will discharge them considerably faster than the LED channels I was using. In fact, reverse leakage increases so much with Schottky diodes it can cause a thermal instability issues which limit their useful reverse voltage to well below their max rating.  Germanium Diodes are even more susceptible.

Add black heat-shrink around  diodes with clear encapsulation (like the one shown here) or they will also be affected by light levels in the local environment.

It’s worth noting that most diode based temperature sensors use the change in forward voltage  because that relationship is linear, with about 2mV less voltage drop for every degree increase of temperature.  But chasing a few milli-volts with Arduino’s 10-bit ADC only allows a precision of ±1°C unless you add amplification, or some other trick.
By comparison, leakage current can be expected to double with every 10°C increase in temperature, making higher resolutions possible with the same hardware. The trade off is using a non-linear relationship which produces variable resolution over the sensing range. And since leakage is also a byproduct of manufacturing variations you need to calibrate each diode individually. That’s a show-stopper in production environments where that time costs more than the whole device, but not so much for DIY projects which need to run-test their build for a few days anyway. We don’t usually send a logger into the field until it’s had several weeks of stable operation.

Testing a 1n5819 Schottky Diode:

Here I’m timing the leakage-discharge with Timer1 clock ticks from an 8mHz 3.3v ProMini:

Temperature (°C) vs 1n5819 Shottky Reverse-bias Leakage Discharge Time (8 mHz clock cycles)  Diode connected between D7 & ICU on D8. Blue dots are Excel’s trend-line. That fit was better than I was expecting.

The Schottky discharges very quickly at room temperatures, with raw Timer1 counts of about 1300 at room temperature ( ~0.16 milliseconds) and about 100 counts of variation /°C.  Counts increase as temperature falls to ~5800 ( ~0.7 ms) at 6°C, with a delta of 580 counts per degree. The curve flattens out at the lower limit of this test with raw counts about 62,000 ( ~7.7 ms) at -15°C, and a delta of 7000 counts/degree.  

The timing jitter on these ICU readings ranges between 10-20 counts depending on the board  (even with 4x noise reduction enabled) and this is a significant source of error when you only have a per-degree delta of 100 counts.  You can over-sample the Schottky to compensate, and testing showed that 256x OS readings produced results that looked very comparable to 1n1418 diodes. (although some authorities say that timing-jitter may be resistant to this smoothing technique.)  Even with oversampling, these short discharge times could become too brief to even count with an 8mhz Promini at temps above 50°C.  However measuring cold temperatures can sometimes be more challenging than warm ones, and for those applications a fast discharging diode like a Schottky might be preferred. With communications overhead, it’s not unusual for an I2C sensor reading to take 1-2ms, so a Schottky might also be better for low power systems trying to minimize CPU runtime.

Testing a 1n4148 Signal Diode:

Temperature (°C) vs 1n4148 Reverse-bias Leakage Discharge Time (8 mHz clock cycles) Diode connected between D7 & ICU on D8. Diode wrapped in black heat shrink tubing. Blue dots are Excel trend-line fit.

The 1n1418 discharges more slowly, with raw Timer1 counts of about 36,000 at room temperatures (~5 msec.), and about 2000 counts of variation/degree at 25°C.  Raw counts increase to ~158000 (~20 ms) at 6°C, with a delta of ~17000 counts per degree and the lower limit of this test saw raw counts 1.3 million (166 ms) at -15°C, and a delta of 140,000 counts/degree.

The 1n1418 is better sensor overall because it won’t drop below the Arduino’s timing capability at natural environment temperatures, and it’s discharge takes long enough that jitter becomes an insignificant source of error. Even in colder environments, 166ms of SLEEP_MODE_IDLE (which leaves Timer 1 running for the clock cycle count) only burns about 0.16 milliamp-seconds per reading on a Promini. That’s not going to break our power budget.

Calibration:

Its worth noting again that you must use a regulated system. Ideally, shifting supply voltage causes a corresponding change to the Schmitt trigger points on the I/O pins. That compensates to some extent, however batteries have significant thermal mass and this causes serious hysteresis problems when sensing temperature.

To calibrate my diodes, I covered them with black heat shrink tubing and taped them in physical contact with an si7051 sensor. Then I placed the logger into a rice filled double ceramic pot ( to add thermal mass) and moved the pot around the kitchen, from the radiators to the refrigerator & freezer. You want stable periods that let the ref & diode sensors equalize, using an average of 20 readings to smooth compressor wobble at the lower end, and those crest/peaks at higher temperatures.

Typical SI7051 (±0.1°C) reference temperature run for calibrating the 1n1418 diode. Boxes indicate plateaus chosen for the calibration data points & coverage areas of closeup graphs shown in the ‘sets’ comparison below.

Excel trend-lines got reasonably close to the response from the Shottky & 1n1418; perhaps needing only one more term for a better fit.  Since thermistors are also semiconductor devices I wondered if those diode decays would generate workable S&H constants if I treat the raw Timer1 counts AS IF they were resistance values from an NTC:

Here I used 20 reading averages to compensate for the fact that the diode is higher resolution than the Si7051 reference, and the long-integration 1n1418  readings have considerably less jitter than the IC sensor.

Then you can convert the discharge time to temperature with the Steinhart-Hart equation:

#define COEFF_A   2.0007E-03    // Coefficient from SRS online calculator
#define COEFF_B   1.3166E-04
#define COEFF_C   3.5441E-09

float Temp = log(RawDiodeDischargeTime);  // note that Log(x) on Arduino is actually LN(x)!
Temp = COEFF_A + (COEFF_B * Temp) + (COEFF_C*(Temp*Temp*Temp));
Temp = (1 /Temp) -273.15;       // -273 converts  Kelvin to Celsius
(Note: I usually save raw readings on the loggers & convert them later in Excel. I’ve been burned several times by loss of significant figures during calculation on the 8-bit 328P processor)

That equation has a quoted accuracy of about ±0.1°C over a 100 degree range when used for a thermistor, but does this hold with a diode sensor?  Yes  – but over a smaller 40 degree range:  (Click Image to Enlarge)

Comparison of si7051 reference temps (blue) (°C) vs 1n1418 based S&H calculations (red) Two examples shown with different ‘center’ points (21°C on the left & 5°C on right) used to generate the three equation constants.

I choose these sets to show calculation errors creeping in as you move farther from the points used to generate the constants. The calculated temperatures in this example drift ~0.07°C from the reference at a distance of ~15°C from the center point.  A tighter set with calibration points at 5, 21, & 36°C produces a near-perfect fit inside that range, with the trade-off  that temps down at -14°C then show an increased deviation >0.1°C.  Overall, it’s about 30% more error than I’d expect to see when calibrating a cheap 10K thermistors with the same points. Given that our Si7051 reference thermometer has a rated accuracy of  ±0.13 °C (datasheet pg 7), I think the best we can achieve for this diode based method is ~±0.2 °C at typical cave temperatures.

So max-middle-min gives you about 40 degrees of usable range and you want at least one of your cal. points at the area of interest.  That’s pretty good considering we are applying the thermistor equation to a different physical system. I will experiment with solver to see if models with more parameters provide a better fit, but this is already is good enough for most of our logger deployments. 

Figure 14-1 I/O Pin Equivalent Schematic from the 328p datasheet. Those protection diodes can also cause problems when de-powering voltage dividers.

My gut feeling is that the re-purposed equation  would work over a wider range if this was a single diode system. However AVR inputs are also connected to two protection diodes and a pull-up MOSFET. Each of these is subject to its own reverse bias leakage to some extent, with the upper protection diode acting in direct opposition to the discharge of the ‘sensor’ diode.  In fact, you can simply run the ICU timing code with nothing at all connected to the D8 pin, and it will still give you a temperature based reading. That makes this the second ‘no parts temperature sensor’  method I’ve discovered for Arduino but, like LED’s, these diodes are low leakage; taking five seconds for a read at 20°C, and five minutes for a reading down at -14°C.  Unless you change the prescaler, the raw numbers could exceed the range of easy calculation on a 328, and show significant hysteresis due to the mass of the chip & Promini board it’s attached to.

The implication here is that temperature sensing via this reverse bias decay method has a sweet spot somewhere between the too-rapid response of a Shottky diode (which approaches the counting limits of an 8MHz clock) and interference from the other stuff connected to Arduino I/O pins. 1n1418’s work well, but I’m sure there are other diodes out there that could do a better job. I have yet to find any good data on the long term stability of reverse bias leakage but we are not stressing the part by exceeding it’s reverse voltage rating, or running enough current to cause much self-heating.  So I suspect that diode leakage is at least as stable as thermistor response over time. There’s a lot of further experimentation to do here, and given the tighter manufacturing spec, I’m curious to see if the method works with diode connected transistors which could make interchangeable temperature sensors possible.

I should also mention that some ‘better quality’ Arduino boards have temperature compensation embedded in their system oscillator. This is a bad thing for this ICU timing method because it introduces a sharp discontinuity in the clock speed when the comp. circuitry kicks in. The S&H constants can’t absorb that like the normal ‘thermal response’ of a cheap oscillator, so the method works better on some boards than others. Another potential problem is moisture accumulating on surfaces -which could provide an alternate current path to discharge the diode. So as with our LED light sensing, desiccants are required inside the logger housing.

the CODE:

D7 is simply acting as a convenient GND connection.

I’ve left this till last, because it’s essentially just a tweaked version of the ICU timing method I posted for reading thermistors. With the diode discharge you triggering on fall instead of rise, and you don’t have to read a reference resistor because we are treating the decay time as a resistance.   The diode’s tiny internal capacitance charges through the INPUT_PULLUP resistor in a few nanoseconds, and there’s no need to discharge afterward.

(Note: This code is modified from the ICU capacitor reading example by Nick Gammon)

#include <avr/power.h>                        //  for peripherals shutdown
#include <avr/sleep.h>                          //  to sleep the processor
volatile boolean triggered;
volatile uint16_t timer1CounterValue;
volatile uint16_t overflowCount;


ISR (TIMER1_OVF_vect) {  // triggers when T1 overflows: every 65536 system clock ticks
overflowCount++;
}


ISR (TIMER1_CAPT_vect) {     // transfers Timer1 when D8 reaches the threshold
if (triggered){ return; }  // multiple trigger error catch
timer1CounterValue = ICR1;    // Input Capture register (datasheet p117)
triggered = true;
if ((TIFR1 & bit (TOV1)) && timer1CounterValue < 256){    // 256 is an arbitrary low value
overflowCount++;    // if “just missed” an overflow
}
bitClear(TIMSK1,TOIE1);   // disable interrupts on Timer 1 overflow
bitClear(TIMSK1,ICIE1);     // disable input capture
}


void prepareForInterrupts() {
noInterrupts ();
triggered = false;                   // reset for the  do{ … }while(!triggered);  loop
TCCR1A = 0;     // set entire TCCR1A register to 0
TCCR1B = 0;     // same for TCCR1B
TIFR1 = bit (ICF1) | bit (TOV1);   // clear flags so we don’t get a bogus interrupt
TCNT1 = 0;       // initialize counter value to 0
overflowCount = 0;        // reset overflow counter
bitSet(TCCR1B,CS10);     // set prescaler to 1x system clock (F_CPU)
bitSet(TIMSK1,TOIE1);    // interrupt on Timer 1 overflow
bitSet(TCCR1B,ICNC1);       // Input Capture Noise Canceler = 4x repeat b4 trigger
bitClear(TCCR1B,ICES1);       // Input Capture Edge Select ICES1: =0 for falling edge
// or use bitSet(TCCR1B,ICES1); to record rising edge
bitSet(TIMSK1,ICIE1);             // Enable input capture unit

TIFR1 = bit (ICF1) | bit (TOV1);   // clear flags again ( this may be unnecessary?)
interrupts ();
}


//========== READ DIODE connected between D7 —>|— D8 ICU ===========

digitalWrite(7,LOW); pinMode(7, OUTPUT);  // simply acting as GND
digitalWrite(8,LOW); pinMode(8,OUTPUT);
power_timer0_disable();    // otherwise Timer0 generates interrupts every 1us
power_timer1_enable();    // this whole method depends on timer1
bitSet(ACSR,ACD);    // Disable the analog comparator
//could disable other peripherals to save power during idle

digitalWrite(8,INPUT_PULLUP);    // charging the diode-capacitor (occurs VERY quickly)
prepareForInterrupts ();
noInterrupts ();
set_sleep_mode (SLEEP_MODE_IDLE);  // leaves Timer1 running
sleep_enable();
PORTB ^= B00000001;     // toggles OFF pull-up resistor on D8 (leaving pin in INPUT)
TCNT1 = 0;                          // re-initialize Timer1 counter

do{
interrupts ();
sleep_cpu ();  //sleep until D8 falls to the 33% threshold voltage
noInterrupts ();
}while(!triggered);  //trapped here till TIMER1_CAPT_vect sets triggered=true

uint32_t diodeDischargeTime= ((uint32_t)overflowCount*65535) + timer1CounterValue;
// change to uint64_t calculations when timing diodes that decay slowly

sleep_disable();
interrupts ();
power_timer1_disable();    // cleanup
power_timer0_enable();    //  needed for delay, micros, etc.


(Note: Integer arithmetic on the Arduino defaults to 16 bit & never promotes to higher bit calculations, unless you cast one of the numbers to a high-bit integer first. After casting the Arduino supports 64-bit “long long” int64_t & uint64_t integers for large number calculations but they do gobble up lots of program memory space – typically adding 1 to 3k to the compiled size. Also Arduino’s printing function can not handle 64 bit numbers, so you have to slice them into smaller pieces before using any .print functions
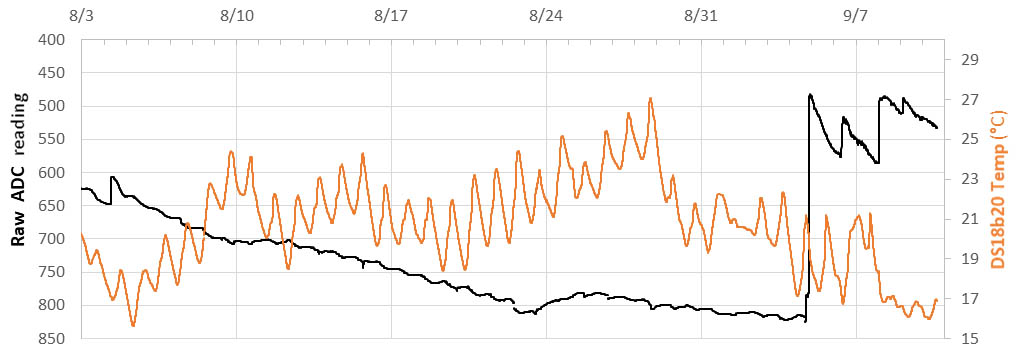
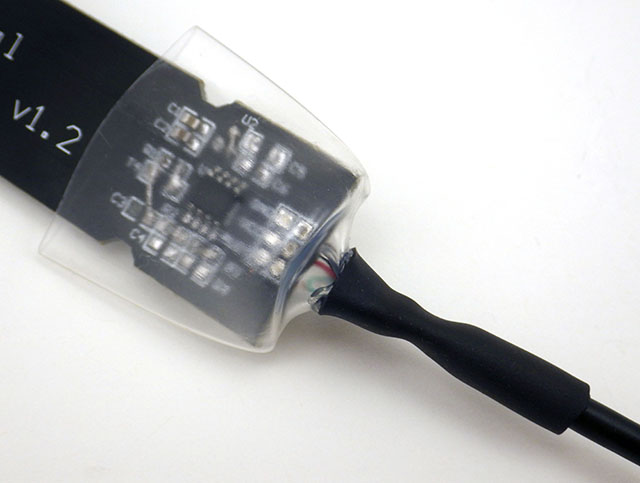
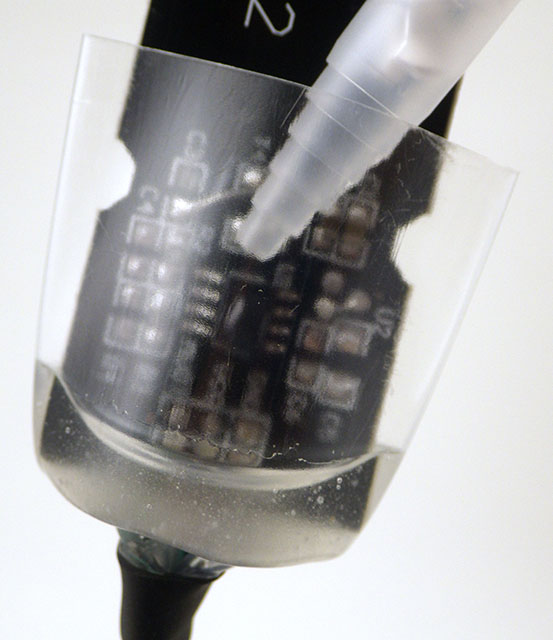
Addendum 2021-01-24        Don’t sleep with regular I/O pins.

I’ve been noodling around with other discharge timing methods and come across something  that’s relevant to using these methods on other digital pins. Here’s the schematic from the actual 328 datasheet, with a bit of highlighting added. The green path is PINx.  It’s always available to the databus through the synchronizer (except for in SLEEP mode?) The purple path is PORTx.   Whether or not it is connected to PINx depends on the state of DDRx (which is the yellow path.)
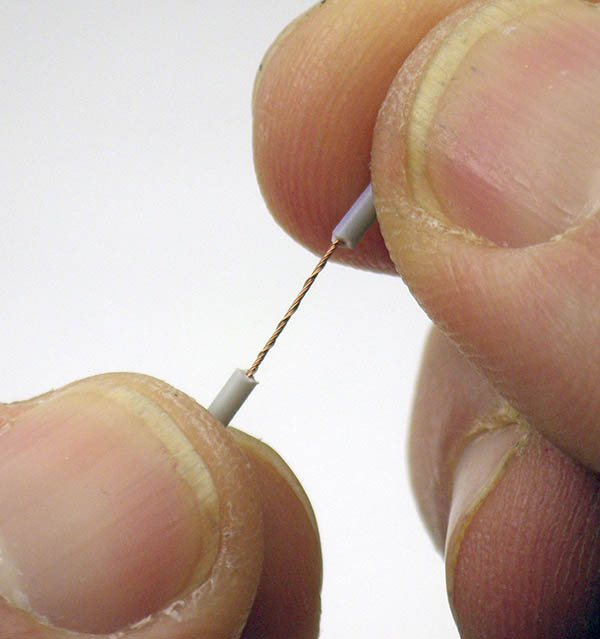
As shown in the figure of General Digital I/O, the digital input signal can be clamped to ground at the input of the Schmitt Trigger. The signal denoted SLEEP in the figure, is set by the MCU Sleep Controller in Power-down mode and Standby mode to avoid high power consumption if some input signals are left floating, or have an analog signal level close to VCC/2.

When sleeping, any GPIO that is not used an an interrupt input has its input buffer disconnected from the pin and in clamped LOW by the MOSFET.

Clearly D8 on the ICU must one of those ‘interrupt exceptions’ or the thermal discharge of the diode would have been grounded out by entering the sleep state.  If you use a similar method on regular IO pins you can’t sleep the processor in that central do-while loop.