A data logger is a device that records sensor information at regular intervals over a period of time so that information can be analyzed to understand phenomenon that are hard to observe directly. THIS PAGE is a consolidated set of links to the different Arduino-based logger tutorials that we’ve released over time, with some commentary to put them in context. (OR you can jump directly to the latest logger build instructions)
The hardware side of the original Arduino platform is a circuit board built around an Atmel AVR microcontroller with connections broken out so you can physically attach wires to it more easily. It’s really the integrated development environment (called the IDE) that makes programming the Arduino so easy for beginners. The IDE handles a lot of messy details when converting code you’ve written to run on that little chip. Because those low level details are taken care of, you can run essentially the same program on many different flavors of Arduino hardware – even if they look different different physically. That “hardware abstraction layer” isn’t meant to be the pinnacle of efficiency, but rather to make it as easy to program as possible. That’s what people new to hardware coding love about Arduino and, that’s what people who know a lot about direct chip programming hate about it.
Most people who are just discovering Arduino start with the UNO. It’s a relatively large board, and robust enough for the physical handling you see in a classroom situation. We have posted several tutorials for the UNO with the hope that that teachers will use this material as the basis for their own beginner-level lessons. UNO’s don’t run very long on batteries, but they are a fantastic platform for learning programming and electronics.
- Arduino UNO Data Logger for Beginners
- Adding Sensors (& Modules) to an Arduino Data Logger
- Display ‘Live’ Sensor Data from an Arduino with the Serial Plotter
- Simple Arduino Logger code w Sleep & RTC wake-up
- Build your own Arduino Starter Kits for the Classroom
- Ideas for your Arduino STEM Curriculum
- Waterproofing your Electronics Project
The plotter tutorial is probably the most important one in the set for teachers. The serial plotter built into the IDE makes it possible to view sensor output in real time simply by adding one print statement to the code. This generates a graph live on screen by sending the ‘printed’ numbers over the USB and the graph axes are generated ‘automatically’. Nothing I’ve used before lets you do classroom demos so easily.
 The drawback of larger format Arduinos is that they are built for ease of use, rather than being optimized for low power operation. Dataloggers often have to run for several years on one set of batteries so we use smaller Pro-Mini style boards that are more power efficient. There are some differences between Arduino models in terms of pin locations and operating voltage, but once you have an UNO-based logger recording sensor data, you should be able to transfer that code into to a Pro-Mini based build with few (if any) changes to the programming. This gives you a development path, where your prototypes get smaller and more energy efficient as your skills improve, with some people reaching the point of using raw processors from the AVR family to create custom sensors. Or if your code grows large enough to exceed the capabilities of a Pro Mini, you can switch to a board with a larger 1284P processor.
Our first Pro Mini based loggers went into service in 2014. These were built with a generic wiring plan that used inexpensive components from the Arduino hobbyist market:
 In 2018 we published our first academic paper: A Flexible Arduino-Based Logging Platform for Long-Term Monitoring in Harsh Environments This open-access publication is free to download, and describes real world deployments that show how modifying both the logger assembly and the housing enable us to monitor very different aspects of groundwater flow with the same type of sensor. The “modules & jumper wires” approach makes it easy to change components to create these unique prototypes; tailored to different research questions. Extensive code libraries published by the Arduino community simplify the addition of sensors and other groups are now taking advantage of this flexibility; extending the 3-module design with new housings & sensor configurations.

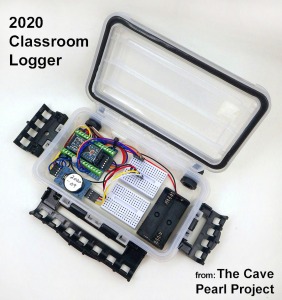
In 2020 we revised the Classroom Datalogger tutorial to make it easier for instructors facing the challenges of Covid-19.
In 2019: As part of our commitment to science education, we developed a simplified version of the logger which uses pre-made Dupont connectors to reduce the assembly time to about 1.5 hours. Dr. Beddow’s instrumentation class has been building 3-module loggers for several years now, and their feedback informed this new layout which enables a variety of student projects via the breadboard, while keeping within the time constraints of a typical lab schedule. The new logger program starting point provides a functional temperature & light level logger without adding any extra sensors. DIY loggers like this will soon become a standard part of the earth & environmental science curriculum, and we hope this project supports other STEM educators who want to add Arduino based experiments to their teaching portfolio.

In 2022: We developed an even simpler two-module logger by removing the SD card. Sensor data gets saved to the EEprom memory on the RTC module and the logger can run more than a year on a coin cell. Download & logger control is done through the serial monitor window in the IDE.
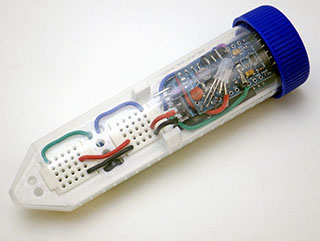
In 2023: We adapted that two module logger for use in the classroom by adding breadboards and a custom designed set of rails.  The whole assembly fits inside a standard 50mL centrifuge tube which is waterproof to several meters depth. This logger has been tested in Dr. Beddows Instrumentation classes where the students did experiments with light, temperature and pressure sensors. The LDR can be calibrated with a $1 BH1750, while the NTC thermistor can be calibrated using insulated lunch box containers. The code has been dramatically simplified to make it easier to add other sensors. This combination may well be as minimal as it is possible to go while still offering students the flexibility to develop their own final projects.
Sensor Tutorials:
There are many sensor tutorials the site, and we are constantly developing new methods for calibrating inexpensive sensors to research standards:
-
- Adding Sensors to Your Arduino Data Logger
- Waterproofing Your Electronics Project
- How to Configure I²C Sensors with Arduino
- How to increase the resolution of the ADC by Oversampling
- How to make ANALOG sensor readings on DIGITAL I/O pins
- Using the ADS1115 in Continuous Mode for Burst Sampling
- ‘No-Parts’ Temperature Measurements with Arduino
- Using a $1 DS3231 Real-time Clock Module
- Measuring EC ( electrical conductivity ) with Arduino
- Using an MS5803 high resolution pressure sensor
- How to calibrate a compass (and accelerometer)
- A practical method for Calibrating NTC Thermistors
- Calibrating DS18B20 1-Wire sensors
- Make a ‘Plant Health’ Sensor with two LEDs
- How to use a Single Diode as a Temp. Sensor with Arduino
- Enhance your Logger with an OLED & T233 Capacitive Touch Switch
- Adding two OLED displays to your Arduino logger
- Using a Capacitive Soil Moisture Sensor (v1.2)
- Insights from a Decade of Tipping Bucket Rain Gauge deployment
Advanced builds for underwater research:

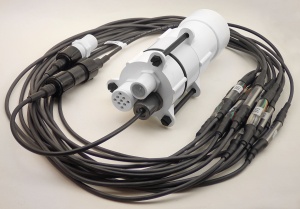
An underwater DS18b20 temperature sensor chain with 24 nodes and MS5803 pressure sensor. This build uses the 2″ PVC housing for deployments below 5m. DIY underwater connectors join interchangeable ‘sensor segments’ to each other and to the the logger body.
This project is somewhat unique in that we are simultaneously developing the system for use in educational and research settings. The field units get deployed in flooded cave systems for years at a time, and that required the development of an underwater housing with waterproof connectors so that sensors can be placed at the end of long cables. This housing is assembled from PVC plumbing parts and has has survived multi-year deployments below 20m in salt water. The core of logger is built from the same modules as the student version, but these are re-arranged to fit inside the 2″ pipe housing, and all the connections are soldered to make them more resilient to rough treatment on deployment dives. We’ve also been developing methods to add 5110 LCD & OLED display screens using the lowest possible amount of power & system memory.

The stacked screw terminal build gets mounted on an end-cap for deployment inside our 2″ underwater housing.
Student built 3-module loggers usually draw between 150-250 μA while sleeping between readings, but the lion’s share of that is for the SD card (70-140 μA) and the DS3231 RTC (90 μA) which is compounded by the poor efficiency of the default MIC5205 regulator. Using a mosfet to cut power to the SD card, and forcing the RTC module to run from the backup coin cell usually brings the 3-module core below 30 μA while it sleeps between readings. Removing the ProMini regulator and running from two Lithium AA batteries can bring that below 20 μA, but replacing the regulator with an MCP1702-3302E/TO is another reliable low-power option if your sensors require a stable supply voltage. Each optimization step adds a a bit more complexity to the logger, but these three modifications get you to multi-year deployments comparable to most commercial sensors – while still being something a you can build from off-the-shelf parts. Even with the plethora of cheap MCU options available these days, it’s still hard to beat a $2 Pro Mini clone for stand alone applications that need to handle hardware interrupts in real time. Chip based sensors from the hobbyist market rarely last more than 3-4 years outdoors, so sleep currents in the 20-30μA range (with sensors) mean that our field loggers can run their entire deployment lifetime on a single set of AA batteries. With the impact that used batteries have on our environment, that was an important goal for our project.

For surface and ‘shallow’ water sensors we use a shorter DIY housing with fewer parts & faster assembly. Sensor dongles are easily replaced if they fail via the threaded pass-through fittings.
Perhaps the most important thing to understand about building your own dataloggers is that although the parts can be had for less than $30, cost alone is not enough to justify the time you will spend on testing & sensor calibration. If you can buy a pre-made logger that does the job you need for less than $100, then that’s probably the way to go. A better reason to build your own loggers is to improve the quality of your data because you have complete control over the sampling/averaging methodology at the code level. Dynamically increasing the sampling rate in response to environmental conditions is easy to accomplish when you do the programming, but it’s a very expensive option – if it’s even available – in commercial sensors. It’s often necessary to create unique sensor(s) for the specific questions you are working on: we developed our tilt-flow sensors after discovering that none of the commercial sensors worked very well in coastal cave environments with shifting haloclines. This is a common problem in scientific research, and it continues to motivate our ongoing efforts to refine this system.
It’s also a lot of fun to build ‘things that do things’ because it requires the use of both your mind and your hands with reasonable skill. Environmental monitoring then lets you connect that effort to the real world in a way that is both useful and rewarding.


