
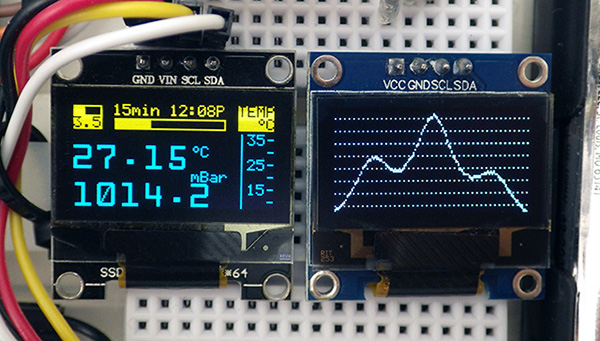
Two I2C 0.96″ OLED screens used simultaneously. Left is split Yellow: 128×16 pixels & Blue: 128×48 pixels while the right screen is mono-white. The CODE ON GITHUB drives each screen in different memory modes to simplify the functions and uses internal eeprom memory to store fonts/bitmaps.
Oceanographic instruments rarely have displays, because they don’t contribute much to profilers being lowered off the side of a boat on long cables. And most of our instruments spend months-to-years in underground darkness, far from any observer. But a few years ago we built a hand-held flow sensor that needed to provide operator feedback while the diver hunted for the peak discharge point of an underwater spring. That prototype was our first compelling use-case for a display screen, and we used cheap Nokia 5110 LCDs because they were large enough to see in murky water. While driver libraries were plentiful, I realized that Julian Ilett’s shift-out method could pull font maps from the Arduino’s internal eeprom rather than progmem. This let us add those SPI screens to a codebase that was already near the memory limits of a 328p.

Modifications done to the second display: The only thing you must do for dual screens is change the bus address. Here I’ve also removed the redundant I2C pullups (R6&R7, 4k7) and bridged out the 662k regulator which isn’t needed on a 3.3v system. These changes usually bring sleep-mode current on 0.96″ OLEDs to about 2μA per screen. (or ~5μA ea. with the 662k regulator left in place)
Now it’s time to work on the next gen, and the 0.96″ OLEDs that we initially ignored have dropped to ~$2.50 each. Popular graphic libraries for these displays (Adafruit, U8G2, etc) provide more options than a swiss army knife but require similarly prodigious system resources. Hackaday highlighted the work of David Johnson-Davies who’s been using these screens with ATtiny processors where such extravagant memory allocations aren’t possible. His Tiny Function Plotter leverages the ssd1306‘s vertical access mode to plot a graph with a remarkably simple function. These OLED screens support two bus addresses, and that set me to work combining that elegant grapher with my eeprom/fonts method for a two screen combo. Updating Iletts shiftout cascade to I2C would loose some of the memory benefit, but I was already embedding wire.h in the codebuild for other sensors. It’s worth noting that David also posted a full featured plotter for the 1106, but these tiny displays are already at the limits of legibility and I didn’t want to lose any of those precious pixels. Moving the axis labels to the other screen forced me to add some leading lines so the eye could ‘jump the gap’:
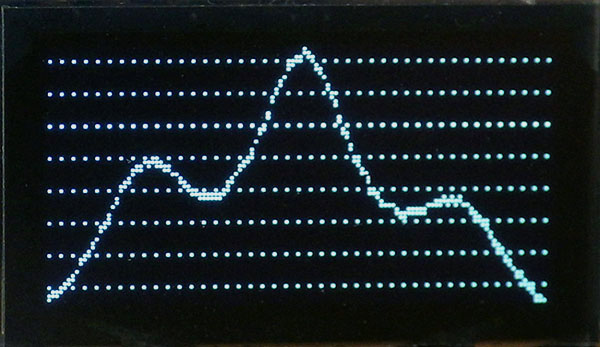 My eyes had trouble with single-pixel plots so I made the line 2-pixels thick. |
 Histogram seems the best underwater visibility mode. Dashed lead-lines toggle off |
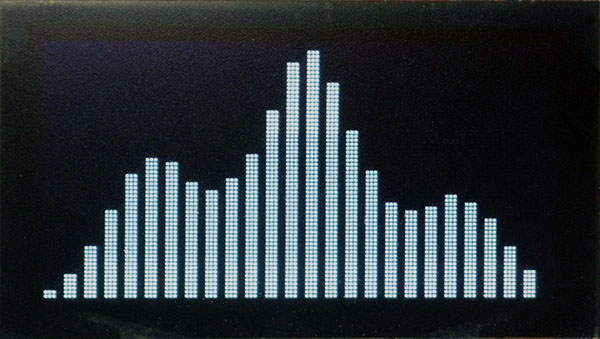 A little repetition produces a bar graph variant. |

The battery indicator at upper left uses the same function as the buffer memory progress bar in the center. Axis label dashes along the right hand side correspond to the lead lines on the next screen. My goal with this layout was ‘at-a-glance” readability. Horizontal addressing makes it easy to update these elements without refreshing the rest of the screen; so there is no frame buffer.
To drive these screens without a library it helps to understand the controllers different memory addressing modes. There are plenty of good tutorials out there, but the gist is that you first specify a target area on screen by sending (8-pixel high) row and (single pixel wide) column ranges. These define upper left & lower right corners of a modifiable region and the ssd1306 plugs any subsequent data that gets sent into the pixels between those corner points using a horizontal or vertical flow pattern. If you send more data than the square can hold, it jumps back to the upper left starting point and continues to fill over top the previous data. In ALL memory modes: each received byte represents a vertical 8-pixel stripe of pixels , which is perfect for displaying small fonts defined in 6×8-bit blocks. For the taller characters I use a two-pass process that prints the top of the large numbers first, changes eeprom memory offset, and then does a second pass in the next row to create the bottoms of the characters. This is different from typical scaling approaches, but gives the option of creating a three-row (24 pixel high) font with basically the same method, and since the fonts are stored in eeprom there’s no real penalty for those extra bits.
In addition to text & graphs, I need a battery status indicator and some way to tell the operator when they have waited long enough to fill sampling buffers. In the first gen units I used LED pips, but similar to the way vertical addressing made the Tiny Function Plotter so clean, horizontal mode makes it very easy to generate single-row progress bars:
void ssd1306_HorizontalProgressBar
(int8_t row, int percentComplete, int barColumnMin, int barColumnMax) {
// Set boundary area for the progress bar
Wire.beginTransmission(ssd1306_address);
Wire.write(ssd1306_commandStream);
Wire.write(ssd1306_SET_ADDRESSING);
Wire.write(ssd1306_ADDRESSING_HORIZONTAL);
Wire.write(ssd1306_SET_PAGE_RANGE);
Wire.write(row); Wire.write(row); // page start / end are the same in this case
Wire.write(ssd1306_SET_COLUMN_RANGE);
Wire.write(barColumnMin); Wire.write(barColumnMax); // column start / end
Wire.endTransmission();
//determine column for the progress bar transition
int changePoint = ((percentComplete*(barColumnMax-barColumnMin))/100)
+barColumnMin;
//loop through the column range, sending a ‘full’ or ’empty’ byte pattern
for (int col = barColumnMin ; col < barColumnMax+1; col++) {
Wire.beginTransmission(ssd1306_address);
Wire.write(ssd1306_oneData); // send 1 data byte at a time to avoid wire.h limits
// full indicator = all but top pixel on, also using the ‘filled’ byte as end caps
if (col<changePoint || col<=barColumnMin || col>=barColumnMax)
{ Wire.write(0b11111110); }
else { Wire.write(0b10000010); } // empty indicator = edge pixels only
Wire.endTransmission();
}
}

I mount screens under epoxy & acrylic for field units but hot glue holds alignment just fine at the prototyping stage, and it can be undone later.
And just for the fun of it, I added a splash screen bitmap that’s only displayed at startup. Since the processors internal eeprom is already being used to store the font definitions, this 1024 byte graphic gets shuttled from progmem into the 4k EEprom on the RTC modules we use on our loggers. It’s important to note that I’ve wrapped the font & bitmap arrays, and the eeprom transfer steps, within a define at the start of the program:
#define runONCE_addData2EEproms
—progmem functions that only need to execute once —
#endif
Since data stored in eeprom is persistent, you can eliminate those functions (and the memory they require) from the compile by commenting-out that define after it’s been run. One thing to note is that the older AT24c32 eeprom on our RTC module is only rated to 100kHz, while bus coms to the OLED work well at 400kHz.
You can update the memory in these screens even if the display is sleeping. So a typical logger could send single line updates to the graph display over the course of a day. There’s a scrolling feature buried in the 1306 that would make this perpetual without any buffer variables on the main system. Color might make it possible to do this with three separate sensor streams, and the 1106 lets you read back from the screens memory, providing an interesting possibility for ancillary storage. However with Arduino migrating to newer mcu’s I think creative code tricks like that are more likely to emerge from ATtiny users in future. As a logger jockey, the first questions that comes to mind are: can I use these screens as the light source in some interesting sensor arrangement that leverages the way I could vary the output?
What’s the spectra of the output? Could they be calibrated? What’s the maximum switch rate?

Screens are quite readable through the clear 3440 Plano Stowaway boxes used for our classroom logger. (here I’ve hot glued them into place on the lid) Avoid taking new sensor readings while information is being displayed on the OLED screens because they ‘pulse’ power to the pixels (100ms default) when information is being displayed. Each screen shown here peaks at about 20 mA (this varies with the number of pixels lit) so you could be hitting the rail with a high frequency load of about 40mA with dual screens – which could cause noise in your readings unless you buffer with some beefy caps. Also note that the screens tiny solder connections are somewhat fragile, so avoid putting hot glue on the ribbon cable.
As a final comment, the code on github is just an exploration of concepts so it’s written with readability in mind rather than efficiency. It’s just a repository of functions that will be patched into other projects when needed, and as such it will change/grow over time as I explore other dual screen ideas. Kris Kasprzak has a slick looking oscilloscope example (+more here) , and Larry Banks BitBang library lets you drive as many I2C screens as you have the pins for – or you could try a multiplexer on the I2C bus. The TCA9548 I2C multiplexer lets you drive up to 8 OLED displays or connect several of those cheap Bme280 sensors to your build.
These OLEDs will only get larger and cheaper over time. (& it will be a while before we see that with e-paper) An important question for our project is: which screens hold up best when subjected to pressure at depth? This was a real problem with the Nokia LCDs.
Addendum 2021-04-05:
I finally took a closer look at the noise from those cheap SSD1306 OLED screens, and was surprised to find the usual [104] & [106] decoupling combo simply weren’t up to the task. So I had to go to a 1000uF Tantalum [108] to really make a dent in it. Contrast settings reduced the current spikes somewhat, but did not change the overall picture very much.
The following are before & after graph of a start sequence from one loggers that end with 8 seconds of the logger sleeping while the latest readings get displayed on screen:

This unit was running without a regulator on 2x Lithium AA’s , and I had noticed intermittently flakey coms when the screen pixels were on. A forum search reveal people complaining about ‘audible’ noise problems in music applications, and others finding that their screens charge pump was driving the pixels near the default I2C bus frequency of 100kHz. I’ve dozens of these things lying around, and will add more to this post if testing reveals anything else interesting. The cap. pulls about 1A at startup so I’m not even sure I could put one that large on a regulated ProMini without pushing the MIC5205 into over-current shutdown.
Addendum 2023-12-01: Mini OLED display only draws about half a milliamp!
Our 2-Module classroom data logger uses a 50mL falcon tube housing and is powered from a Cr2032. So we had to go hunting for much smaller displays. Mini 0.49″ OLEDs are an excellent low power option that sleeps below 10 µA and will run about two weeks on a coin cell at 15 minute intervals, depending on contrast, pixel coverage, and display time. A 220µF tantalum right next to them on the breadboard protects the rail from the OLEDs charge pump noise.

These micro OLEDs are driven by a 1306 so you can use standard libraries like SSD1306Ascii. HOWEVER they only display a weirdly located sub-sample of that controllers 1k memory – so you have to offset the origin on your print statements accordingly.

Pingback: Adding two OLED displays to your Arduino Project – Arduino Apprentices
The comment under the OLED electronics, says that you removed the redundant I2C pullups (R5&R6, 4k7) while the Photo shows that R6 & R7 are removed, so R6 and (R5 or R7) should be removed?
That was a typo on my part. But it’s worth mentioning that these cheap screens vary quite a bit from one manufacturer to another, so you need to follow the traces to see which resistors are pulling up the I2C bus on your particular units. The resistors are redundant on the second screen because the first screen also has them. The RTC module on our loggers already provides a 4k7 on both lines.