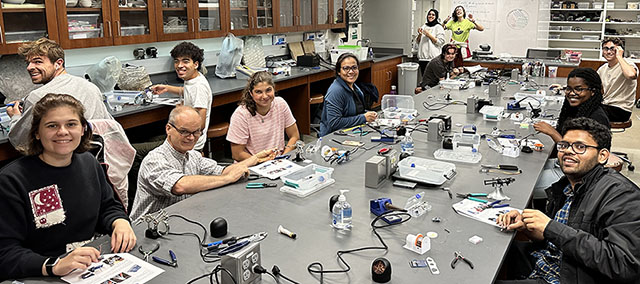
2023 is the ten-year anniversary of the Cave Pearl Project, with hundreds of loggers built from various parts in the Arduino ecosystem and deployed for Dr. Beddows research. During that time her EARTH 360 – Instrumentation course evolved from using commercial equipment to having students assemble a logging platform for labs on environmental sensing. The experience of those many first-time builders has been essential to refining our educational logger design to achieve maximum utility from a minimum number of components. So, in recognition of their ongoing and spirited enthusiasm, we call this new model the e360.

One of the things that distinguishes this project from others in the open science hardware movement is that instead of constantly adding features like IOT connectivity, we have been iterating towards simplicity. Cheap, flexible, stand-alone loggers enable many teaching and research opportunities that expensive complicated tools can not.

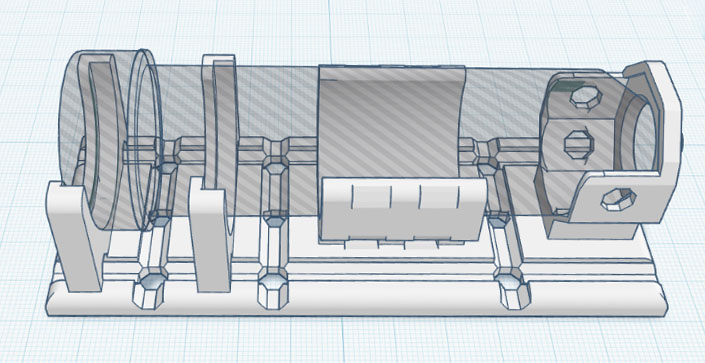
Many parallel trends have advanced the open-source hardware movement over the last decade, including progress towards inexpensive and (mostly) reliable 3D printing. In keeping with the project’s ethos of accessibility, we use an Ender 3 for the rails and you can download that printable stl file directly from Tinkercad. Tinkercad is such a beginner-friendly tool that students are asked to create their own logger mounting brackets from scratch as as an exercise in the Lux/LDR calibration lab. This directly parallels our increasing use of 3D prints for installation brackets & sensor housings on the research side of the project.
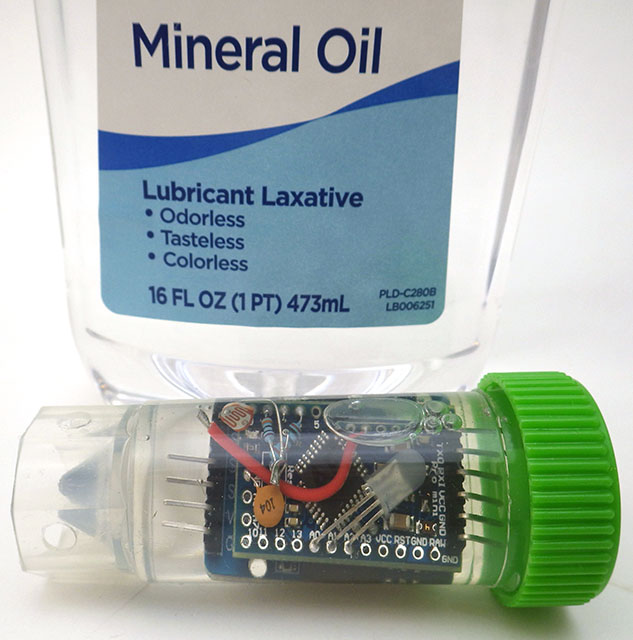
There are a few trade-offs to be aware of with this minimalist 2-module design: Supporting only Analog & I2C sensors makes the course more manageable but loosing the DS18b20, which has served us so well over the years, does bring a tear to the eye. Removing the SD card used on previous EDU models means that memory becomes the primary constraint on run-time (but that can be expanded easily). The RTC’s one second alarm means this logger is not really suitable for high frequency sampling and UV exposure makes the 50ml centrifuge tubes brittle after 3-4 months in full sun. Coin cells can only power sensors that draw less than 1-2mA and voltage droop limits operation to environments that don’t much below -10°C, although it’s easy enough to run the logger on two lithium AAA‘s in series and we’ve run those down to -20°C.
Jump links to the sections of this post:
- Parts for the lab kit
- Code Overview – Setup & Main Loop
- Adding Sensors to the Logger
- General Logger Operation
- Running the Course Labs
- Other Things to Know
- Last Word
Parts for the lab kit:
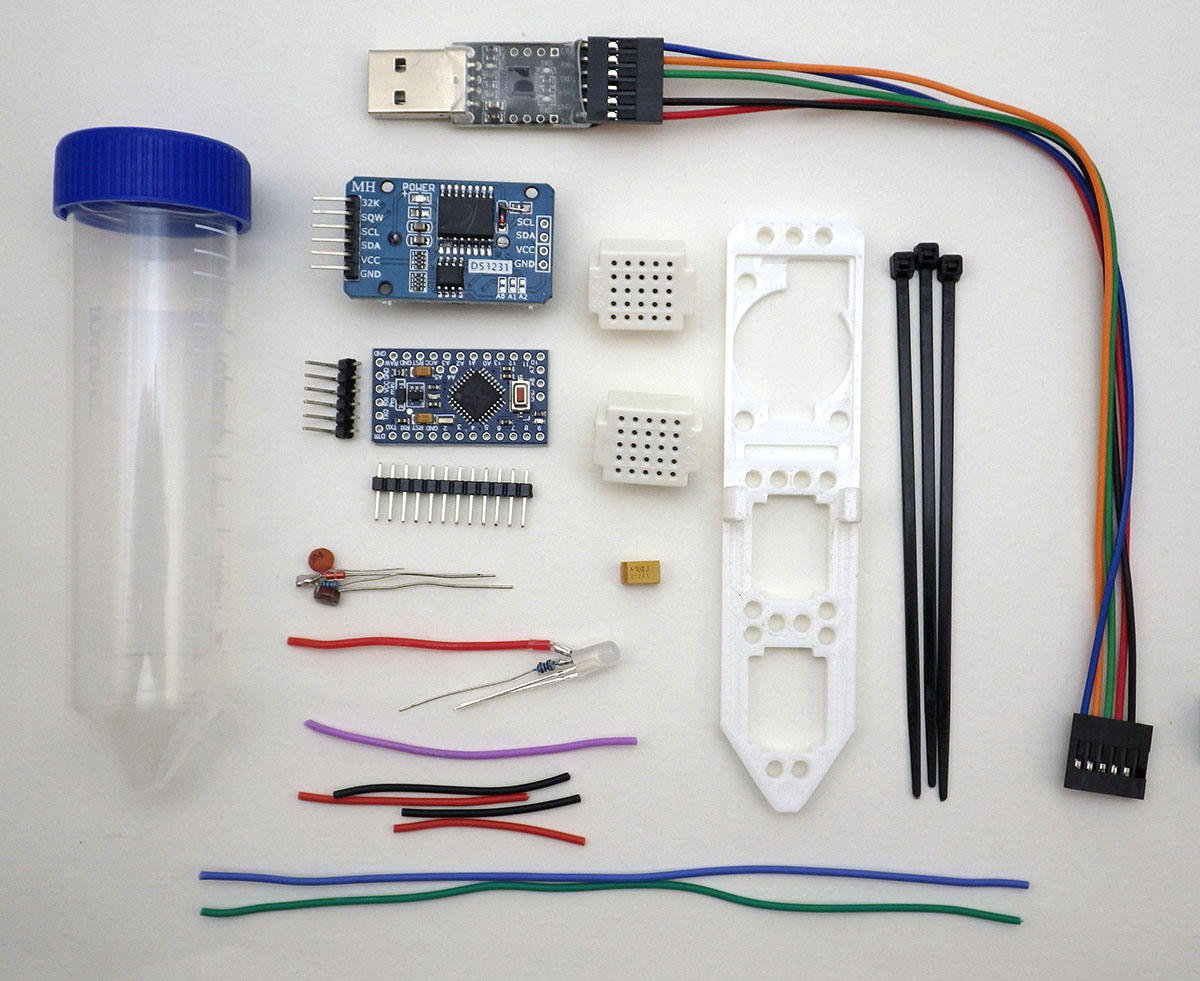
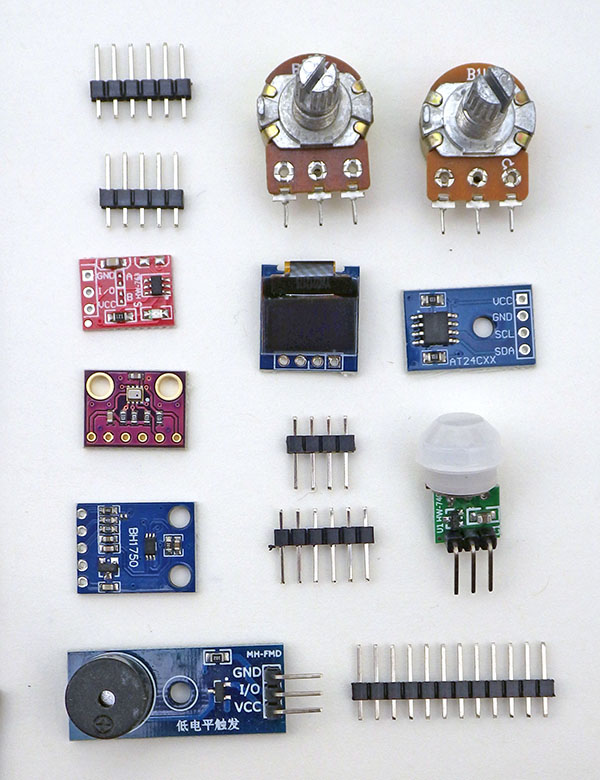
You can find all the parts shown here on eBay and Amazon – except for the rail which needs to be printed but these days it’s relatively easy to send 3D models out to an printing service if someone at your school doesn’t already have a printer. Expect 15% of the parts from cheap suppliers like eBay or Amazon to be high drain, or simply DOA. We order three complete lab kits per student to cover defects, infant mortality, and replacement of parts damaged during the course. This is usually their first time soldering and some things will inevitably get trashed in the learning process – but that’s OK at this price point. We also order each part from three different vendors, in case one of them is selling rejects from a bad production run. The extra parts allow students to build a second or third logger later in the course – which is often needed for their final projects.
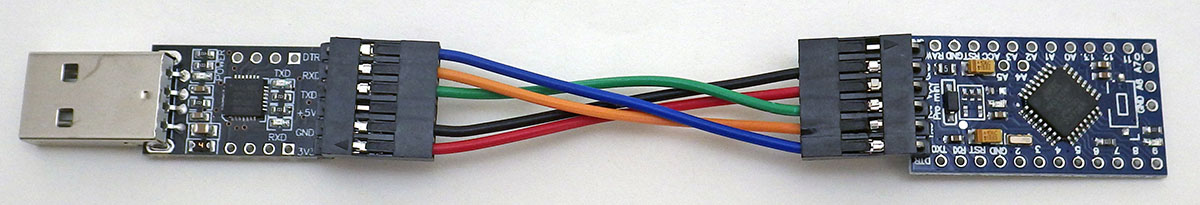
| Cp2102 UART | ProMini | |
| DTR | -> | DTR |
| RXD | -> | TXO |
| TXD | -> | RXI |
| GND | -> | GND |
| 3V3 | -> | VCC |
Macintosh USBc to USBa adapters are smart devices with chips that will shut-down if you unplug from the computer with a battery powered logger is still connected. The coin cell back-feeds enough voltage to put the dongle into an error state. Always disconnect the UART to logger connection FIRST instead of simply pulling the whole string of still-connected devices out of the computer. New Macs often require genuine Apple brand USBc-a adapters for any UART driver install to succeed.
After installing OS drivers for your UART, you need to select the IDE menu options:
[1] TOOLS > Board: Arduino Pro or Pro Mini
[2] TOOLS > Processor: ATmega328 (3.3v, 8mhz)
[3] TOOLS > Port: Match the COM# or /dev that appears when you connect the UART
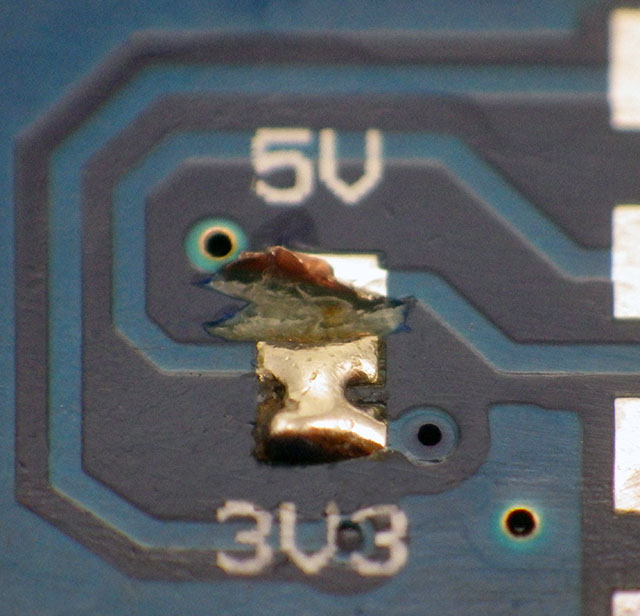
For many years we used FT232s, but the current windows drivers will block operation if you get one of the many counterfeit chips on the market. If you do end up with one of those fakes only OLD drivers from 2015 / 2016 will get that UART working with the IDE. To avoid that whole mess, we now use Cp2102’s or Ch340’s. Some UARTs require you to cut or bridge solder pads on the back side to set the 3.3v that an 8MHz ProMini runs on. Many I2C sensor modules on the market also require this lower voltage. Avoid Pro Mini’s with the much smaller 328P-MU variant processors. They may be compatible inside the chip but the smaller solder pad separation makes the overall logger noticeably more susceptible to moisture related problems later.
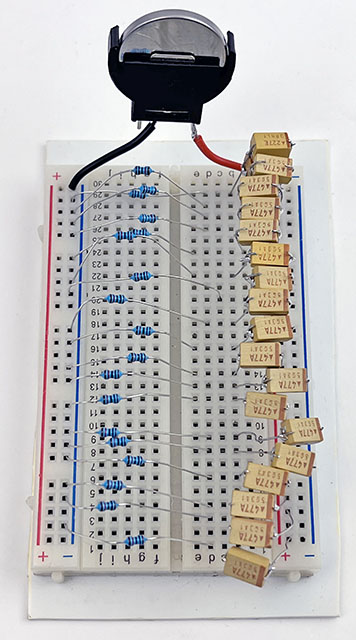
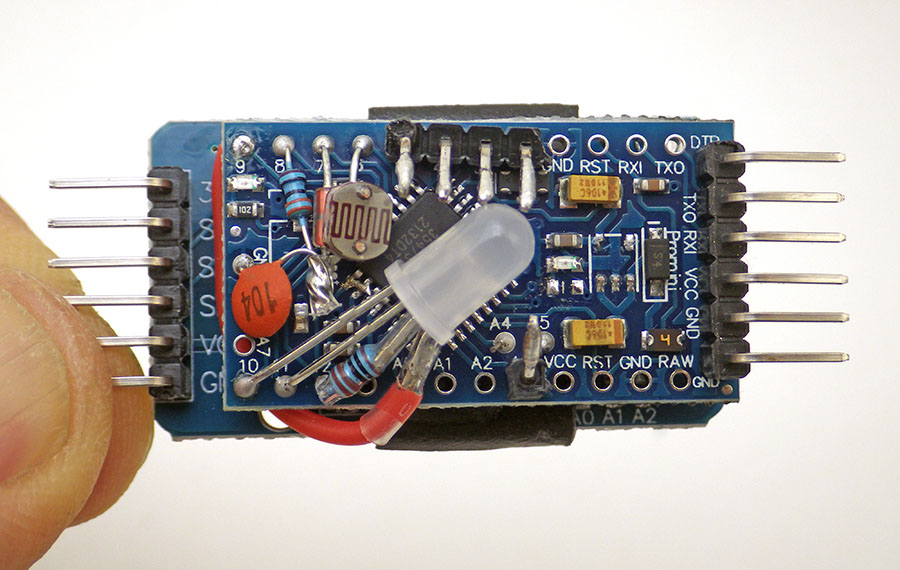
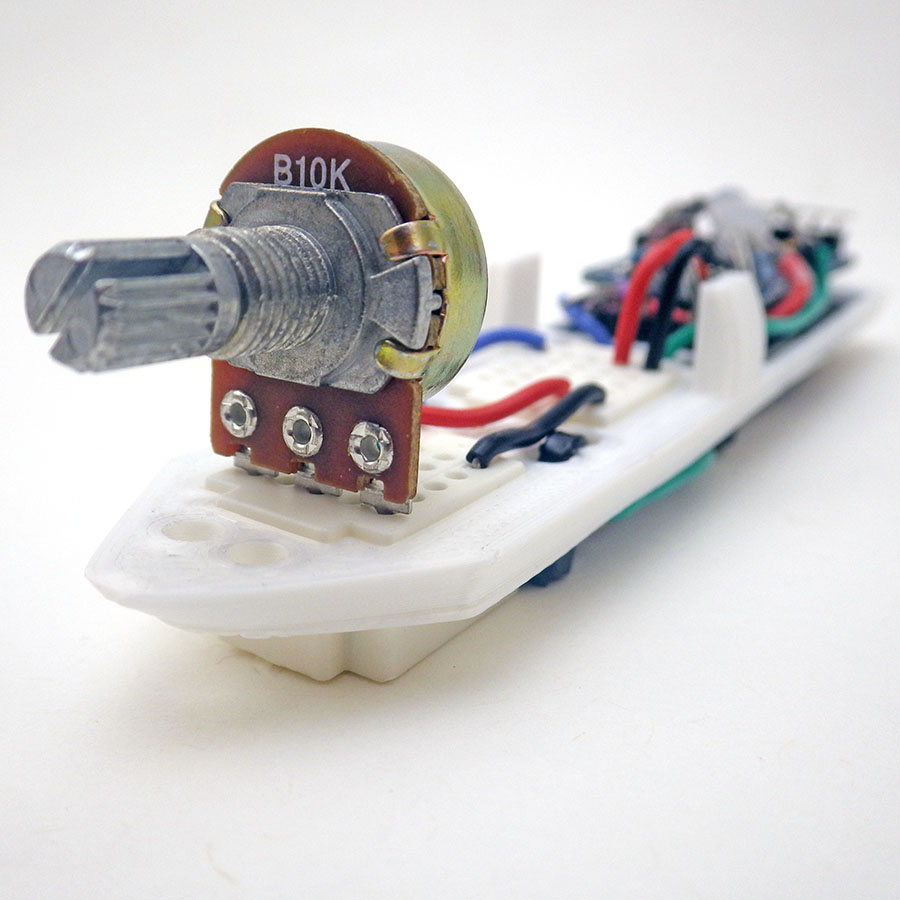
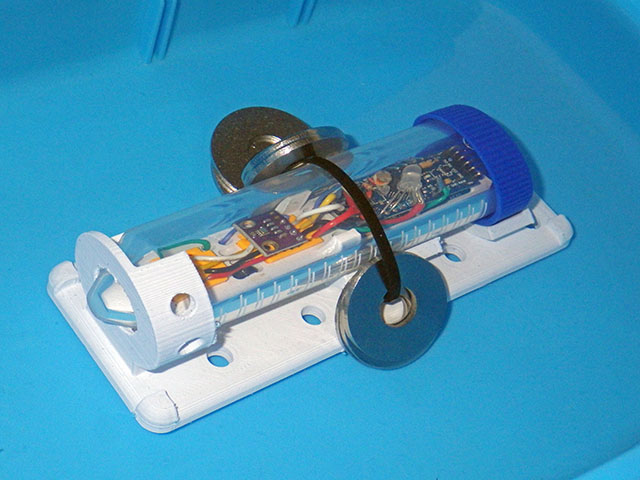
Assembling the logger:
This e360 model is based on the 2-Module logger we released in 2022, with changes to the LED & NTC connections to facilitate various lab activities in the course. That post has many technical details about the logger that have been omitted here for brevity, so it’s a good idea to read through that extensive background material when you have time.
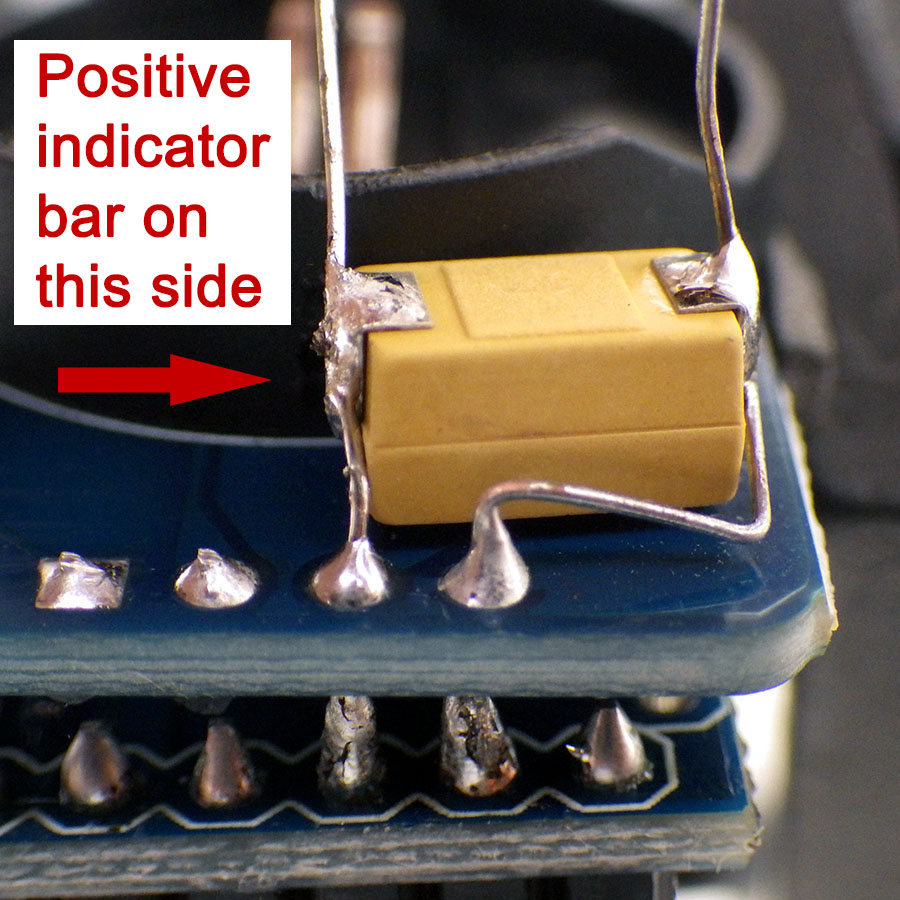
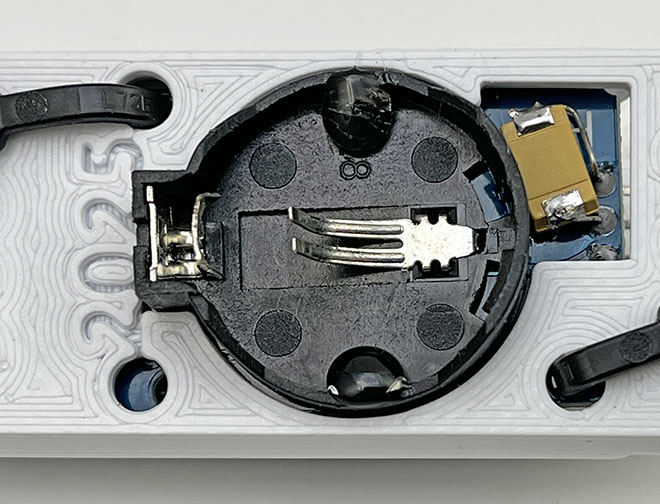
Prepare the RTC module:


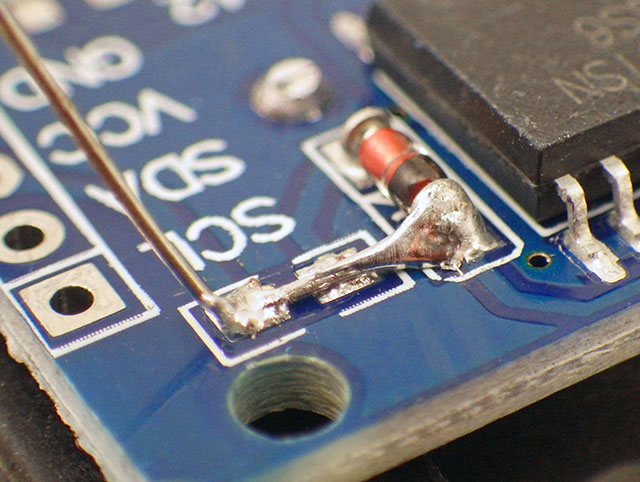
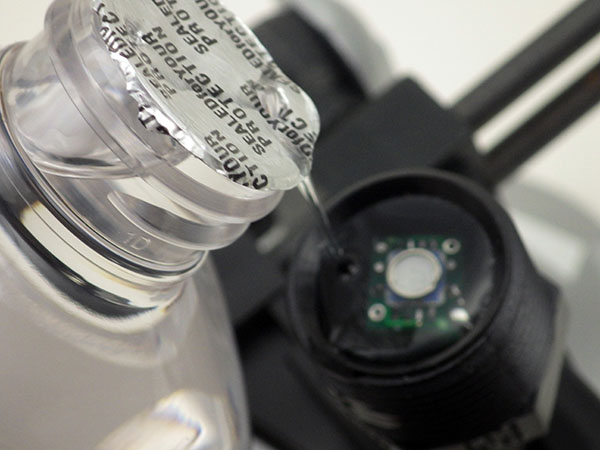
Cutting the VCC input leg forces the clock to run on VBAT which reduces the DS3231 chip constant current to less than 1µA, but that can spike as high as 550µA when the TCXO temperature reading occurs (every 64 seconds). The temp. conversions and the DS3231 battery standby current averages out to about ~3µA so the RTC is responsible for most of the power used by this logger over time. If the time reads 2165/165/165 instead of the normal startup default of 2000/01/01 then the registers are bad and the RTC will not function. Bridging Vcc to Vbat means a 3.3V UART will drive some harmless reverse current through older coin cells while connected. DS3231-SN RTCs drift up to 61 seconds/year while -M chips drift up to 153 sec/year. If the RTCs temperature readings are off by more than the ±3°C spec. then the clocks will drift more than that. I usually give the RTC modules a coating of conformal (or clear nail polish) before using them in a logger.

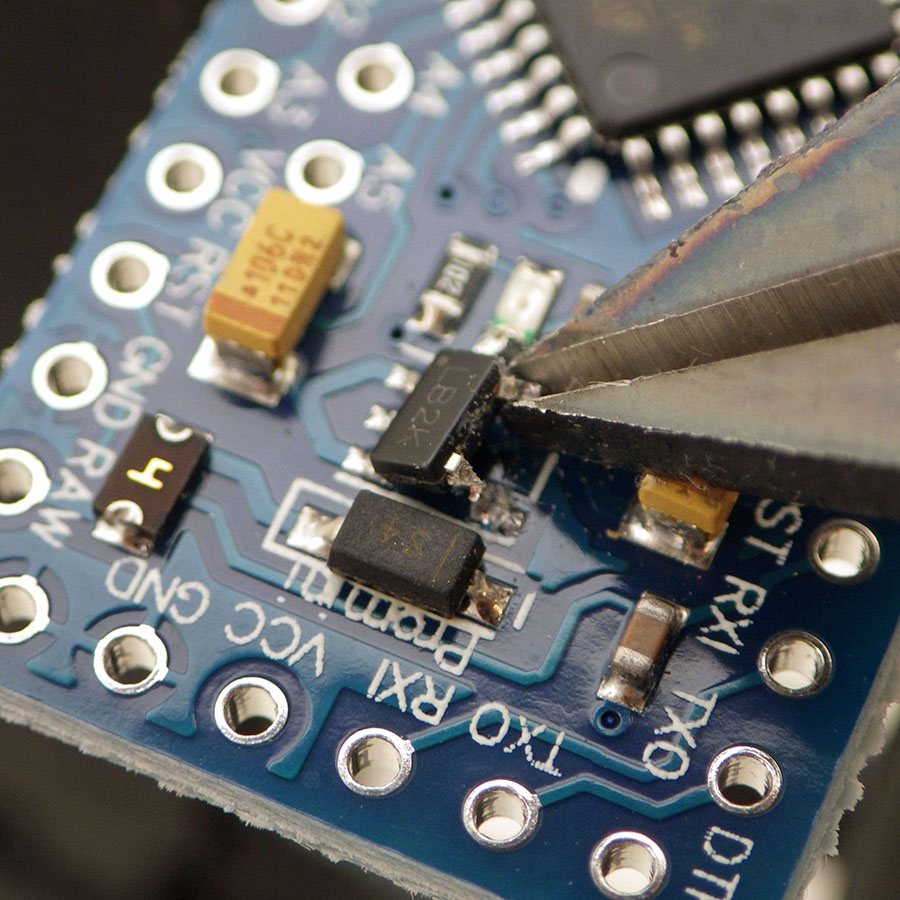
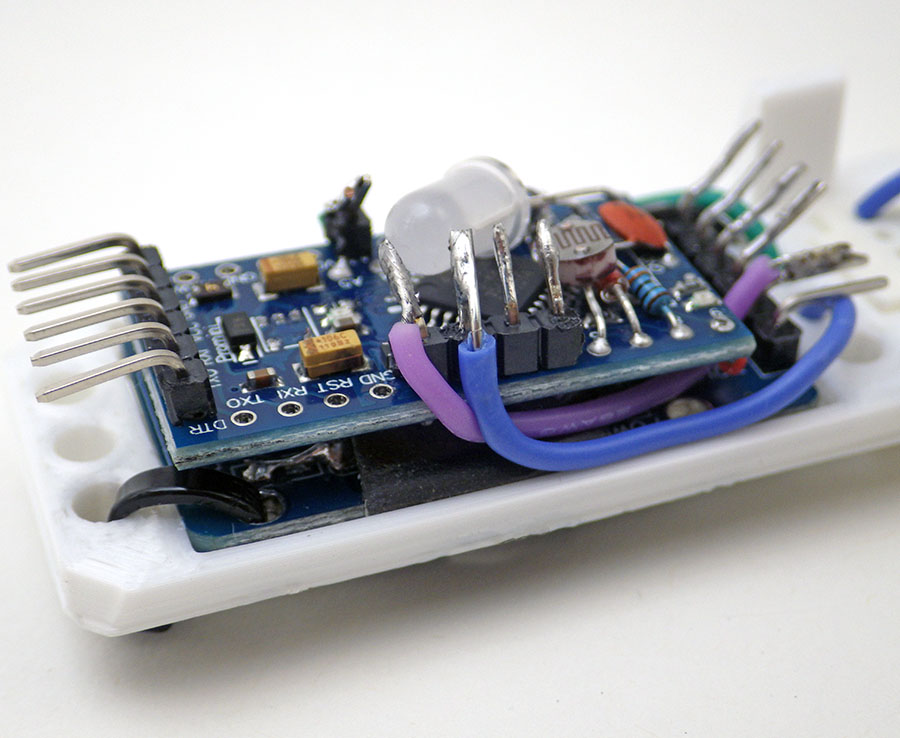
Modify & Test the Pro Mini:
A Pro Mini style board continues as the heart of the logger, because they are still the cheapest low-power option for projects that don’t require heavy calculations.

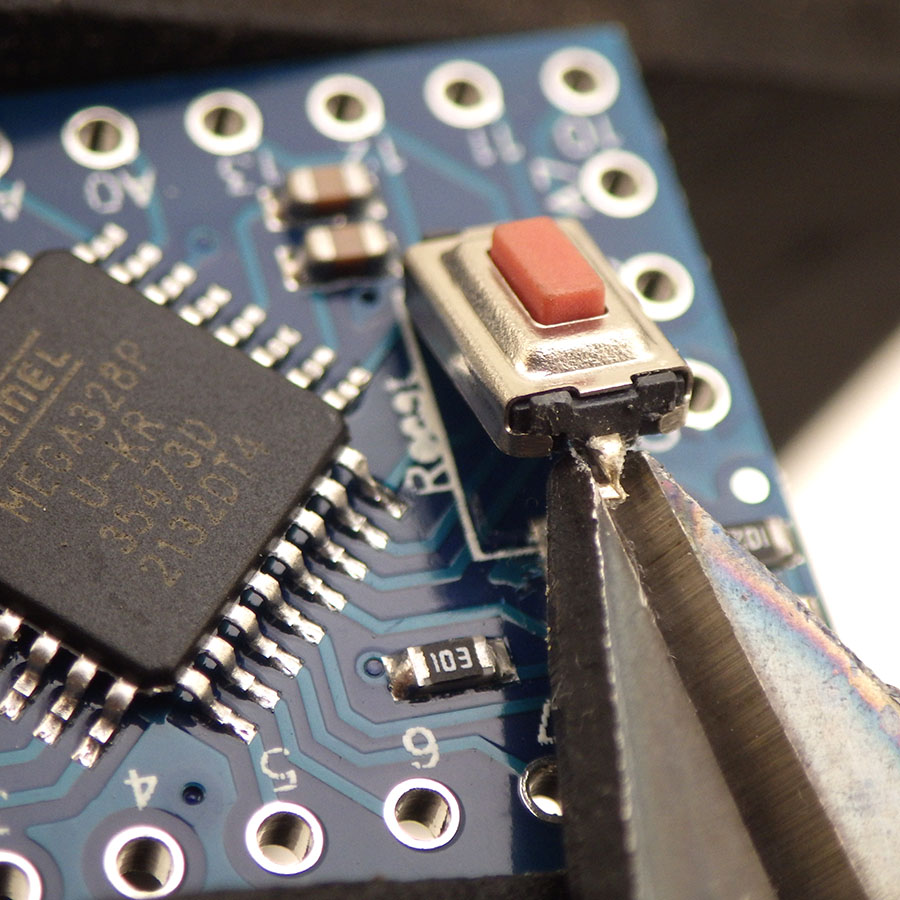


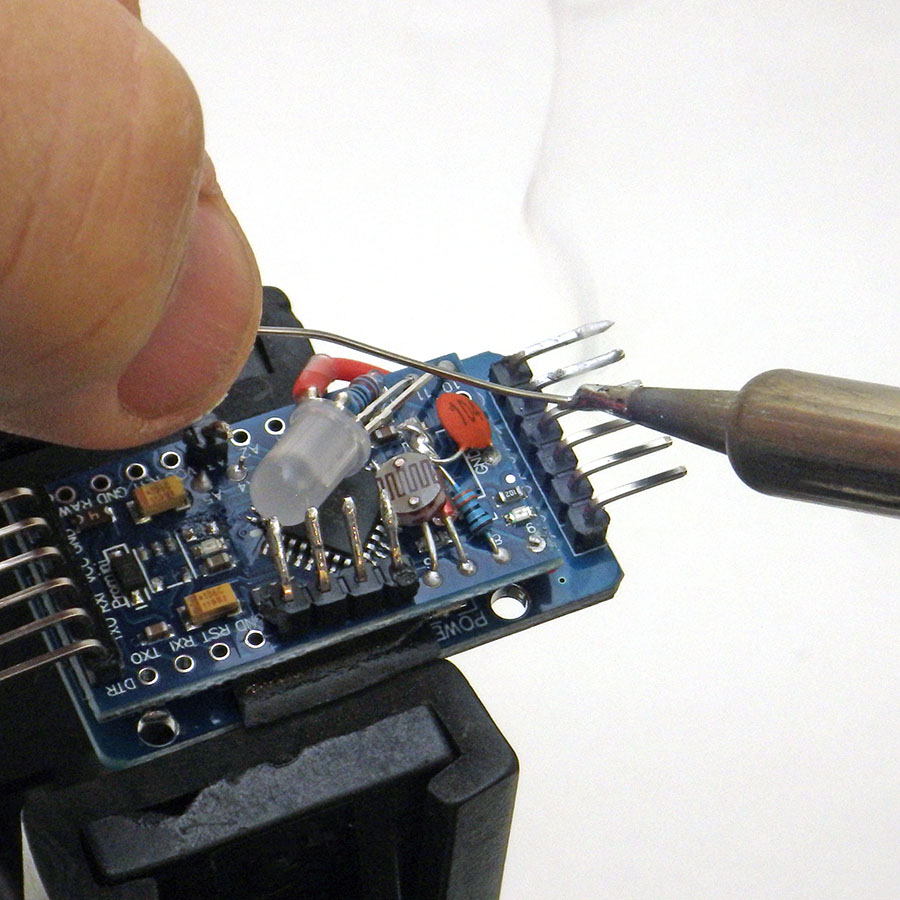
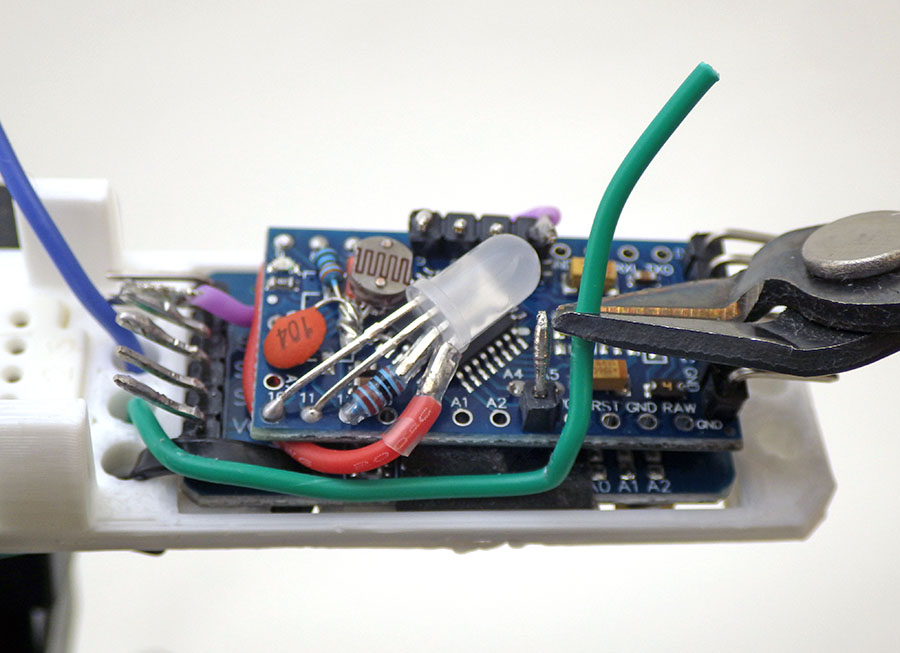
Add the NTC/LDR Sensors & LED indictor
These components are optional if you are only using I2C sensor modules, but they provide options for pulse width modulation and sensor calibration activities.
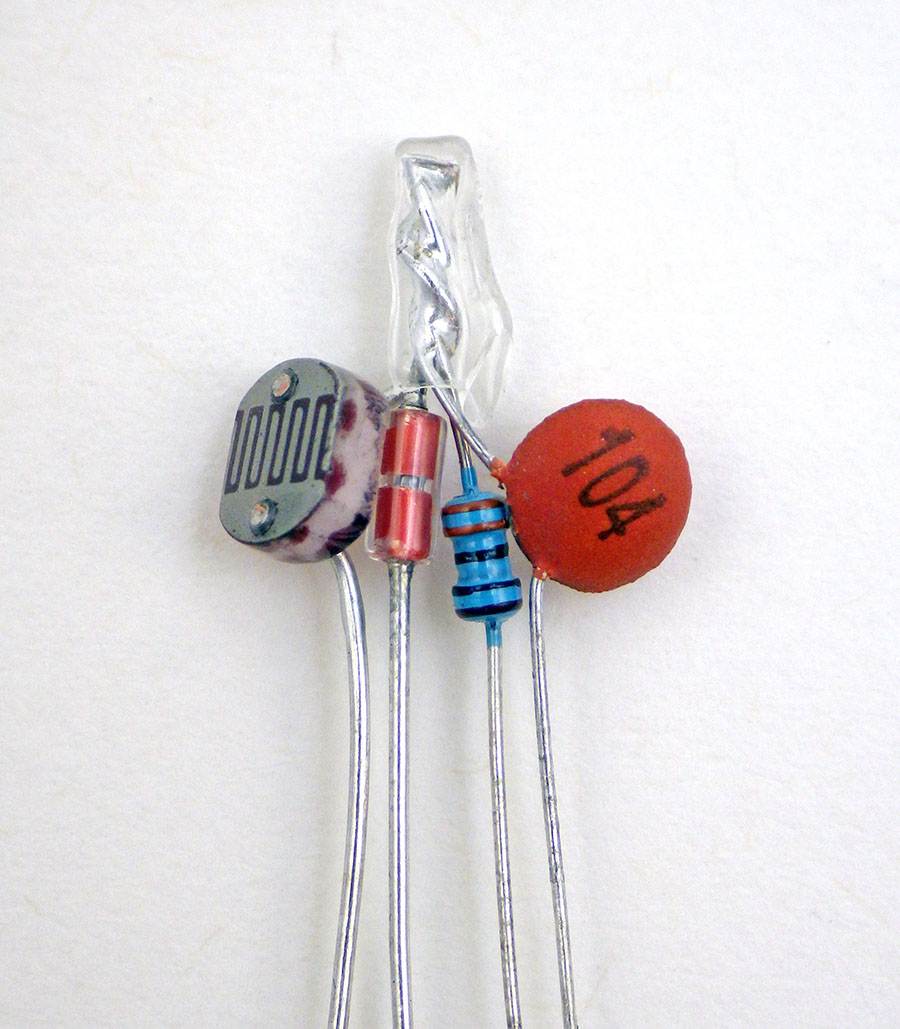
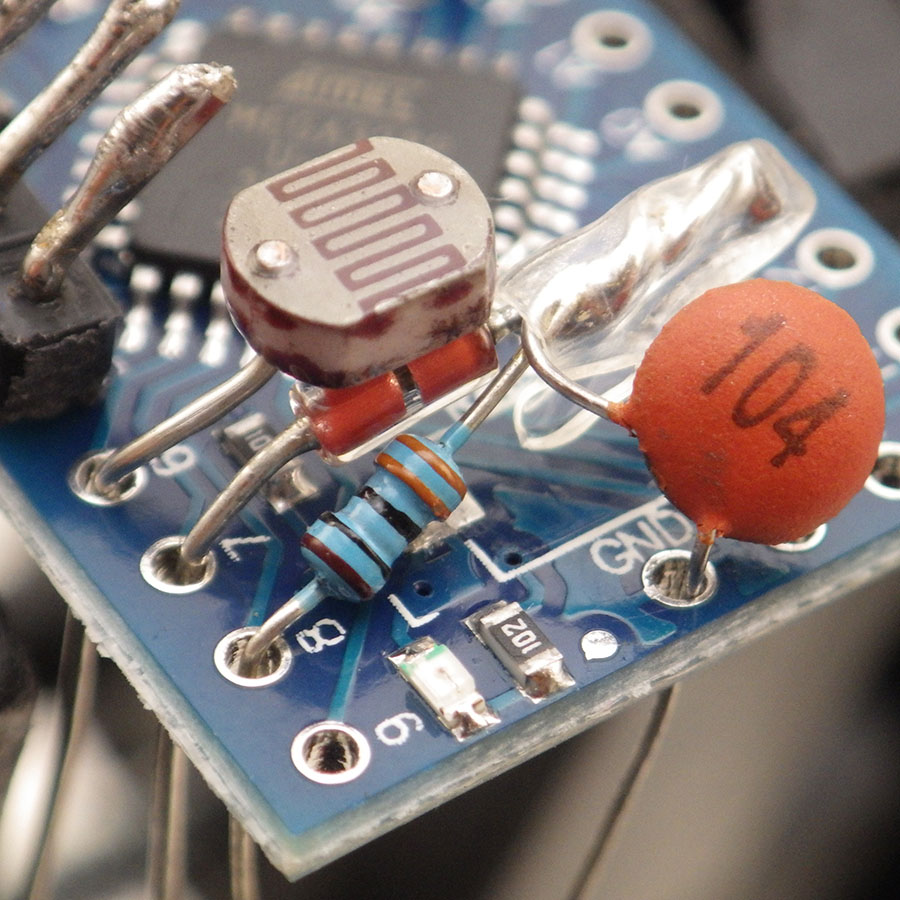

The way we read resistive sensors using digital pins is described in this post from 2019 although to leave more digital pins open for lab activities we use the 30k internal pullup resistor on D8 as the reference that the NTC and LDR get compared to. We have another post describing how to calibrate those NTC thermistors in a classroom setting. Noise/Variation in the NTC temperature readings is ±0.015°C, so the line on a graph of rapid 1second readings is about 0.03°C thick. The base-code uses 16bit integer variables, and a typical 10k NTC exceeds that 65535 ohm limit at about -12°C. Range switching with two NTCs could be done if the max / min resistance values of one thermistor can’t deliver the span you need or you could edit the code to use 32bit ints.
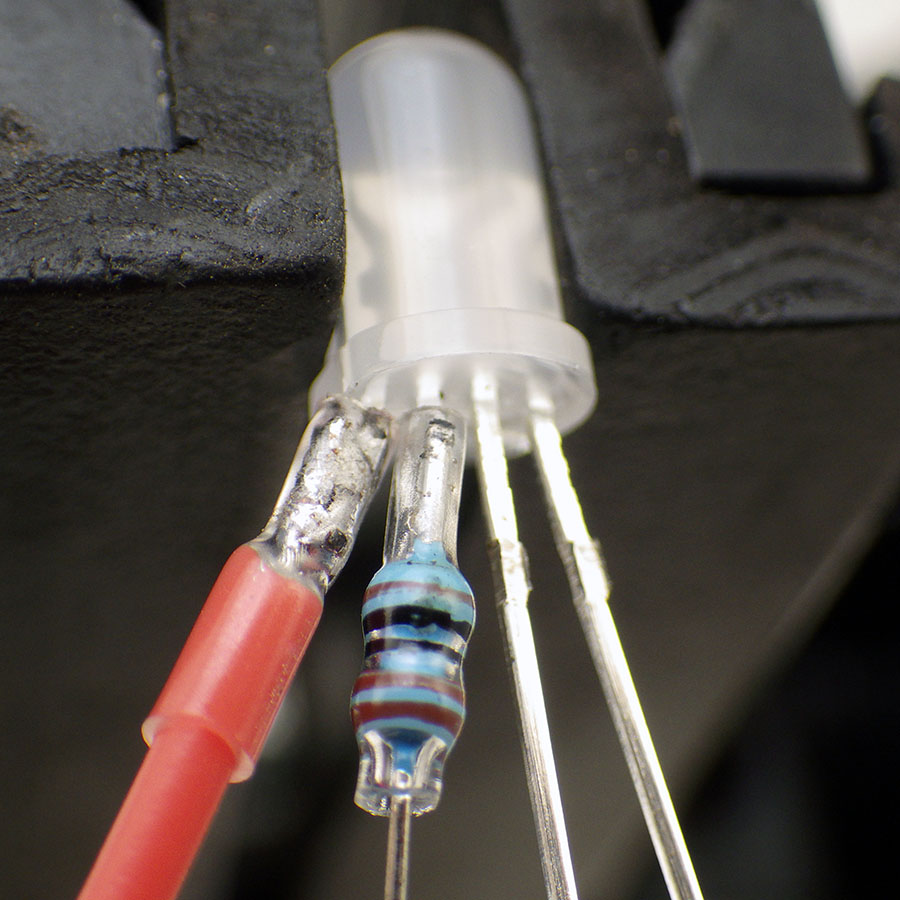
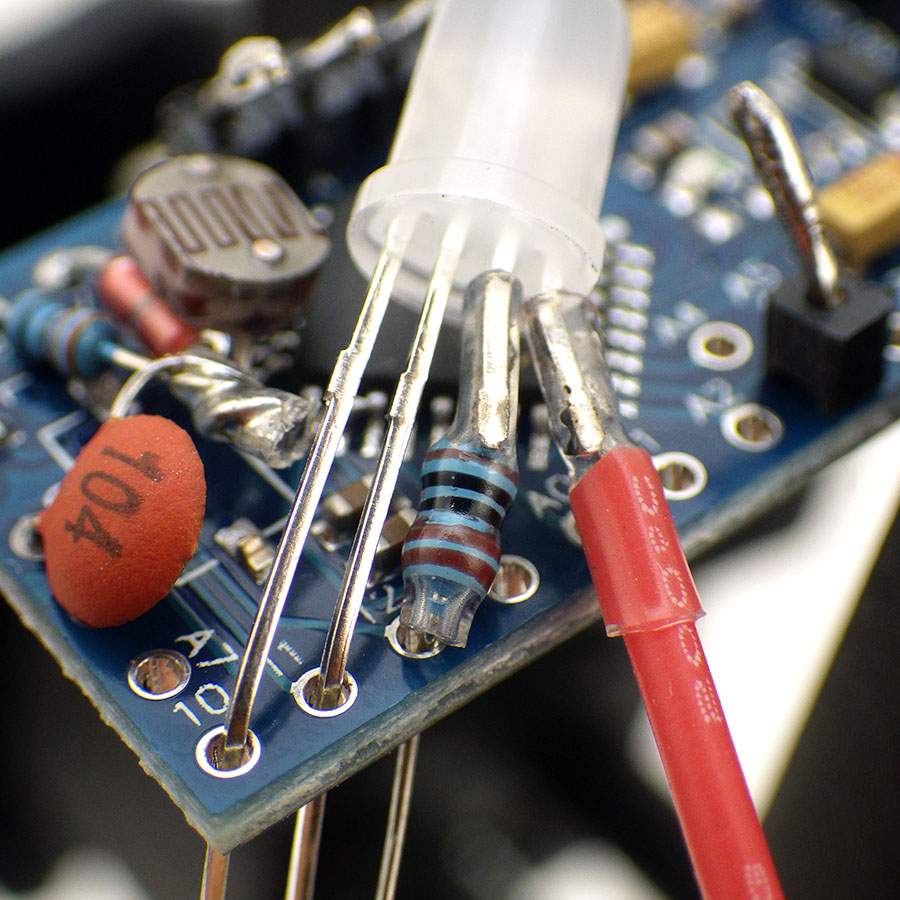
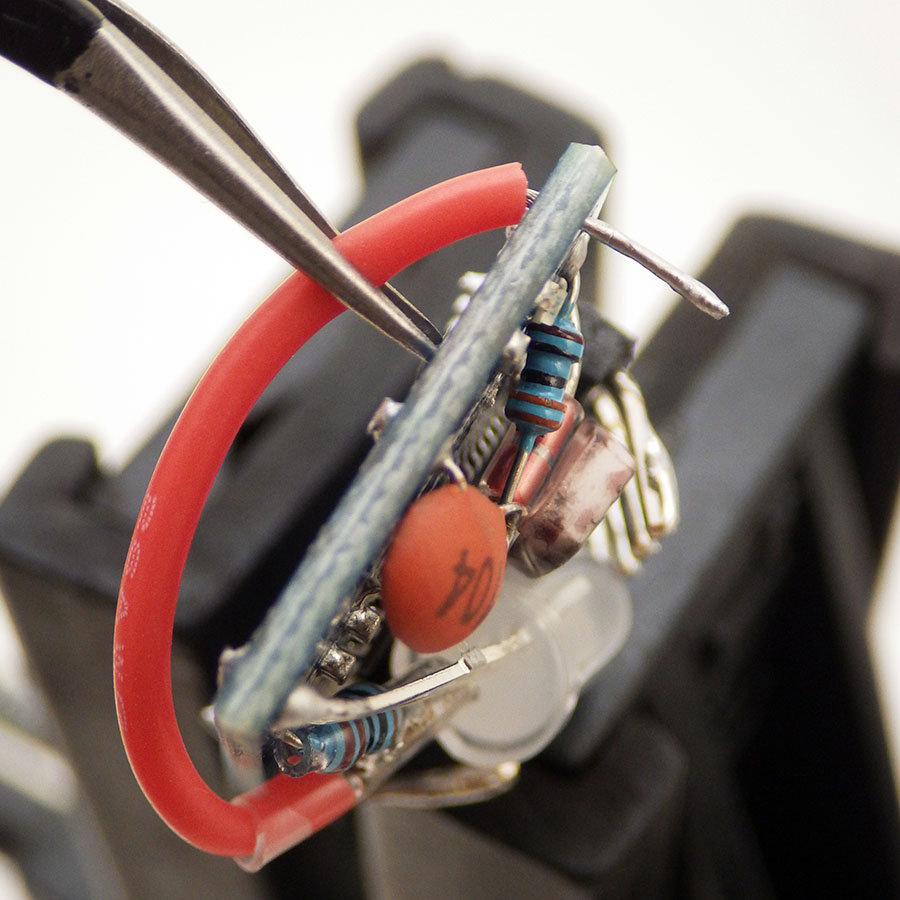
You can test which leg of an LED is which color with a cr2032 coin cell using the negative side of the battery on the ground leg. The LED color channels are soldered to ProMini pins R9-B10-G11 and a 1k limit resistor is added to the D12 GND connection to allow multi-color output via the PWM that those pins support. Note that the little red LED on the ProMini at pin D13 is still available to use as an indicator if you do not add the RGB led.
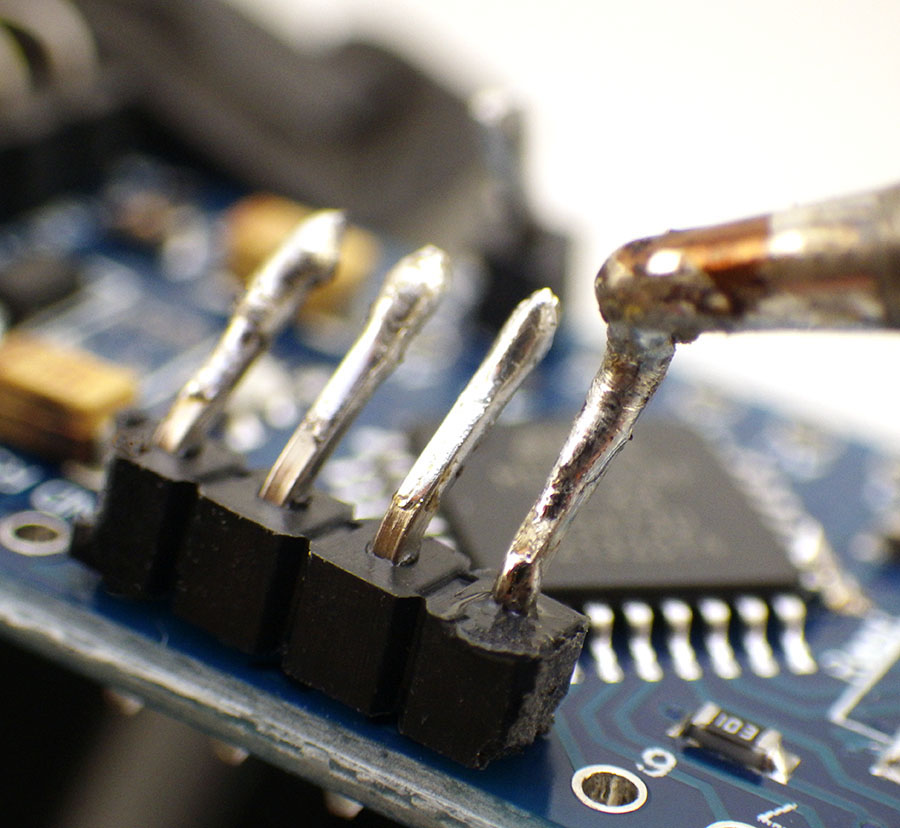
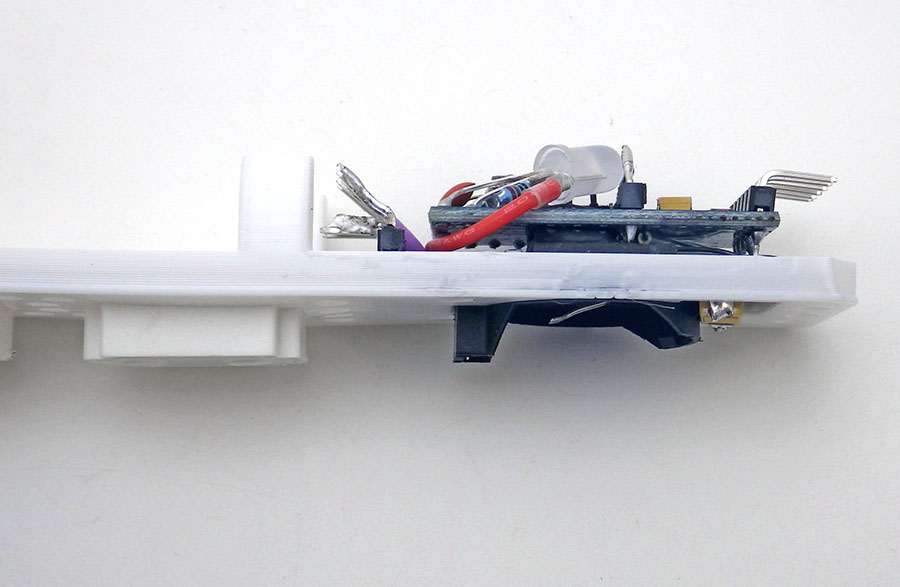
Join the Two Modules via the I2C Bus:

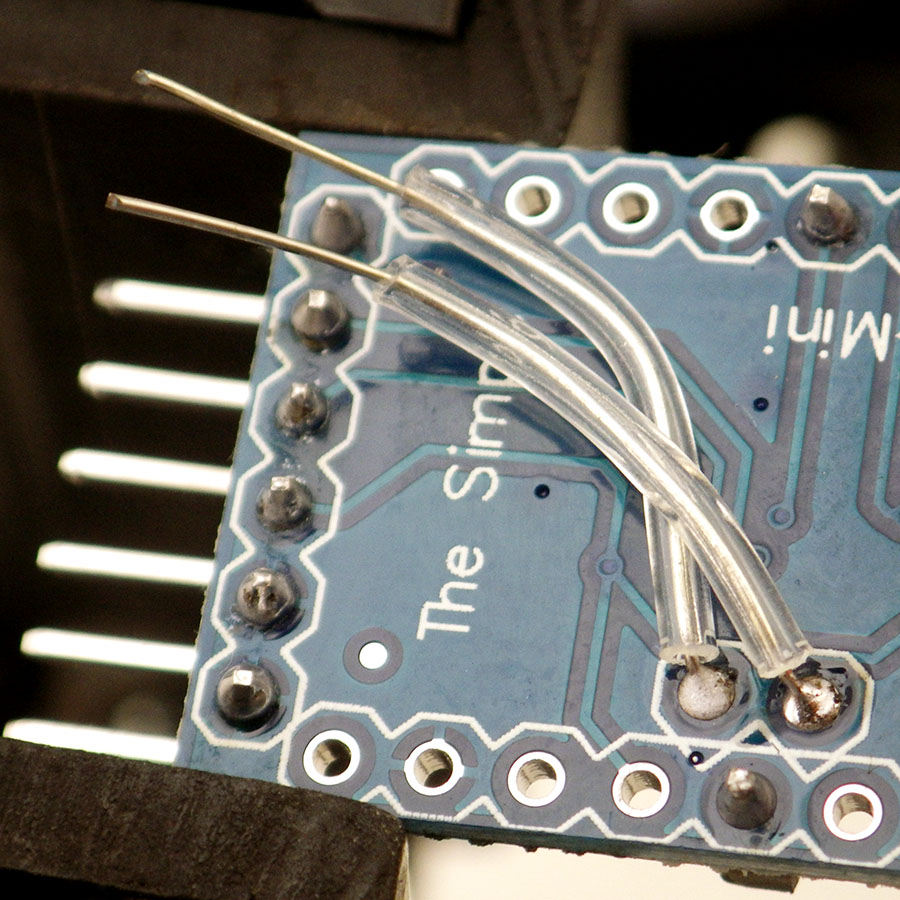


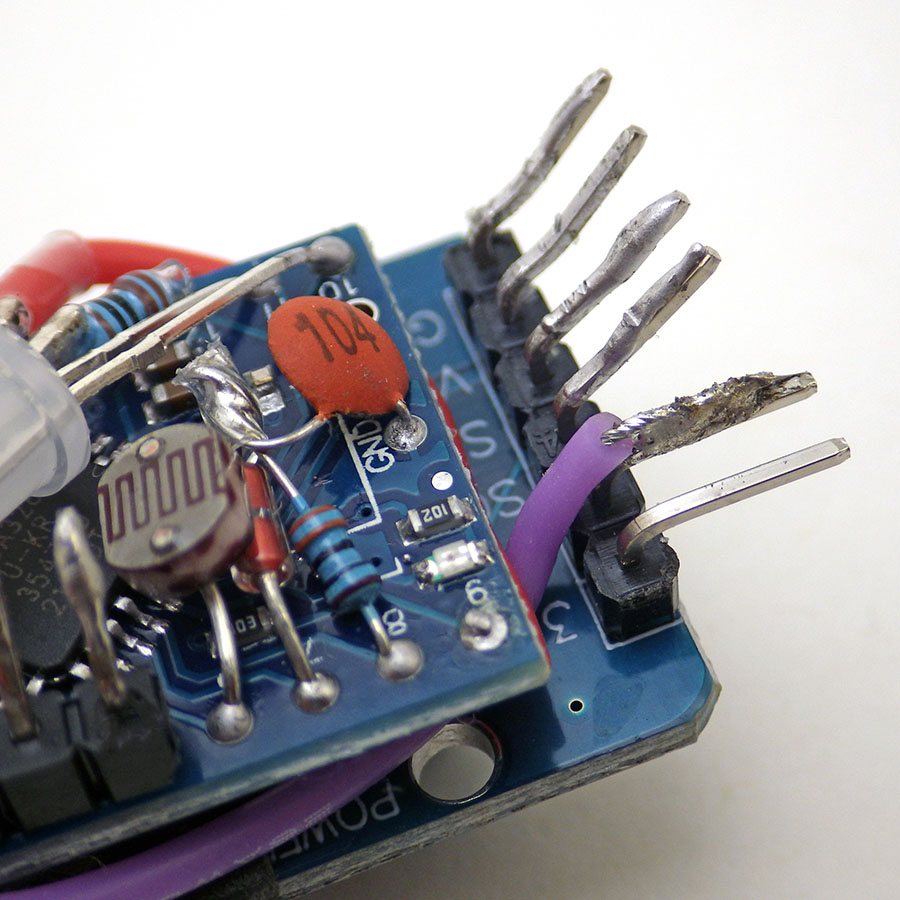
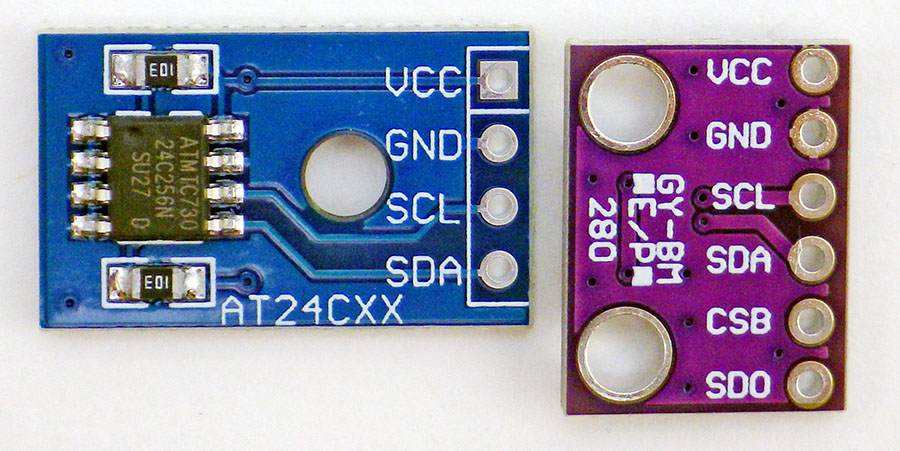
As soon as you have the two modules together: connect the logger to a UART and run an I2C bus scanning program to make sure you have joined them properly. This should report the DS3231 at address 0x68, and the 4K EEprom at 0x57.
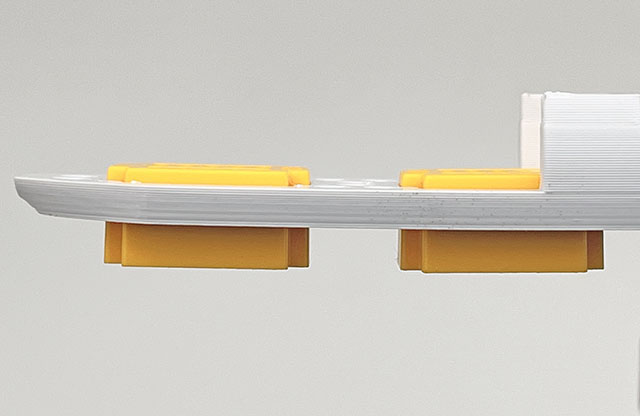
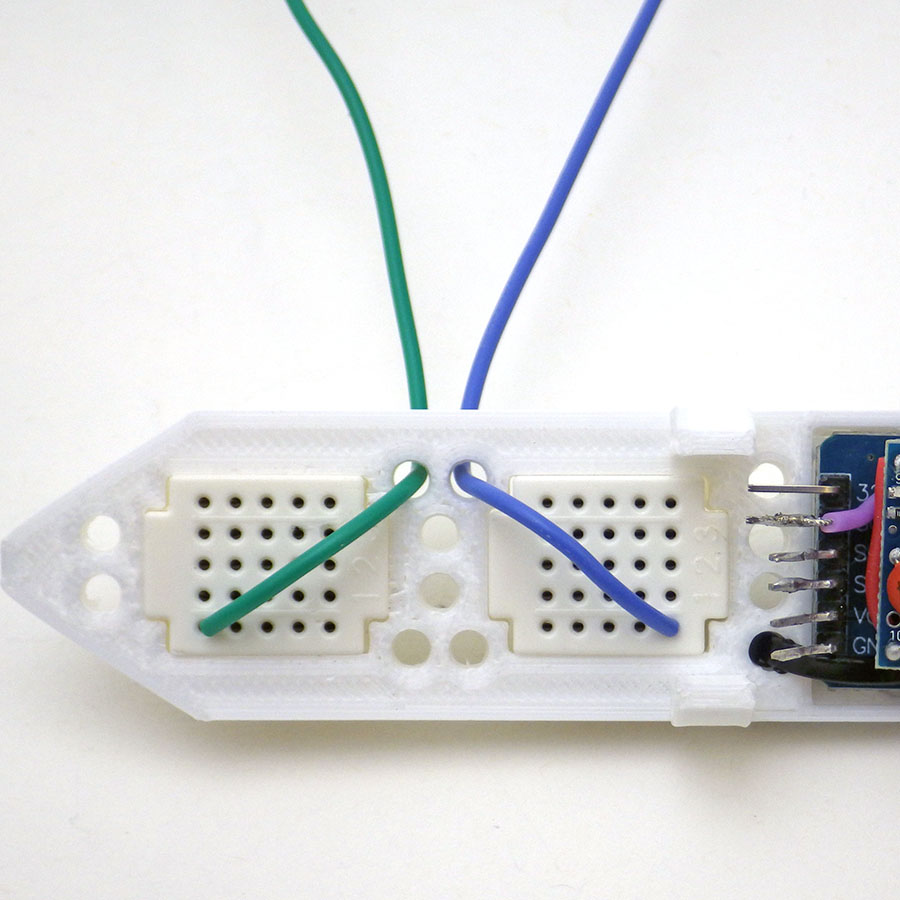
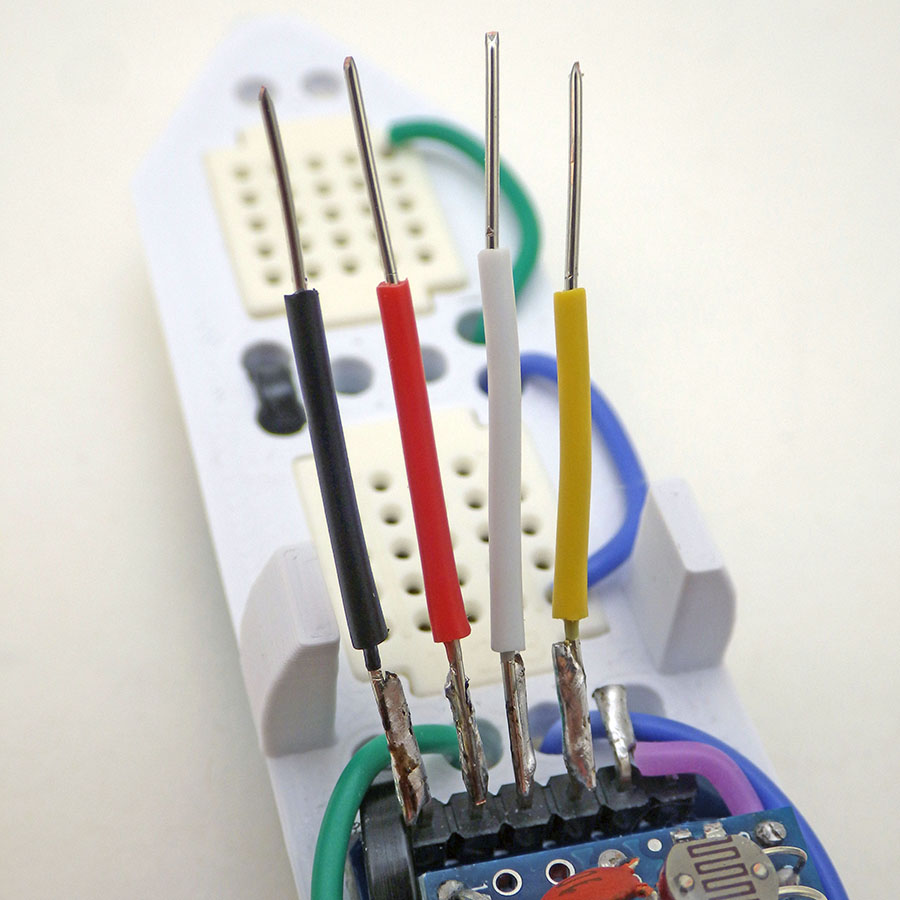
Add Rails & Breadboard Jumpers:


A video covering the whole assembly process:
Code Overview: [posted on GitHub]
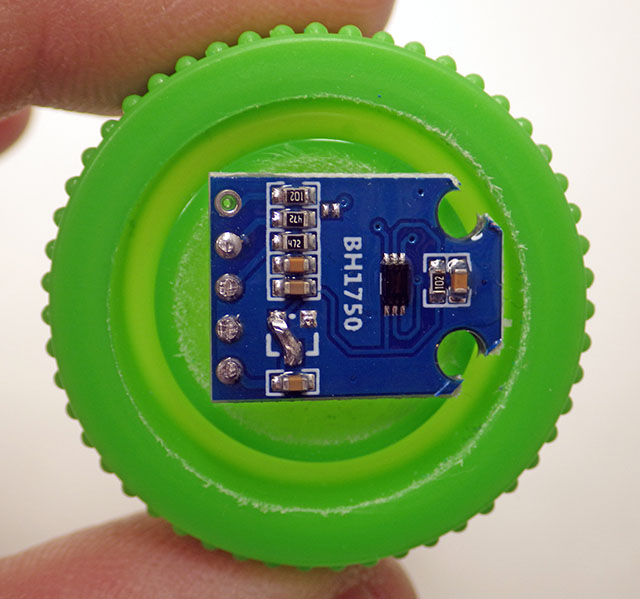
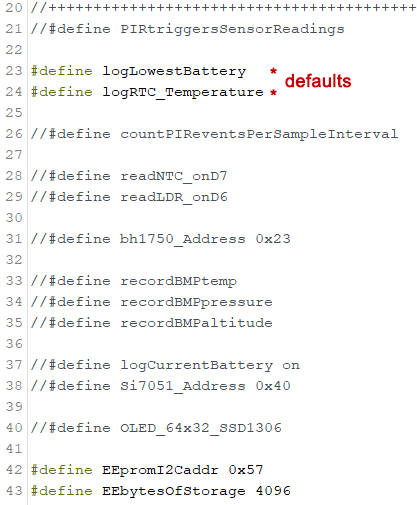
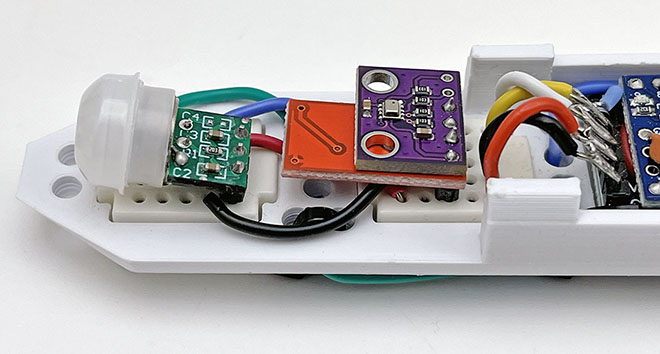
The base code requires the RocketScream LowPower.h library to put the logger to sleep between readings and this can be installed via the library manager in the IDE. In addition to the included NTC / LDR combination, the code has support for the BMP/E280, BH1750(lux), and PIR sensors although you will need to install libraries (via the IDEs library manager) for some of them. Sensors are added by uncommenting define statements at the beginning of the code. Each sensor enabled after the single-byte LowBat & RTCtemp defaults contributes two additional bytes per sampling event because every sensors output gets loaded into a 16-bit integer variable.
The basic sensors cover light, temperature, pressure and humidity – so you could teach an introductory enviro-sci course by enabling or disabling those sensors before each lab. Note: while the BME280 is quite good for indoor measurements where very high RH% occurs rarely; SHT30 or AM2315C sensors encapsulated in water resistant PTFE shells are better choices for long term weather stations.
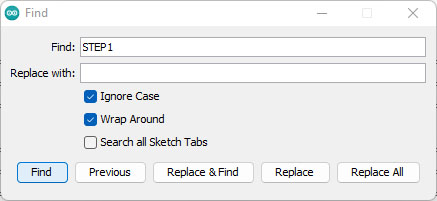
But limiting this tool to only the pre-configured sensors would completely miss the point of an open source data logger project. So we’ve tried to make the process of modifying the base-code to support different sensors as straight forward as possible. Edits are required only in the places indicated by call-out numbers on the following flow diagrams. These sections are highlighted with comments labeled: STEP1, STEP2, STEP3, etc. so you can locate them with the find function in the IDE.
The navigation point comments are also surrounded by rows of PLUS symbols:
//++++++++++++++++++++++++++++
// STEP1: #include libraries & Declare Variables HERE
//++++++++++++++++++++++++++++
In Setup()
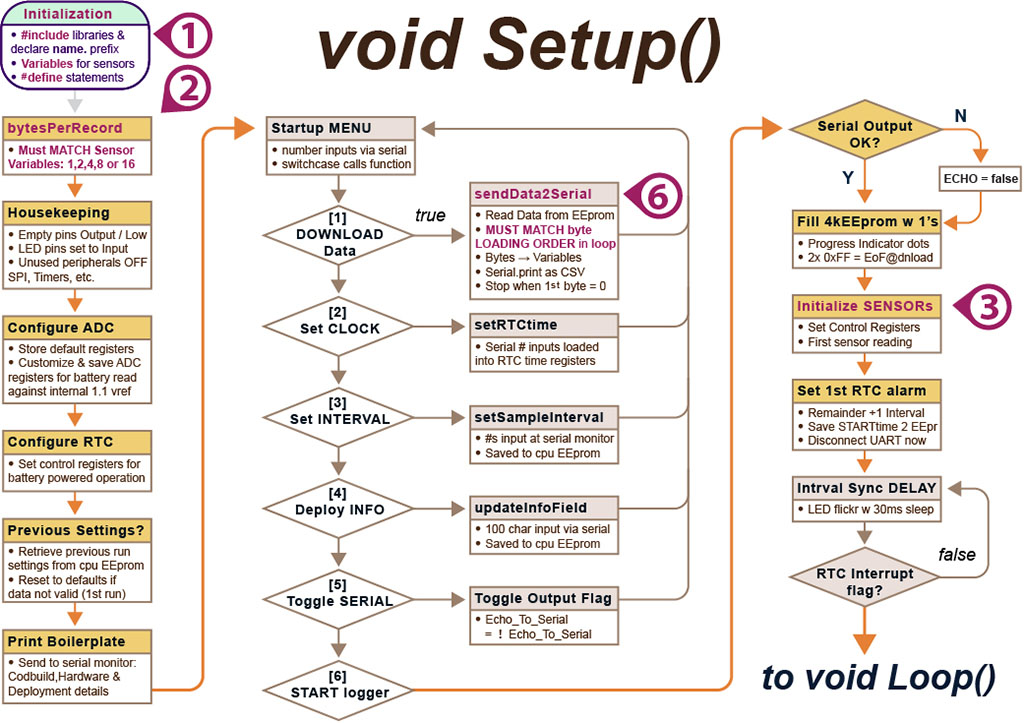
A UART connection is required to access the start-up menu through the serial monitor window in the IDE. This menu times-out after 8 minutes but the sequence can be re-entered at any timeby closing and re-opening the serial monitor. This restarts the Pro Mini via a pulse sent from the UARTs DTR (data terminal ready) pin. The start-up menu should look similar to the screen shot below, although the menu options may change as new code updates get released:
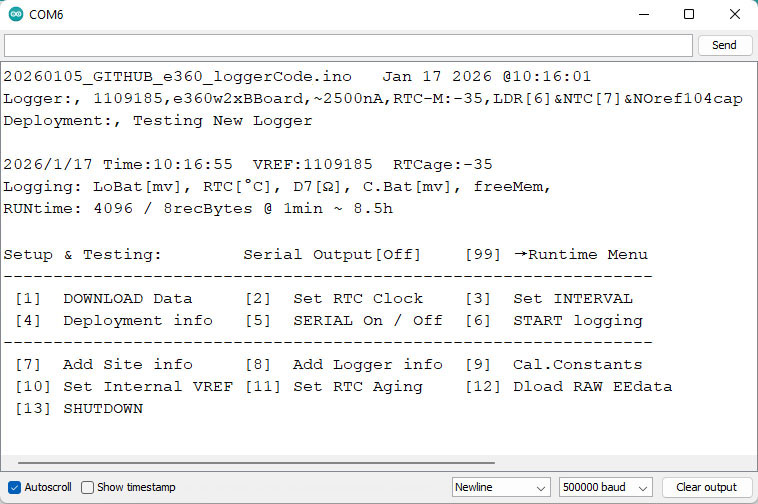
The first menu option asks if you want to download data from the logger after which you can copy/paste everything from the serial window into a spreadsheet. Then, below the data tab in Excel, select Text to Columns to divide the data into separate columns at the comma separators. Or you can paste into a text editor and save a .csv file for import to other programs. While this transfer is a bit clunky, everyone already has the required cable and retrieval is driven by the logger itself. We still use the legacy 1.8.x version of the IDE, but you could also do this download with a generic serial terminal app like CoolTerm. If you get data dropouts on an older computer shut down other applications so your computer can keep up with serial feed: web browsers are particularly bad for hogging all the cpu time if they are running YouTube or a stream like Spotify. You can download the data without battery power once the logger is connected to a UART. However, you should only set the RTC after installing a battery, or the time will reset to 2000/01/01 00:00 when the UART is disconnected. No information is lost from the EEprom when you remove and replace a dead coin cell.
A Unix timestamp for each sensor reading is reconstructed during data retrieval by adding successive second-offsets to the first record time saved during startup. You should download old data from a previous run before changing the sampling interval because the interval stored in memory is used for the calculation that reconstructs each records timestamp. This technique saves a significant amount of our limited memory and = (Unixtime/86400) + DATE(1970,1,1) converts those Unix timestamps into Excel’s date-time format. Valid sampling intervals must divide evenly into 60 and be less than 60. Short second-intervals are supported for rapid testing & debugging, but you must first enter 0 for the minutes before the seconds entry is requested. The unit will keep using the previous sampling interval until a new one is set. It helps to have a utility like Eleven Clock running so that you have HH:MM:SS displayed on your computer screen when setting the loggers clock.
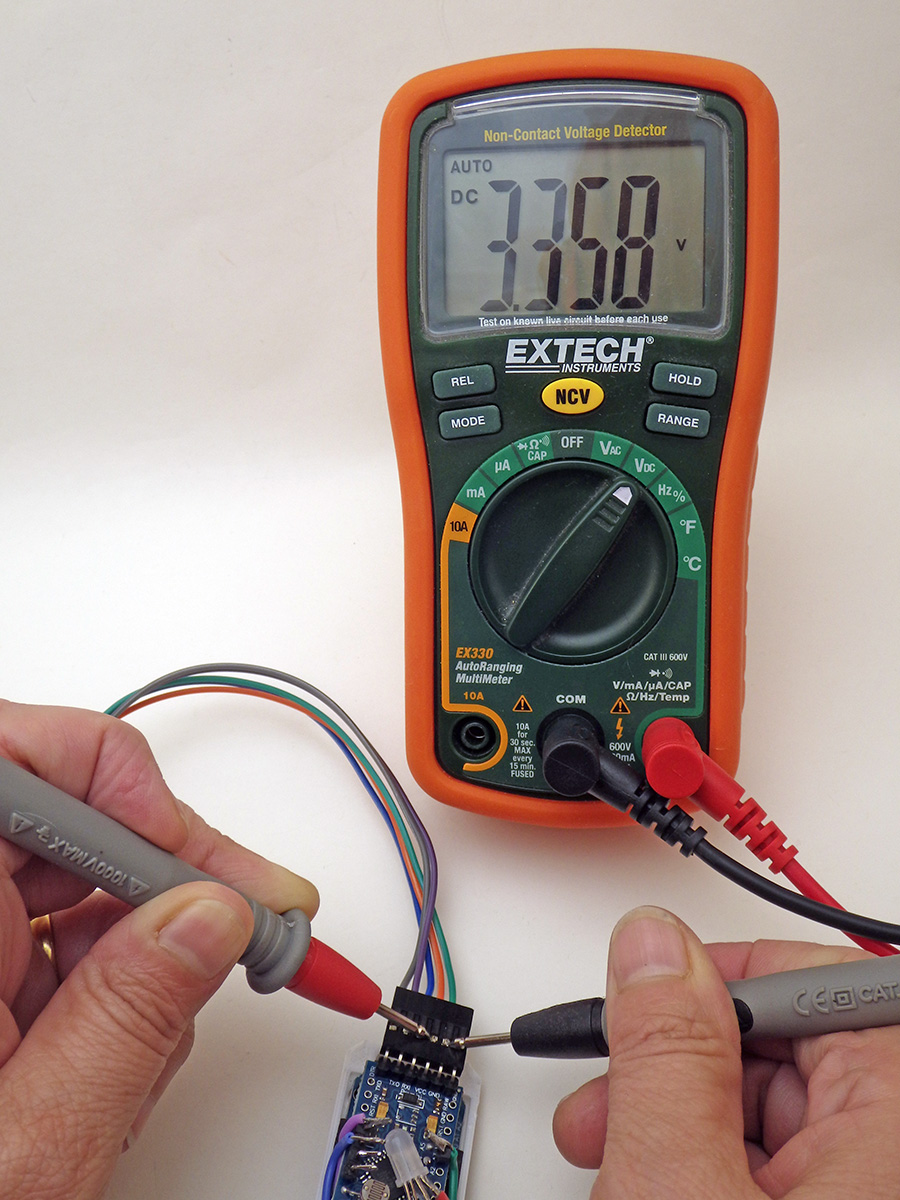
Vref compensates for variations in the reference voltage inside the 328p processor. Adjusting the 1126400 default value up or down by 400 raises/lowers the reported voltage by 1 millivolt. Adjust this by checking the voltage supplied by your UART with a multimeter while running the logger with #define logCurrentBattery enabled and serial output Toggled ON at a 1 second interval. Note the difference between the millivolts you actually measured and the battery voltage reported on the serial monitor and then multiply that by 400 to get the adjustment you need to make. Restart and save this new number with the [ ] Set VREF menu option and repeat this procedure until the battery reading on screen matches what you are measuring with the DVM. This adjustment only needs to be done once as the number you enter is stored in the 328p EEprom for future use. Note that most loggers run fine with the default 1126400 vref although some units will shutdown early because they are under-reading. It’s rare to get two constants the same in a classroom of loggers so you can use student initials + vref as unique identifiers for each logger. If you do get a couple the same you can change the last two digits to make unique serial numbers without affecting the readings. Note that the 1-byte compressed battery readings have a resolution limit of ±16 millivolts.
After setting the time, the sampling interval, and other operating parameters, choosing [ ] START logging will require the user to enter an additional ‘start’ command. Only when that second ‘start’ confirmation is received does old data get erased by setting every memory location in the EEprom. Maximum value trapping is required on the sensor variables because multiple 0xFF readbacks serve as the End-Of-File indication during download. LEDs then ‘flicker’ rapidly to indicate a synchronization delay while the logger waits to reach the first aligned sampling time so the code can progress from Setup() into the Main Loop().
In the main LOOP()
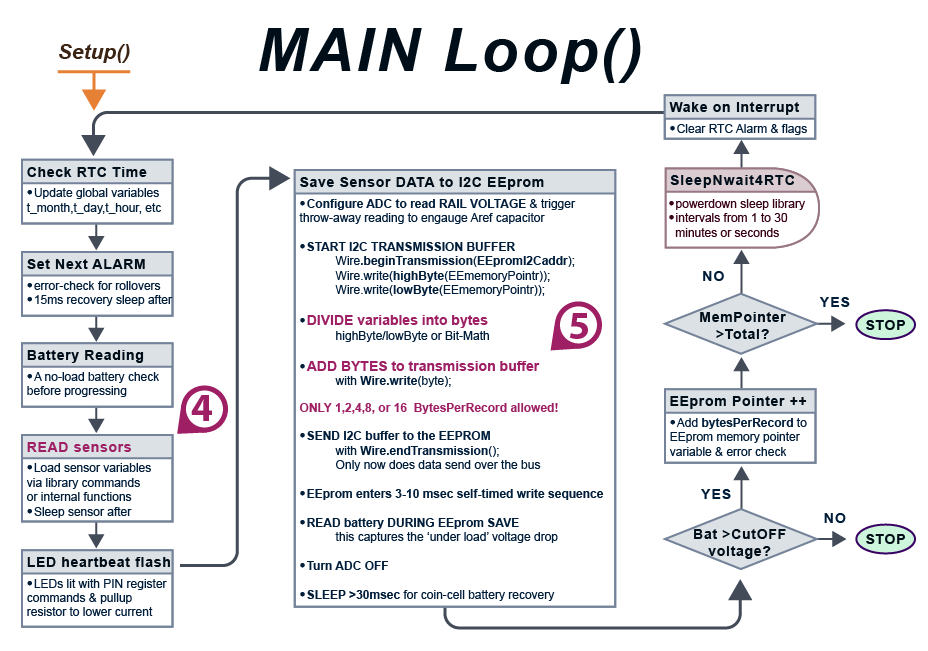
If all you do is enable sensors via defines at the start of the program you won’t have to deal with the code that stores the data. However to add a new sensor you will need to make changes to the I2C transaction that transfers those sensor readings into the EEprom (and to the sendData2Serial function that reads them back later). This involves dividing your sensor variables into 8-bit pieces and adding those bytes to the wire transfer buffer. This can be done with bit-math operations for long integers or via the lowByte & highByte macros for 16-bit integers. The general pattern when sending bytes to an I2C EEprom is:
Wire.beginTransmission(EEpromAddressonI2Cbus); // first byte in I2C buffer
Wire.write(highByte(memoryAddress)); // it takes two bytes to specify the
Wire.write(lowByte(memoryAddress)); // memory location inside the EEprom
loByte = lowByte(SensorReadingIntergerVariable);
Wire.write(loByte); // adds 1st byte of sensor data to wire buffer
hiByte = highByte(SensorReadingIntegerVariable);
Wire.write(hiByte); // adds 2nd byte of sensor data to the buffer
— add more Wire.write statements here as needed for your sensors —
The saved bytes must total of 1, 2, 4, 8 or 16 in each I2C transaction. Powers of Two byte increments are required because the # of bytes saved per sampling event must divide evenly into the physical page limit inside each EEprom, which is also a power of two in size. The code will display a warning on screen of bytesPerRecord is not a power of two.
Wire.endTransmission(); // bytes accumulated in the buffer are sent now
The key insight here is that the wire library is only loading the bytes into a memory buffer until it receives the Wire.endTransmission() command. So it does not matter how much time you spend adding (sensor variable) bytes to the transaction so long as you don’t start another I2C transaction while this one is in progress. Once that buffered data has been physically sent over the wires, the EEprom enters a self-timed writing sequence and the logger reads the rail voltage immediately after the write process begins. The only way to accurately gauge the state of a lithium battery is to check it while it is under this load.
NOTE: The data download function called in setup retrieves those separate bytes from the EEprom and concatenates them back into the original integer sensor readings for output on the serial monitor. So the sequence of operations in the sendData2Serial function must exactly match the order used in the main loop to load sensor bytes into the EEprom.
Adding Sensors to the Logger:
By default, the logger records the RTC temperature (#define logRTC_Temperature) at 0.25°C resolution and the battery voltage under load (#define logLowestBattery). These readings are compressed to only one byte each by scaling after subtracting a fixed ‘offset’ value. This allows about 2000 readings to be stored on the 4k (4096byte) EEprom which provides 20 days of operation at a 15-minute sampling interval.

That 4k fills more quickly if your sensors generate multiple 2-byte integers but larger 32k (AT24c256) EEproms can easily be added for longer running time. These can be found on eBay for ~$1 each and they work with the same code after you adjust the define statements for EEpromI2Caddr & EEbytesOfStorage at the start of the program.

The pullup resistors on the sensor modules can usually be left in place as the logger will operate fine with a combined parallel resistance as low as 2.2k ohms. No matter what sensor you enable, always check that the total of all bytes stored per pass through the main loop is 1,2,4,8 or 16 or you will get a repeating data error when the bytes transmitted over the I2C bus cross a physical page boundary inside the EEprom. This leads to a wrap-around which over-writes data at the beginning of the memory block. Also note that with larger EEproms you may need to slow the serial communications down to only 250k BAUD to prevent the occasional character glitch that you sometimes see with long downloads at 500k.
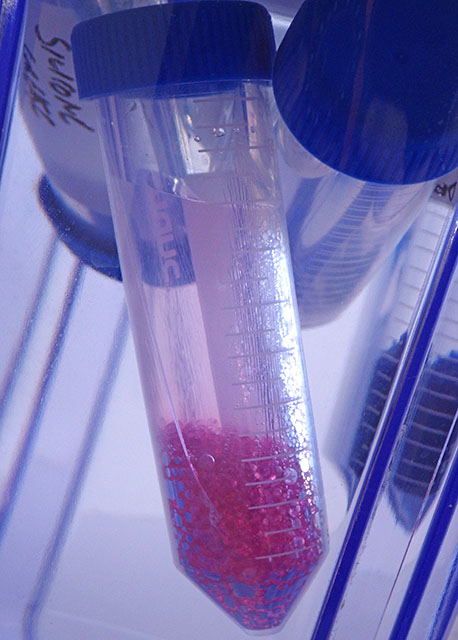
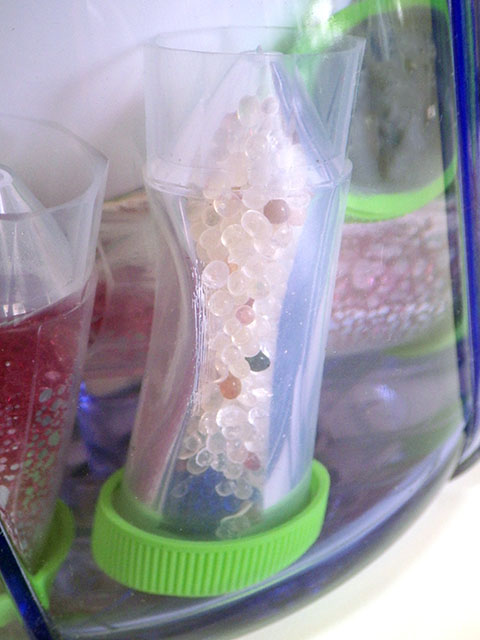
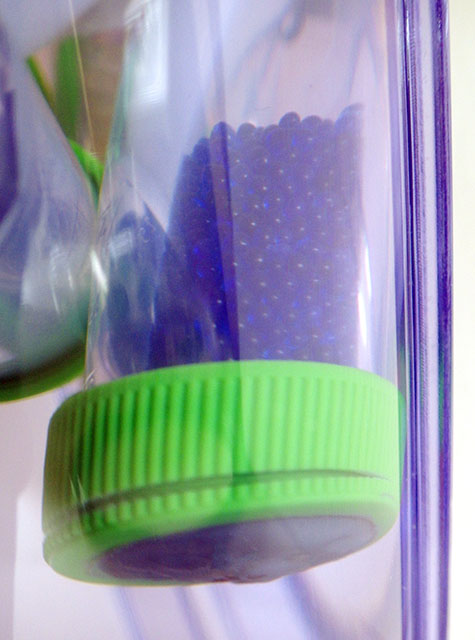
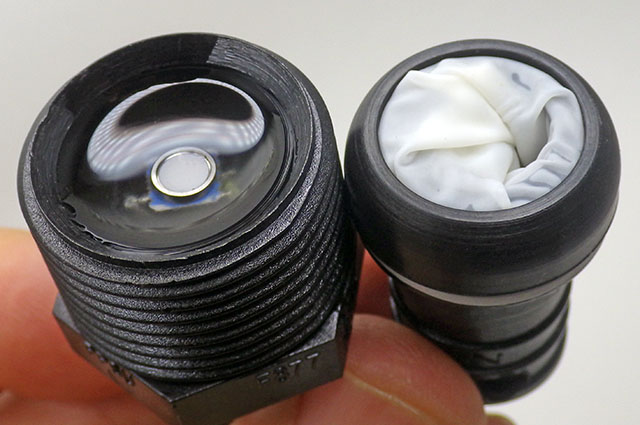
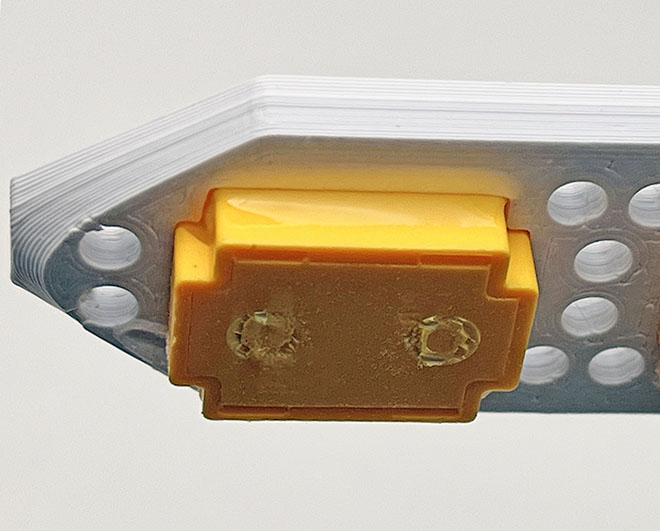
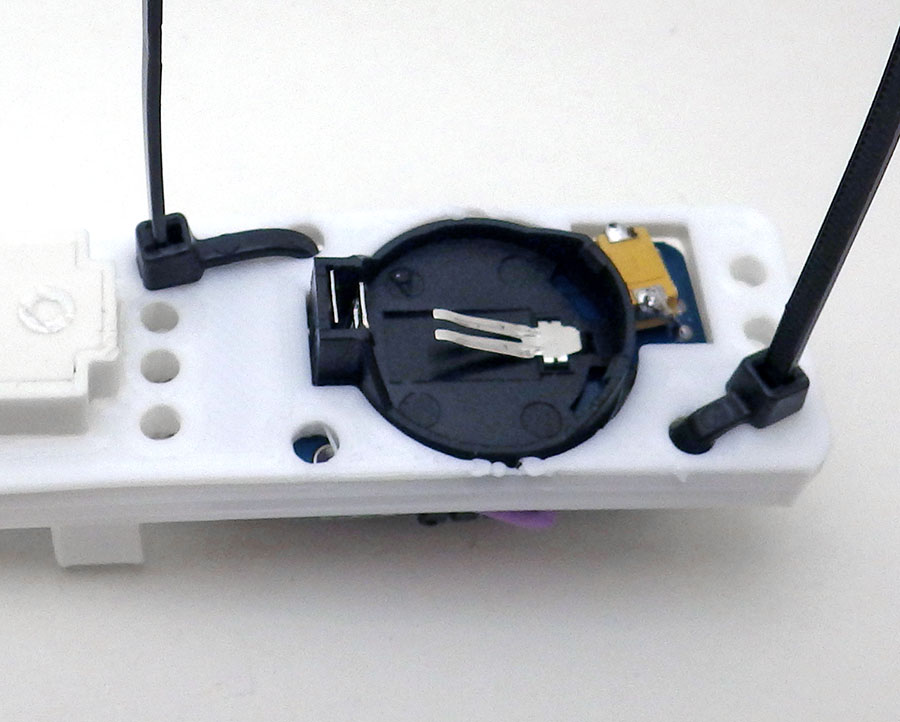
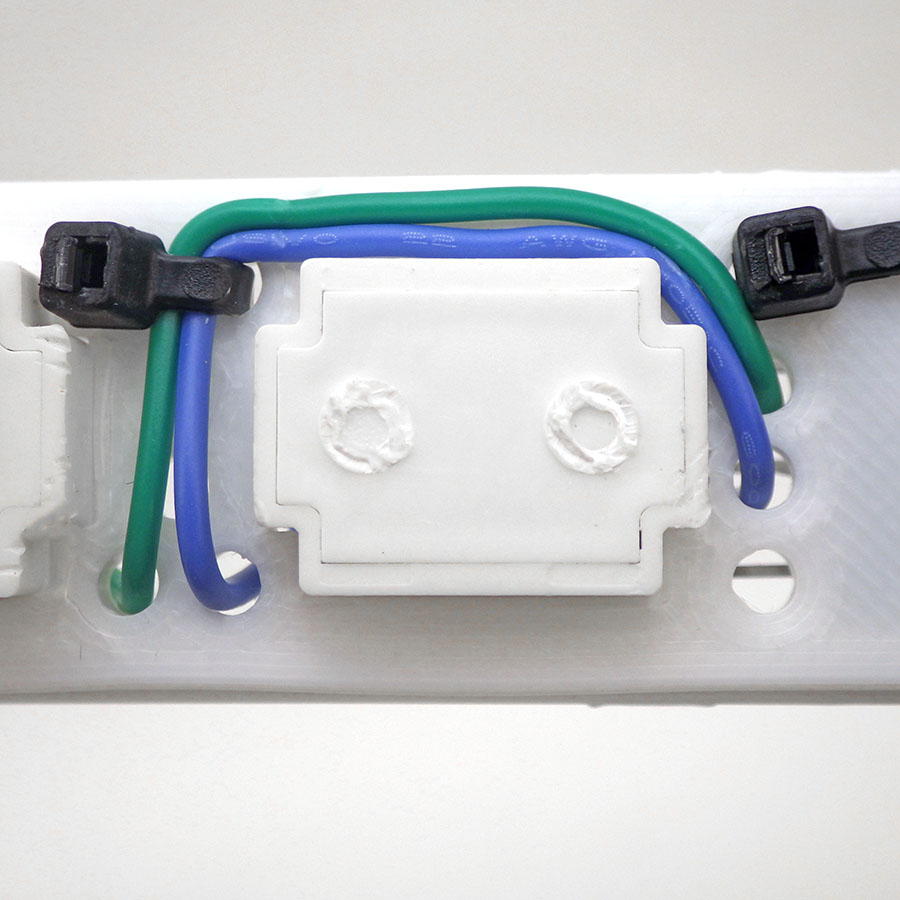
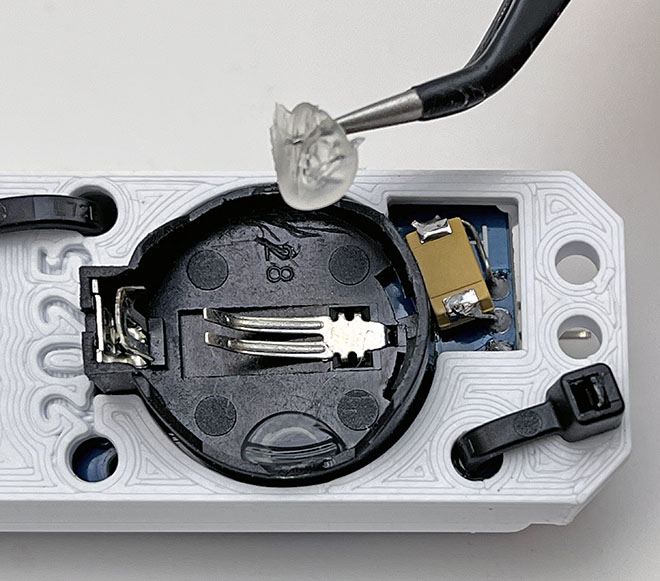
Perhaps the most important thing to keep in mind is that breadboards connect to the module header pins via tiny little springs which are easily jiggled loose if you bump the logger. Small beads of hot glue can be used to lock sensor modules & wires into place on the breadboard area. ALSO add another drop can help secure the Cr2032 battery in place for outdoor deployments. Some sensors can handle a momentary disconnection but most I2C sensors require full re-initialization or they will not deliver any more data after a hard knock jiggles the battery contact spring. So handle the logger gently while it’s running – no tossing them in a backpack full of books! Many students make additional no-breadboard loggers with fully soldered connections to the sensor modules if their final projects require rough handling. It’s also a good idea to put 1 gram (or 2 half-gram) silica gell desiccant packs with color indicator beads inside the body tube for outdoor deployments. A change in the indicator bead color is the only way to know if moisture is somehow seeping in, potentially causing runtime problems or early shutdown.
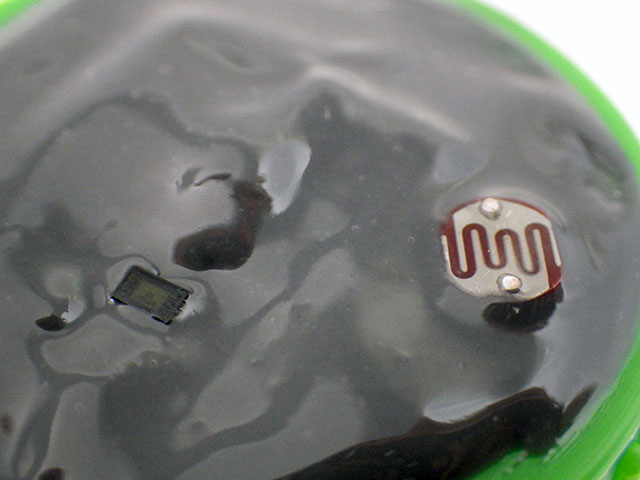
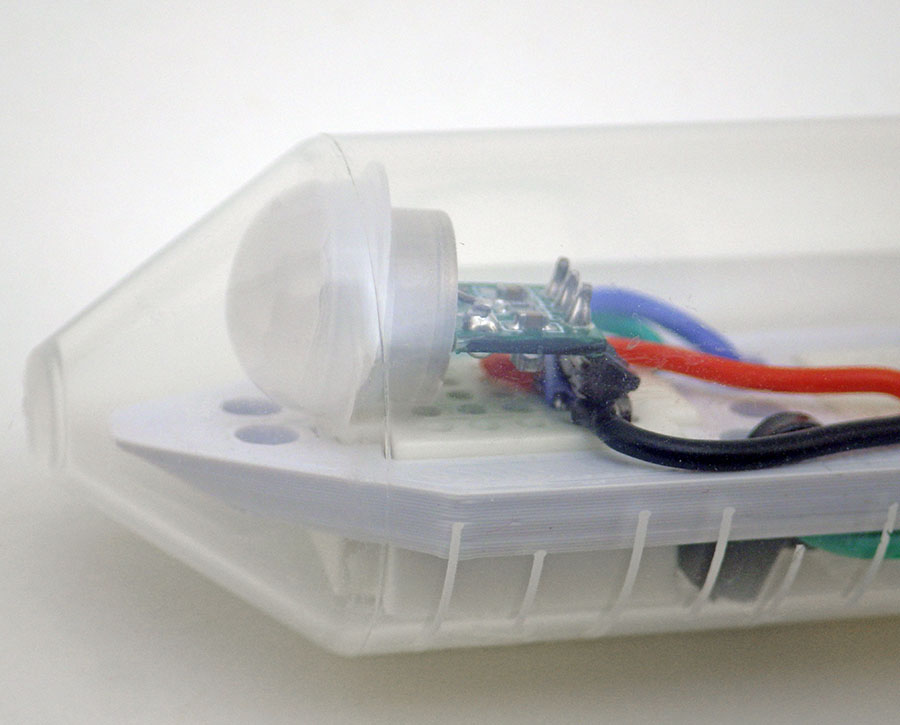
The base code also includes the DIGITAL method we developed to read the NTC/LDR sensors. On this new build we used the internal pullup resistor on D8 as a reference to free up another digital pin. The blue jumper wire on D3 (the 2nd external interrupt) can wake the logger with high / low signals. This enables event timing and animal tracking. Pet behavior is a popular theme for final student projects.

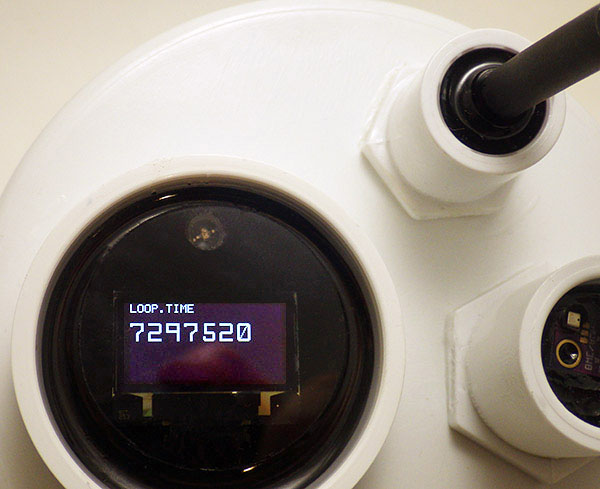
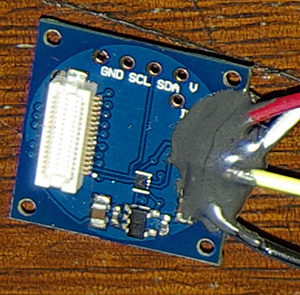
These 0.49″ micro OLEDs sleep at 6µA and usually draw less than a milliamp displaying text at 50% contrast. However, like all OLEDs they send wicked charge-pump spikes onto the supply rails. A 220 or 440µF tantalum right next to them on the breadboard will suppress that noise. Sleep the ProMini while the pixels are turned on to lower the total current load on the battery.

While I2C sensors are fun, we should also mention the classics. It is often more memorable for students to see or hear a sensors output, and the serial plotter is especially useful for lessons about how noisy their laptop power supply is…

If you run a lab tethered to the UART for power, then your only limitation is the 30-50 milliamps that those chips normally provide. This is usually enough for environmental sensors although some GPS modules will exceed that capacity. If a high-drain GPS module or a infrared CO2 sensor is required then use those you will need one of the previous AA powered loggers from the project.
When running the logger in stand alone mode your sensors have to operate within the current limitations of the CR2032 coin cell. This means sensors should take readings below 2mA and support low-power sleep modes below 20µA (ideally < 2µA). Order 3.3v sensor modules without any regulators – otherwise the 662k LDO on most eBay sensor modules will increase logger sleep current by ~8µA due to back-feed leakage through the reg. Sensors without regulators usually have -3.3v specified in the name, so a GY-BME280-3.3v humidity sensor has no regulator, but most other BME280 modules will have regulators.
The best sensor libraries to choose should support three things: 1) one-shot readings that put the sensor into a low power sleep mode immediately after the readings 2) give you the ability to sleep the ProMini processor WHILE the sensor is generating those readings and 3) use integer mathematics for speed and a lower memory footprint. Many sensors can read at different resolutions using a technique called oversampling but creating high resolution (or low noise) readings with this method takes exponentially more power. So you want your library to let you set the sensor registers to capture only the resolution you need for your application. The library should also have some way set the I2C address to match your particular sensor module as most sensors support different addresses depending on which pin is pulled up. Always have a generic I2C bus scanning utility handy to check that the sensor is showing up on the bus at the expected address after you plug it into the breadboard (and restart the logger).
Logger Operation:
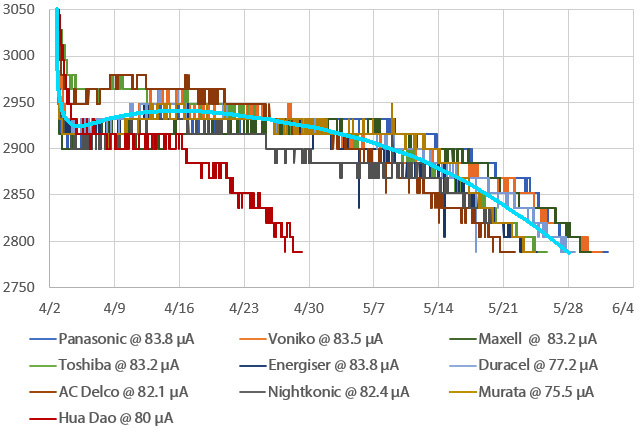
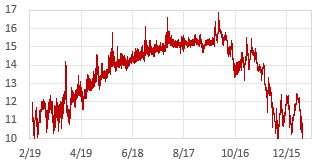
The ProMini/RTC stack usually draws peak currents near 3.3mA although this can be increased by sensors and OLEDs. The logger typically sleeps between 2 – 10µA with a sensor module attached. Four 3.5mA*50millisecond (CPU time) sensor readings per hour gives a maximum battery lifespan of about one year. So the run time is usually more limited by memory than the 100mAh available from a Cr2032. The tantalum rail-buffering capacitor only extends operating life about 20% under normal conditions, but it becomes more important with poor quality coin cells or in colder environments where the battery chemistry slows:
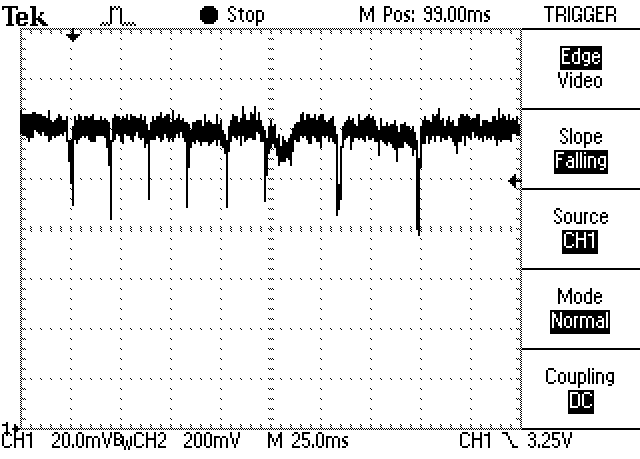
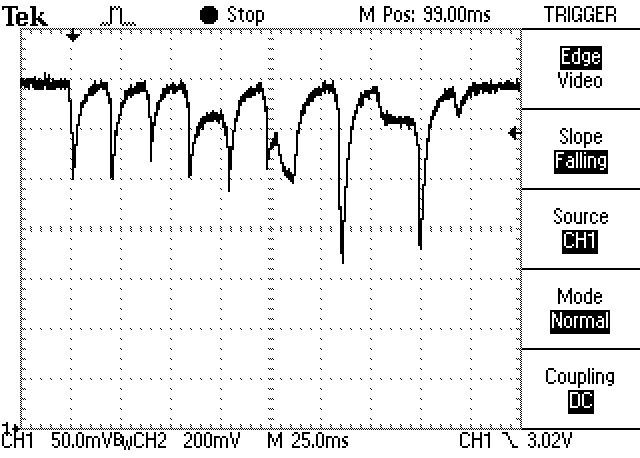

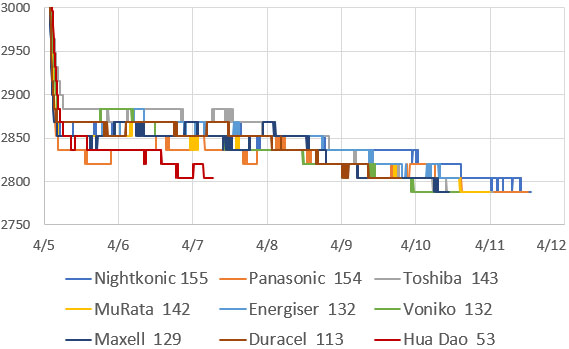
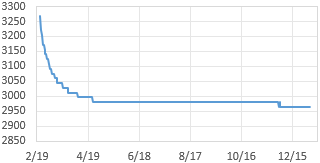
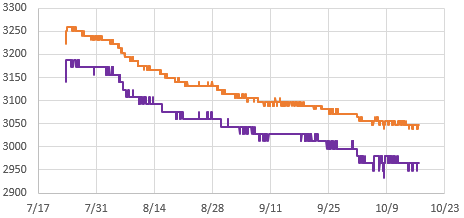
The logger sleeps permanently when the battery reading falls below the value defined for systemShutdownVoltage which we usually set at 2850mv because many 328p chips trigger their internal brown-out detector at 2.77v. And the $1 I2C EEprom modules you get from eBay often have an operational limit at 2.7v. If you see noisy voltage curves there’s a good chance poor battery contact is adding resistance: secure the coincell with a drop of hot glue before deployment.
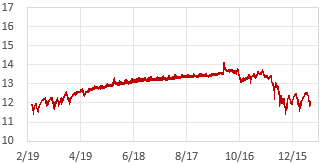
A typical student logger should draw between 2 – 10µA when sleeping between sensor readings, and if they are consistently several times that, an accidentally overheated rail capacitor is often the cause. After replacing that tantalum cap, try to leave the logger powered for 3 to 5 minutes so that the capacitor has time to fully saturate or the observed sleep current could read artificially high. Loggers built with ‘-M’ RTC chips sleep about 1µA higher than loggers built with ‘-SN’ chips:
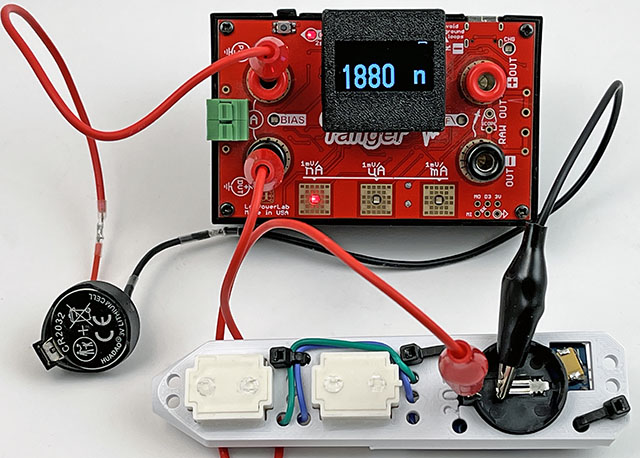
If a logger seems to have sleep current in the 600-700µA range, that’s often due to the RTC alarm being on (active low) which causes a constant drain through the 4k7 pullup resistor on SQW until that alarm gets turned off. Also check that the ADC is properly disabled during sleep, as that will draw ~200µA if it’s somehow left on. Occasionally you run into a ProMini clone with fake Atmel 328P chips that won’t go below ~100µA no matter what you do. But even with a high 100µA sleep current logger, a new Cr2032 should run the logger for about a month measuring something like temperature, and 10 days with a high power demand sensor like the BME280. This is usually enough run time for data acquisition within a course schedule even if the problem never gets resolved. A few student loggers will still end up with hidden solder bridges that require a full rebuild. This can be emotionally traumatic until they realise how much easier the process is the second time round. Once you’ve made a few, a full logger can usually be assembled in less than 1.5 hours and it’s faster if you make them in batches so that you have multiple units for testing at the same time.
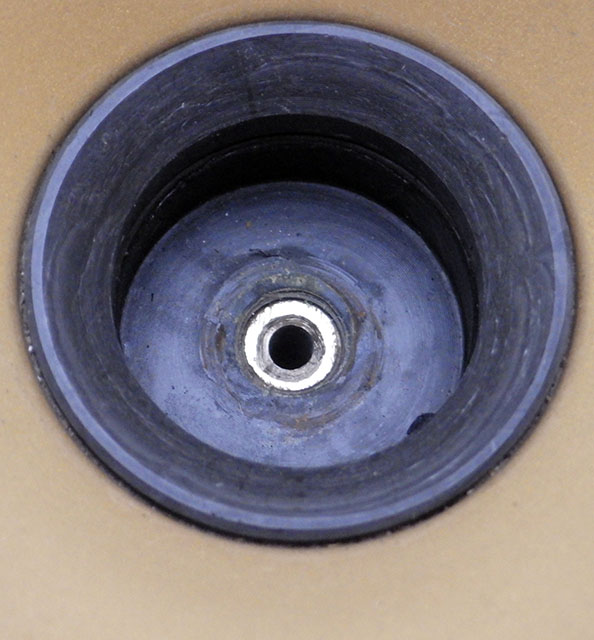
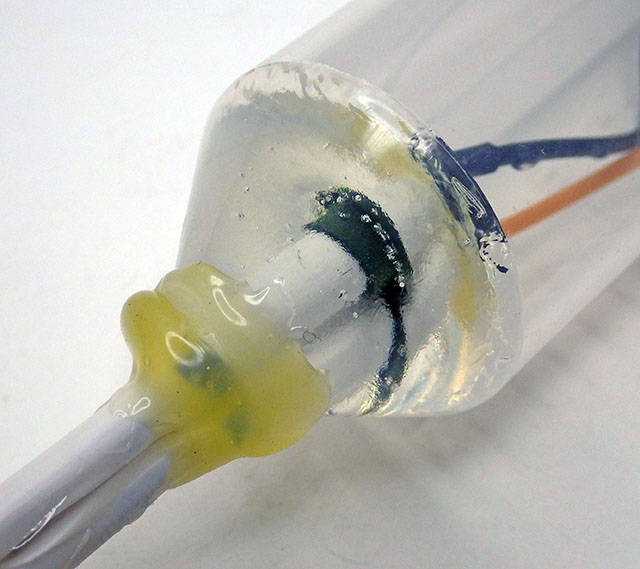
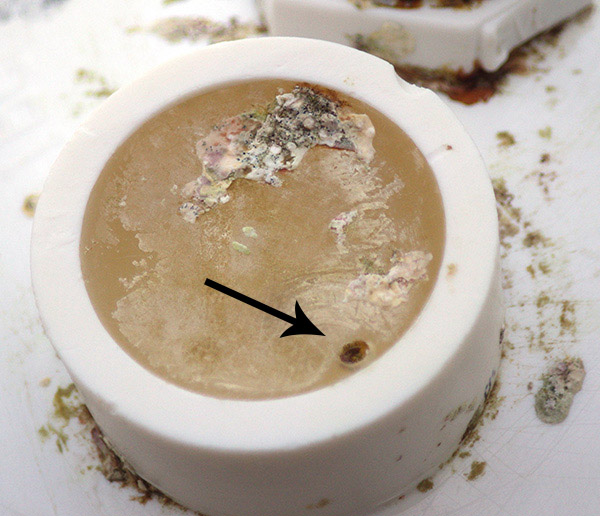
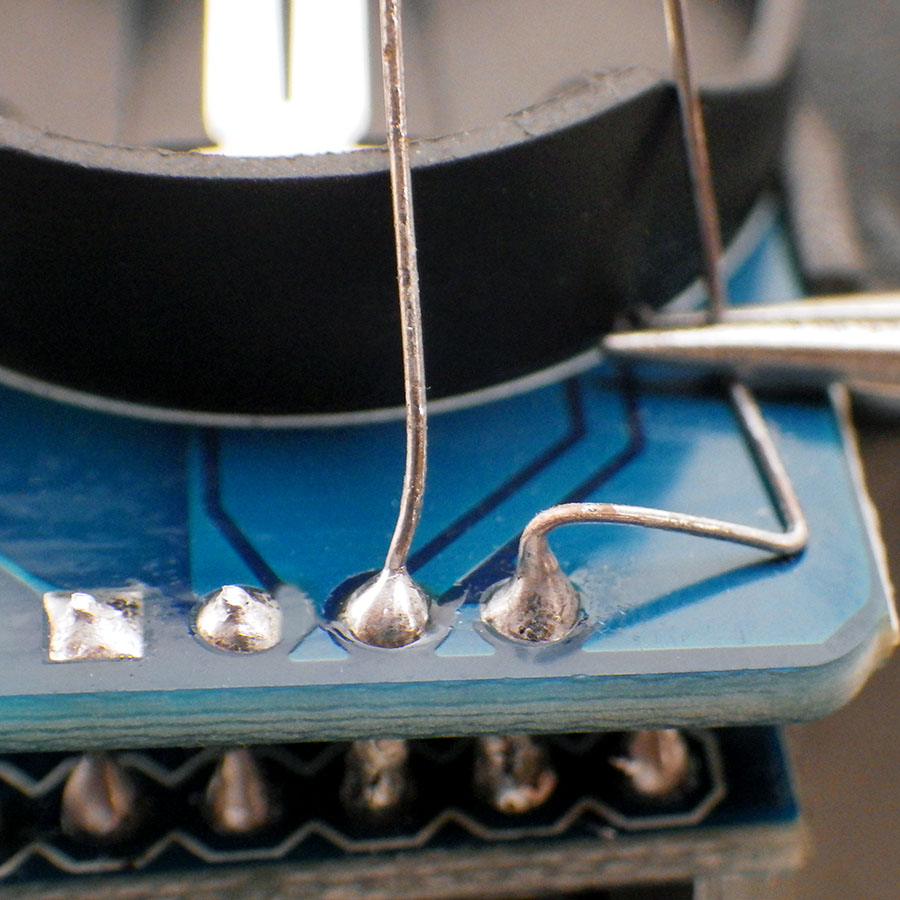
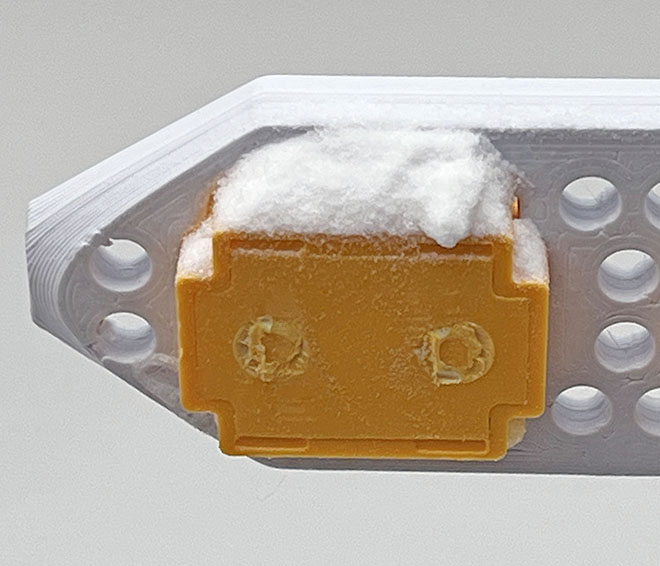
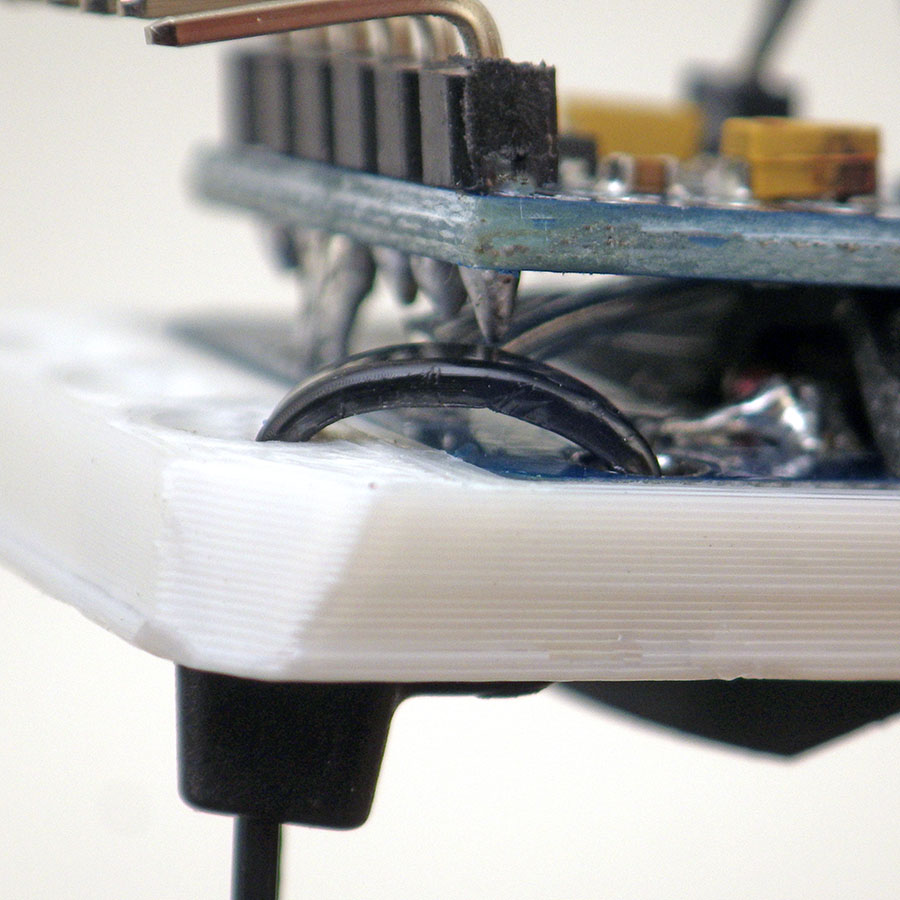
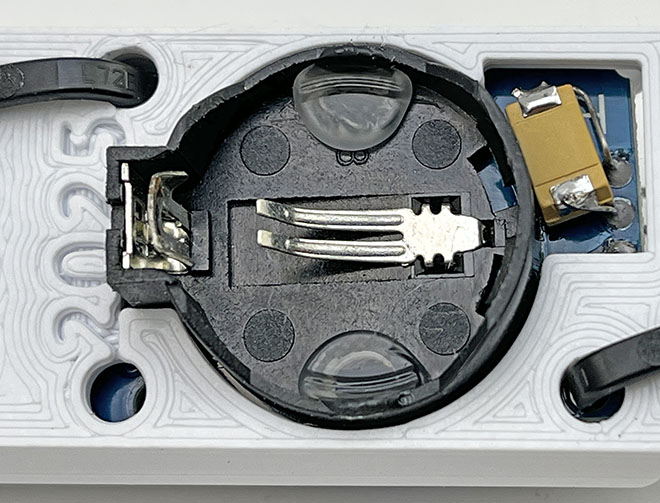
Weak battery springs, or sloppy plastic molding on the RTC module can make a logger vulnerable to bumps that disconnect power (causing the logger to shut down). Most of the time the battery can be secured reasonably well by simply by laying a line of hot glue along the top edge opposite the positive contact spring. This is easily removed after the deployment:
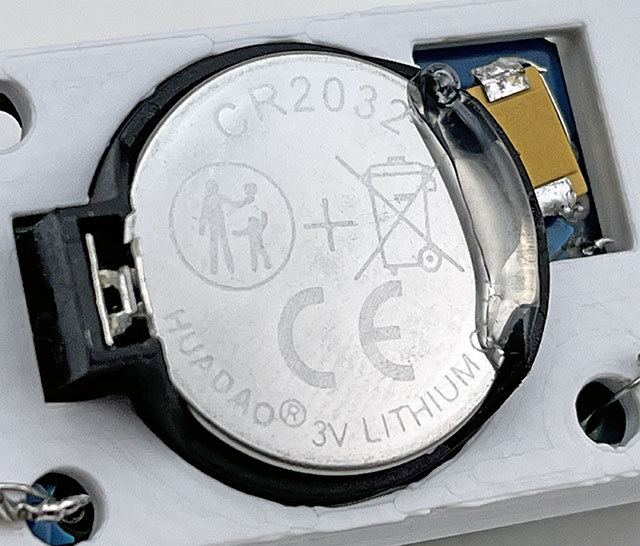
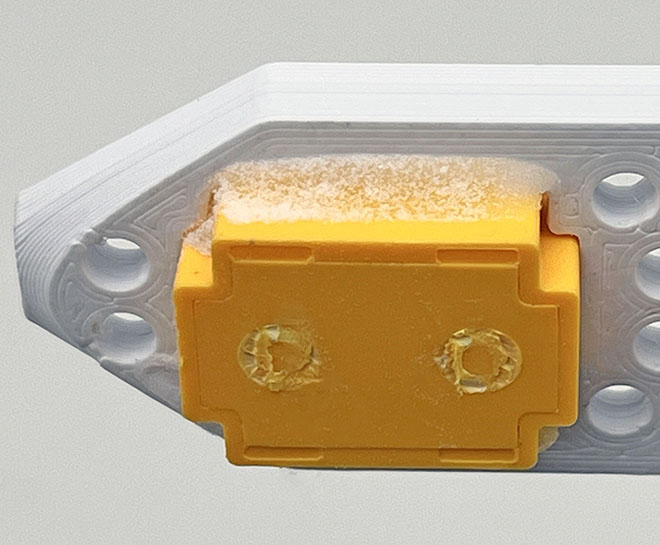
Occasionally you get an RTC module with a battery holder loose enough that the coin cell can actually rock from side to side, pivoting on the negative contact spring. This more extreme loose battery case requires two drops of glue under the coincell:
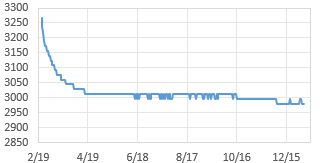
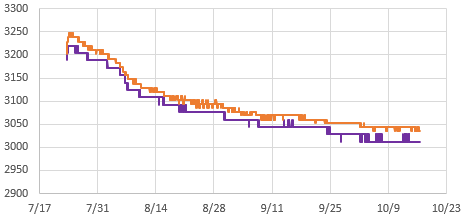
Sleep current is more of a diagnostic tool than a requirement: you can usually run a course without measuring these currents by simply running the loggers for a week between labs while recording the battery voltage. If that graph falls slowly to a plateau near 3.05v and then stays there for a long time – your logger is probably sleeping at the expected 3-5µA. However, if you can measure the sleep you add exercises to estimate logger run time with online battery life calculators like the one from Oregon Embedded. Order a box of 200 cheap coin cell batteries before running a course, because if a student accidentally leaves a logger running blink it will drain a battery flat in a couple of hours. This will happen regularly.
Running the labs:
The basic two module combination in this logger can log temperature via the RTC. This 0.25°C resolution record enables many interesting temperature-related experiments, for example:
- Log the temperature inside your refrigerator for 24 hours to establish a baseline
- Defrost your freezer and/or clean the coils at the back of the machine
- Log the temperature again for 24 hours after the change
- Calculate the electric power saved by comparing the compressor run time (ie: while the temperature is falling) before & after the change
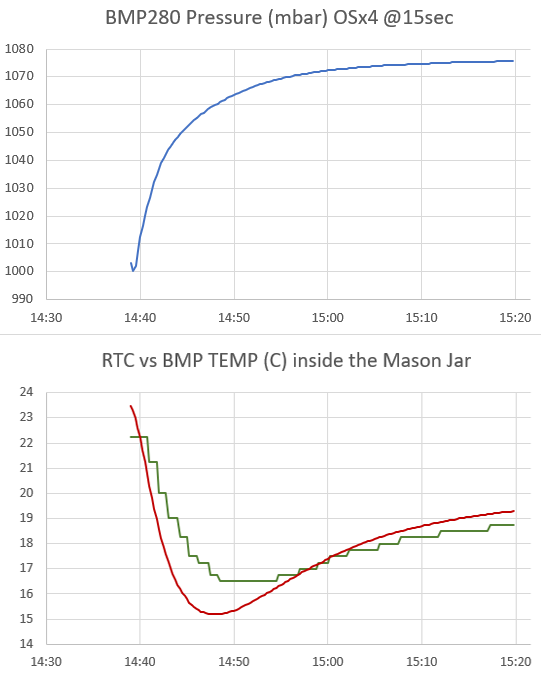
Note that the housing, the air inside it, and the thermal inertia of the module stack, result in ~5 to 10 minutes lag behind temperature changes outside the logger.

Through no fault of their own, students usually have no idea what messy real-world data looks like, and many have not used spreadsheets before. So you will need to provide both good and bad example templates for everything, but that’s easy enough if you ran the experiment a dozen times yourself at the debugging stage.
Even then students will find creative ways to generate strange results: by using a cactus for the evapotranspiration experiment or attempting the light sensor calibration in a room that never rises beyond 100 Lux. Deployment protocols (Sensor Placement, etc.) are an important part of any environmental monitoring course, and ‘unusable data’ ( though the logger was working ) is the most common project failure. It is critical that students download and send graphs of the data they’ve captured frequently for feedback before their project is due. Without that deliverable, they will wait until the hour before a major assignment is due before discovering that their first (and sometimes only) data capturing run didn’t work. This data visualization is required for ‘pre-processing’ steps like the synchronization of different time series and for the identification of measurements from periods where the device was somehow compromised. Your grading rubric has to be focused on effort and understanding rather than numerical results, because the learning goals can still be achieved if they realize where things went wrong.
Try to get your students into the habit of doing a ‘fast burn’ check whenever the logger is about to be deployed: Set the logger to a 1-second interval and then run it tethered to the Uart for 20-30 seconds (with serial on) . Then restart the serial monitor window to download those records to look at the data. This little test catches 90% of the code errors before deployment.
Important things to know:
Time: You need to start ordering parts at least three months before your class. If a part cost $1 or less, then order 3-4x as many of them as you think you need. Technical labs take a week to write, and another week for debugging. Expect to spend at least an hour testing components before each lab. The actual amount of prep also depends on the capabilities of your student cohort, and years of remote classes during COVID lowered that bar a lot. Have several spare ‘known good’ loggers (that you built) on hand to loan out so temporary hardware issues don’t prevent students from progressing through the lab sequence while they trouble-shoot their build. Using different colored breadboards on those loaners makes them easy to identify later. Measuring logger sleep current with a DSO 138 scope or a Current Ranger will spot most hardware related problems early, but students don’t usually get enough runtime in a single course to escape the bathtub curve of new part failures.

Money: Navigating your schools purchasing system is probably an exercise in skill, luck and patience at the best of times. Think you can push through dozens of orders for cheap electronic modules from eBay or Amazon? Fuhgeddaboudit! We have covered more than half of the material costs out of pocket since the beginning of this adventure, and you’ll hear that same story from STEM instructors everywhere. If you can convince your school to get a class set of soldering irons, Panavise Jr. 201s, multimeters, and perhaps a 3D printer with some workshop supplies, then you are doing great. Just be ready for the fact that all 3D printers require maintenance, and the reason we still use crappy Ender3V2’s is that there’s no part on them that can’t be replaced for less than $20. We bought nice multi-meters at the beginning of this adventure but they all got broken, or grew legs, long before we got enough course runs with them. We now use cheap DT830’s and design the labs around it’s burden-voltage limitations. Small tools like 30-20AWG wire-strippers and side-snips should be considered consumables as few of them survive to see a second class. Cheap soldering irons can now be found for ~$5 (which is less than tip replacement on a Hakko!) and no matter which irons you get the students will run the tips dry frequently. The up side of designing a course around the minimum functional tools is that you can just give an entire set to any students who want to continue on their own after the course. That pays dividends later that are worth far more than a given years budget.
All that probably sounds a bit grim, but the last thing we want is for instructors to bite off more than they can chew. Every stage in a new course project will take 2-3x longer than you initially think! So it’s a good idea to noodle with these loggers for a few months before you are ready to integrate them into your courses. Not because any of it is particularly difficult, but because it will take some time before you realize the many different ways this versatile tool can be used. Never try to teach a technical lab that you haven’t successfully done yourself several times.
A good general approach to testing any DIY build is to check them on a doubling schedule: start with tethered tests reporting via the serial monitor, then initial stand-alone tests at 1,2,4 & 8 hours till you reach a successful overnight run. Follow this by downloads after 1,2 ,4 & 8 days. On the research side of the project, we do short sample-interval runs to full memory shutdown several times, over a couple of weeks of testing, before loggers are considered ready to deploy in the real world. Even then we deploy 2-3 loggers for each type of measurement to provide further guarantee of capturing the data. In addition to assuring data integrity, smooth battery burn-down curves during these tests are an excellent predictor of logger reliability, but to use that information you need to be running several identical machines at the same time and start them all with the same fresh batteries so you can compare the graphs to each other. A summer climate station project with five to ten units running in your home or back yard is a great way to start and, if you do invest that time, it really is worth it.
Common coding errors like variable overflows usually generate repeating patterns of errors in the data. Random logger quits are usually hardware connection or bus-timing related and the best way to spot the problematic code is to run with “Made it to Point A/B/C/etc” comments printed to the serial monitor during the test runs. In battery operated stand-alone mode you can use different indicator LED colors for the different sections of your code. Then when the processor locks up you can just look at the LED and know approximately where the problem occurred.
Last Word:
Why did we spend ten years developing a DIY logger when the market is already heaving with IOT sensors transmitting to AI back-end servers? Because the only ‘learning system’ that matters to a field researcher is the one between your ears. Educational products using pre-written software are usually polished plug-and-play devices, but the last thing you want in higher education is something that black-boxes data acquisition to the point that learners become mere users. While companies boast that students can take readings without hassle and pay attention only to the essential concepts of an experiment that has never been how things work in the real world. Trouble shooting by process-of-elimination, combined with modest repair skills often makes the difference between a fieldwork disaster and resounding success. So sanitized equipment that generates uncritically trusted numbers isn’t compatible with problem-based learning. Another contrast is the sense of ownership & accomplishment that becomes clear when you realize how many students gave their loggers names and displayed them proudly in their dorm after the course. That’s not something you can buy off a shelf.
References & Links:
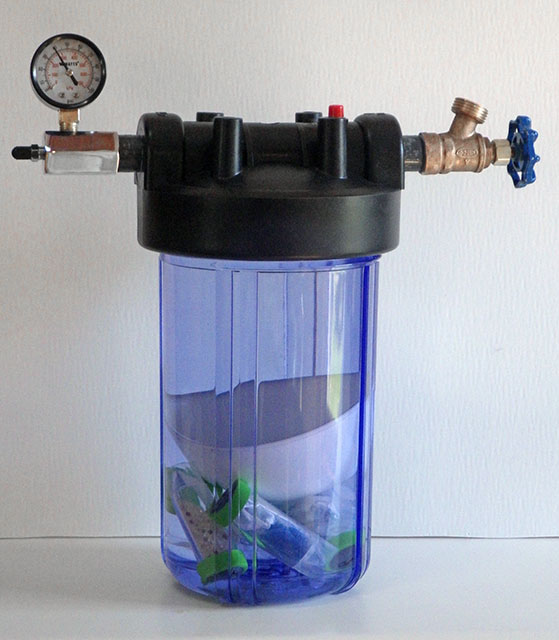
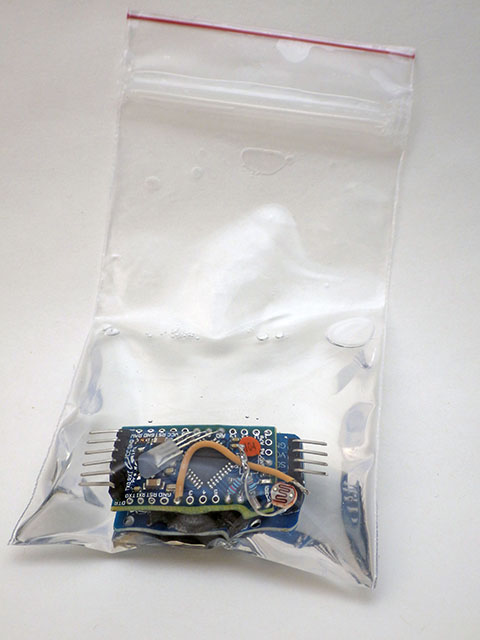
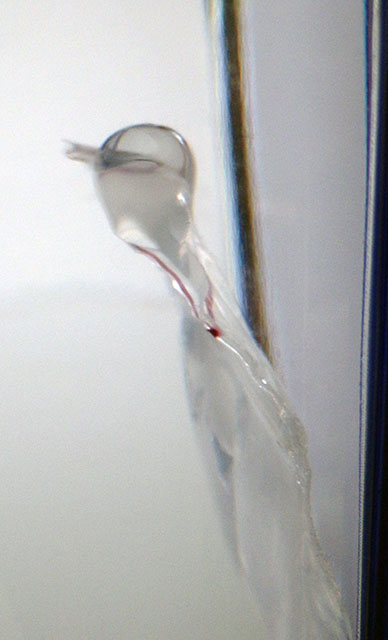
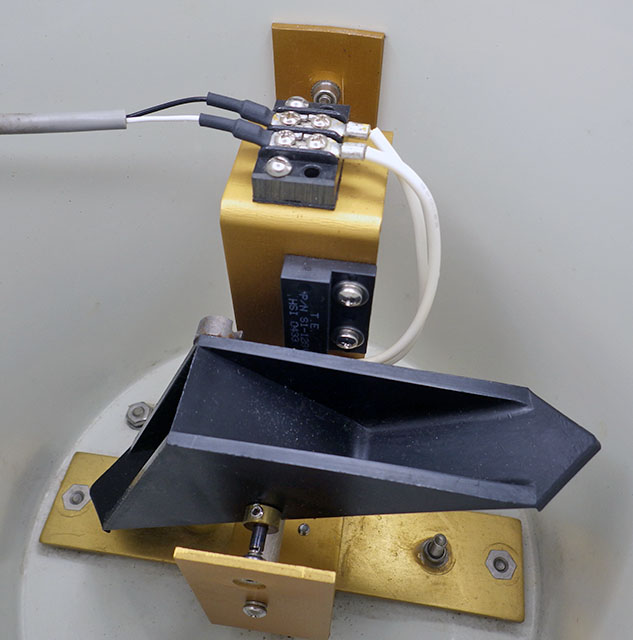
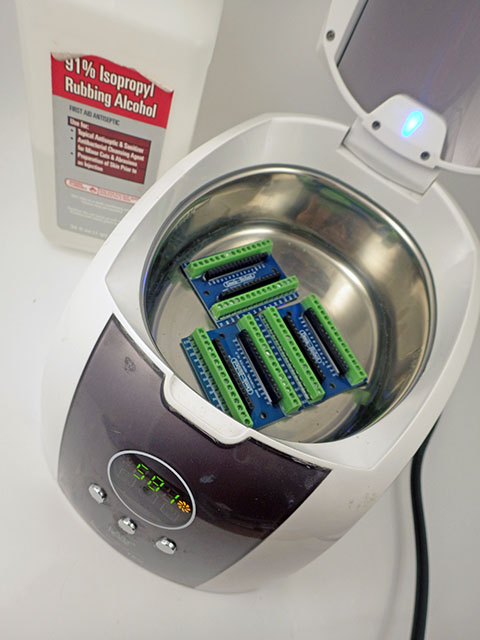
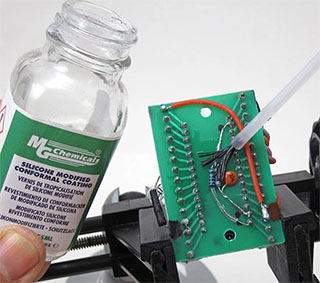
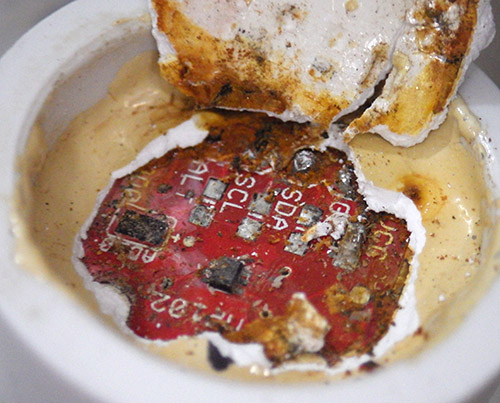
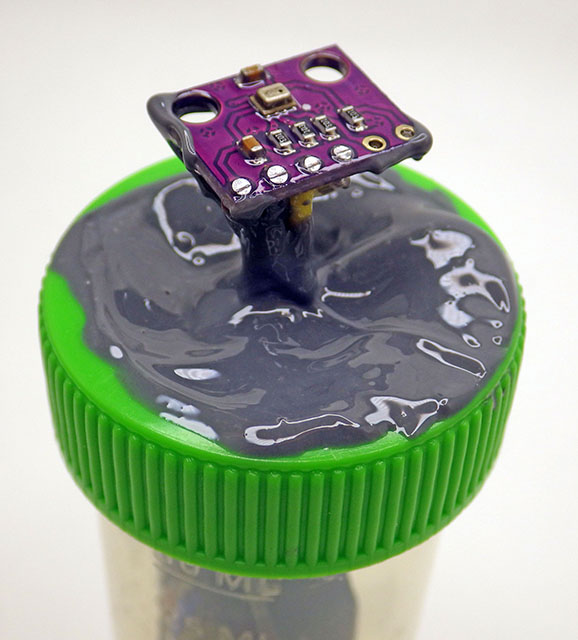
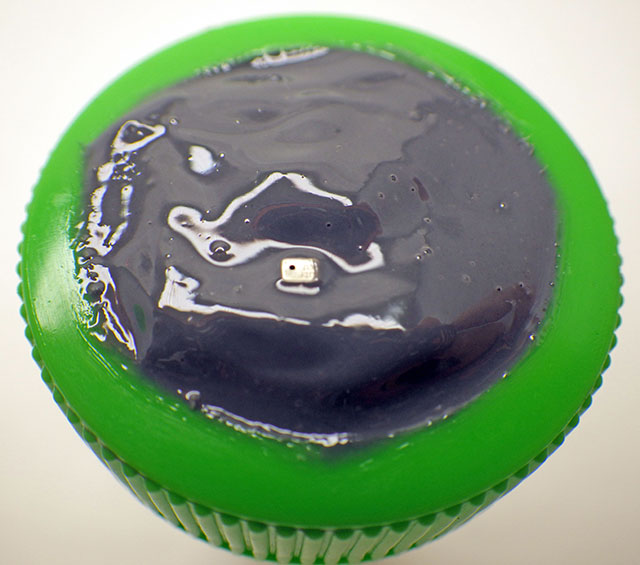
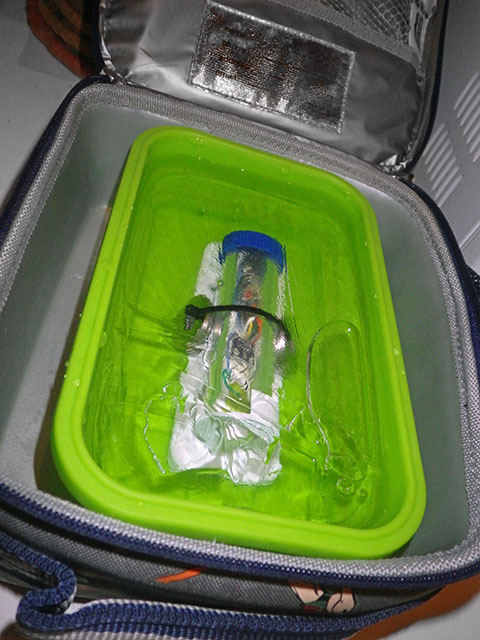
Waterproofing your Electronics Project
Successful field measurements when logging stream temperatures
Examples of soil temperature profiles from Iowa Environmental Mesonet
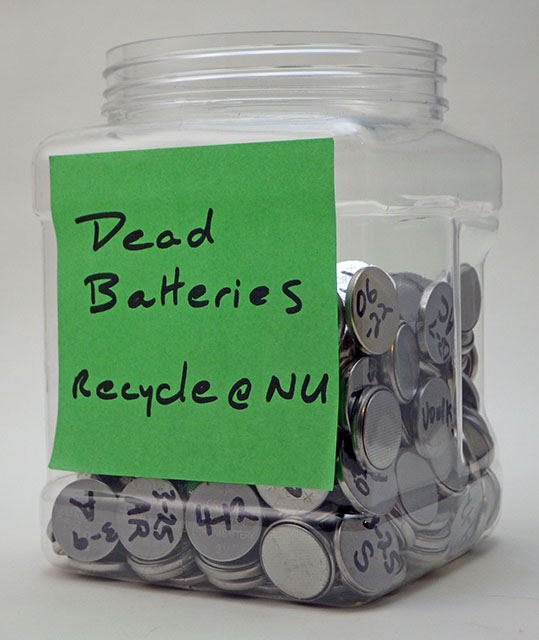
Oregon Embedded Battery Life Calculator & our Cr2032 battery tests
A practical method for calibrating NTC thermistors
Winners of the Molex Experimenting with Thermistors design challenge
Sensor Response Time Calculator
Calibrating a BH1750 Lux Sensor to Measure PAR
How to Normalize a Set of BMP280 Pressure Sensors
How to test and Calibrate Humidity Sensors (most RH sensors are not reliable outdoors)
Setting Accurate Logger time with a GPS & Calibrating your RTC
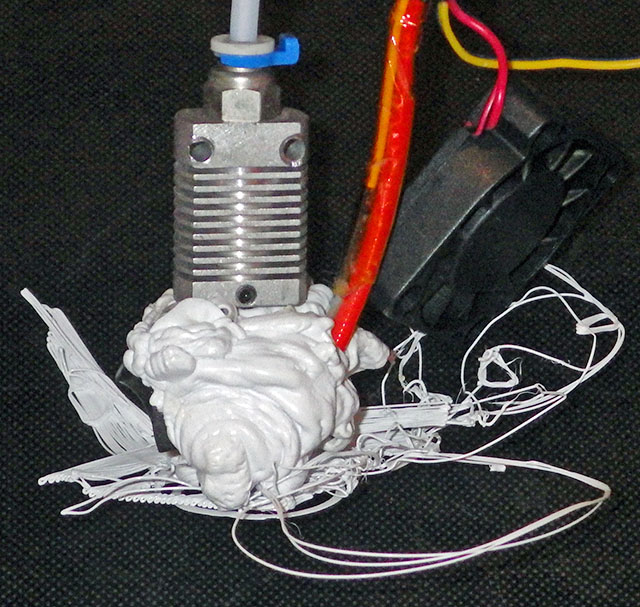
And: We made a Classroom Starter Kit part list back in 2016 when we were still teaching with UNOs and a post of Ideas for your Arduino STEM Curriculum. Those posts are now terribly out of date, but probably still worth a read to give you a sense of things you might want to think about when getting a new course off the ground. Those old lists also predate our adoption of 3D printing, so I will try post updated versions soon. The bottom line is that if you are going to own a 3D printer you should expect to have to completely tear down the print head and rebuild it once or twice per year. While they are the bottom of the market in terms of noise & speed, every possible repair for old Enders is cheap and relatively easy with all the how-to videos on YouTube. Those videos are your manual because Creality broke the cost barrier to mass market adoption by shipping products that were only 90% finished, with bad documentation, and then simply waiting for the open source hardware community to come up with the needed bug-fixes and performance improvements. X/Y models are more robust than bed-slingers, but our Ender 3v2’s have been reliable workhorses provided you stick to PLA filament. If you want a fast turn-key solution then your best option is one of the Bambu Labs printers like the A1 because they are essentially plug&play appliances. But if you enjoy tinkering as a way of learning, that’s Ender’s bread & butter. A bed level touch sensor is -by far- the best way to get that critical ‘first layer’ of your print to stick to the build plate and the E3V2 upgraded with a CRtouch & flashed to MriscoC is an OK beginners rig. Our local computer stores always seem to brand new 3v2’s for about $100 as a new customer deal but these days I buy cheap ‘for parts’ Ender5 S1’s from eBay for about that price and fix them up because 120mm/s is about the minimum speed I have the patience for. Now that multi-color machines are popular, what used to be high-end single-color machines are being discounted heavily so even brand new E5S1’s are selling for about $200 in 2025 if you look around. Having two printers means a jam doesn’t bring production to halt just before fieldwork, and by the time you get three printers the speed issues disappear and you can dedicate machines to different filaments. Keep in mind that no matter how fast your printer is capable of moving the print head, materials like TPU and PETG will still force you to print at much slower rates if you want clean prints with tight tolerances. To reduce noise, I usually put the printer onto a grey 16x16inch cement paver with some foam or squash ball feet under it.
Avoid shiny or multi-color silk filaments for functional prints as they are generally more brittle and crack easily. Prints also get more brittle as they absorb humidity from the air. If that happens, cyanoacrylate glue + baking soda can be used for quick field repairs. It’s worth the extra buck or two to get filaments labeled as PLA pro as they usually have better durability in trade for slightly higher printing temperature (as long as the company was not lying about their formulation). I use a food dehydrator I bought used from a local charity shop to dry out my PLA or PETG filaments if they have been open for more than a couple of weeks. Really hygroscopic filaments (like PVA, TPU or Nylon) have to be dried overnight before every single print. Most machines work fine with the defaults, but you can get great prints out of any printer provided the bed is leveled, the e-steps & flow are calibrated, and the slicer settings are tuned for the filament you are using. If you are using Cura there is a plugin called AutoTowers Generator that makes special test prints. You print a set of those (for temperature, flow rate and then retraction) and set your slicer settings to match the place on the tower where the print looks best. You may have to do this for each brand of filament as they can have quite different properties. I rarely use filaments that cost more than $15/kg roll because functional prints don’t have to be that pretty and you will be tweaking each design at least 10 times before you iterate that new idea to perfection. I stock up on basic black/white/grey on Amazon sale days for only $10/roll. Once you get the hang of it, most designs can use 45° angles and sequential bridging to print without any supports. Conformal coating or a layer of clear nail polish prevents marker ink from bleeding into the print layers when you number your deployment stations.

As a researcher, becoming functional with Tinkercad and 3D printing is a better investment of your time than learning how to design custom PCBs because it solves a much larger number of physical issues in experiments and deployment conditions. That said, it’s not usually worth your time to design things from scratch if you can buy them off the shelf. So people get into 3D printing because what they need does not exist or is outrageously expensive for what it does. All FDM prints are porous to some extent because air bubbles get trapped between the lines when they are laid down – so they are not waterproof like injection molded parts unless you add extra treatment steps. UV-resistant clear coating sprays are a good idea for outdoor deployment. I don’t have much use for multi-color printing, but when they advance to supporting multiple materials I will be interested because being able to print at TPU gasket inside a PETG housing in one shot would be quite useful. Anything you print in PLA will slowly creep and bend out of shape under full summer sun – even faster if the filament is not white..
If you are just getting started and looking for something to learn the ropes you can find useful add-ons to your printer on thingyverse or, you could try organizing your workspace with the Gridfinity system from Zack Freedman. You will also find lots of handy printable tools out there for your lab bench searching with the meta-engines like Yeggi or STLfinder. A final word of warning: this hobby always starts with one printer… then two… then… don’t tell your partner how much it cost.
Addendum 2026: Adding a note here that after years of successfully using the Silabs CP2102 on all three platforms we have started to see more issues installing the UART drivers on the Apple Macs. While the SiLabs VCP installer for Macs is universal, supporting both intel and M-series processors, the newer versions of that OS hide the pop-up buttons that you must press to [ALLOW] the driver installation to proceed. Depending on your OS version, this may appear in the Privacy & Security control panel, or you may have to go to: System settings > General> Login Items and then open: Extensions > Driver Extensions to see the [ALLOW] button during the instal. If you don’t press those hidden buttons the installer just hangs with no progress on screen. Another problem that we’ve only seen on macs is strange asymmetrical delays where uploads are working fine ,and any data from the logger downloads to the computer OK, but only single digits can be sent quickly from the send line at the top of the serial window to the logger. If longer text strings are entered the serial monitor freezes for a couple of minutes. If you just sit there waiting it does -eventually- get sent. I’m convinced theres yet another popup window that the system is hiding somewhere, and things can’t proceed until that times out.