Yearly Archives: 2015

Field Report: 2015-03-17 Drip Logger Service Visit

Everett was one of the grad students who also came down to help with the N.U. trip.

I pressed Everett (a Northwestern grad student) into helping me with the manual counts when I collected the drip loggers.

In March my wife led a Northwestern University earth sciences trip to the Yucatan Peninsula. While she was busy with all the necessary preparations for the students who would be arriving shortly, I slipped away for a couple of hours to retrieve the loggers we left at Rio Secreto last year. With so many new units in that deployment, I was really chomping at the bit to see how they faired.

As usual we had some good news, and some bad news from the deployed loggers. Actually, we probably set a new record on the bad news side of things as the two relative humidity loggers that I cobbled together before the December trip went bananas as soon as we brought them into the caves. The HTU21D sensor on unit 030 died on Dec. 20th, one single day after it was deployed, while the sensor on 028 lasted for four days before it pooped out.  Both delivered crazy readings the whole time even though they seemed to be working fine on the surface.

capt

Even potted under epoxy, the solder contacts were severely oxidized.  I suspect that moisture was able to “creep” along the surface of the breakout board, because of the area exposed around the humidity sensor.

The epoxy in the sensor wells had turned yellow & rubbery, even though it was clear and rock hard when the units were deployed . But these sensor caps were assembled just days before the flight, and I used 5 minute epoxy to speed the build, rather than the usual 30 minute stuff. So I am thinking that the moisture resistance of the faster curing epoxies is much lower. Perhaps it’s time for me to investigate some new urethane options with lower permeability? It is also possible that PVC solvent residue interfered with the epoxy’s chemistry because I built them so quickly.


Dispite its "splash proof" rating, this MS5805-02 quit after one month in the cave

Despite its “splash proof” rating, this MS5805-02 died after one month  in the cave. It had no “direct” water contact.

The loggers kept running after the R.H sensors stopped working but they eventually both quit long before draining the AA battery packs, which leads me to conclude that rusty contacts eventually shorted the I2C bus, preventing the RTC alarms from being set. We also lost one of the pressure sensors, and a TMP102 board. In fact the only sensor still fully operational when I pulled the loggers was the MS5803-02 pressure sensor, once again showing just how robust those pressure sensors are under their white rubber caps.


PressureSensorOnPalaparoof

The white ball is an older first gen housing for an underwater pressure unit, and the black cylinder above is a drip sensor, acting as a crude rain gauge. I don’t know who collected the rain water.

I left a new RH&Pressure unit in the cave, which was made with E30CL and had more than a month of test runs under its belt before going into the field. Even with fully cured epoxy, there is still the possibility that moisture will penetrate through the exposed RH sensor, so I will look into moving that sensor off the main housing for my next builds.

We also had some sensors on the surface during this last deployment, and they faced dramatically different challenges under the full tropical sun.  The pressure logger had been re-purposed from a four month cave deployment. It sported a DS18b20 temp sensor, and an MS5803-05 pressure sensor, which both performed beautifully in the underwater environment.

But as you can see from the pressure record (in mBar) things did not go so well this time around:

DIY Cave Pearl data loggers based on Arduino Microcontrollers

I was expecting daily fluctuations of a few millibars so there is no way I can believe that local highs reached 1200 mBar…but what happened?  This pressure sensor had been used first for an under water deployment so it had a layer of Qsil silicone over top if it. This caused a -50 mbar offset, but did not seem to give us any other problems in the thermally stable cave environment.  But with full sun exposure this logger saw huge daily temperature variations (detailed below) I believe this caused the silicone above the sensor to expand and contract; exerting enough physical pressure to overwhelm the more subtle barometric readings. Unfortunately I did not have time to look at this data while we were in the field, so the unit was redeployed, although this time in a more sheltered spot under the palapa roof.

Now for the good news:

The drip sensor which we left beside that pressure logger on the surface delivered a respectable record despite the fact that it had no collecting funnel:

DIY Cave Pearl data loggers based on Arduino Microcontrollers

That peak of 8000 counts (/15 min.) is about 9 drips per second on the surface of the unit which, with all the delays I put in the code to suppress double count artifacts, might be approaching the max response of the sensor itself. With no way to capture the water, gentle foggy rain events would not have triggered the impact sensor, so there is a good chance that a significant amount of precipitation did not get recorded. But what makes this record so impressive to me is the RTC temperature log from inside the housing:  (in °C)

DIY Cave Pearl data loggers based on Arduino Microcontrollers

The black end cap actually started melting grooves into the white PVC of the drip logger housing.

The black end cap actually started melting grooves into the white PVC of the drip logger housing.

The spec sheet maximum for the DS3231 is 70°C,  and the Arduino mcu‘s limit is 85°C.  Even so, with daily peaks reaching nearly 60° I am quite surprised that the batteries did not pop.  The little logger did not escape this trial by fire completely unharmed, as the micro SD card went from a nice low current sleeper to pulling around 1 mA all the time. The data was intact, but I can only surmise that the high temps cooked some of its control circuitry. The upper ABS surface also changed from a neutral frosted white to a slightly fluorescent green/yellow color, presumably because of intense UV exposure. After replacing the batteries & SD card, the unit was put back on roof for another run.  Just to be on the safe side I added a second unit in case that first one gives out.

While I leave heavy weight analysis of the hydrographs to the expert on the team, I couldn’t help peaking to see if these surface storms affected the in-cave drip flow rates. I was quite surprised to see that the precipitation events had small effects on some of the counts, while barely registering as a blip on others that were quite nearby. This is the record from DS20 (15 min bins, with a purple overlay of surface record that is not on the same scale):

DIY Cave Pearl data loggers based on Arduino Microcontrollers

And this is the record from DS02, located less than 5m away in the same chamber:

DIY Cave Pearl data loggers based on Arduino Microcontrollers

Given the thin soils of the area,I suspect that much of that brief rain evaporated shortly after surface contact, or the dry season vegetation was just sitting there like a sponge, able to absorb most of it quickly.

The whole group of loggers represents a mixed bag of first and second generation builds with many different “mini” form factor Arduino boards in them. I left the batteries in a couple of units back in December so I could see some longer term battery discharge curves:

DS01_02_Longruntest

These two units were using three lithium AA’s, which I knew from the 1st generation test results, are about 2/3 depleted when they hit that 5000 mV shoulder. This tells me that DS01 would probably have delivered nine months of operation on these cells. This is very good news because even the loggers I built with no-name eBay clones (MIC5205 v.regs) sleep around 0.33 mA if they have good SD cards. So it should be safe to put them on a six month rotation schedule.

In addition to their drip counts, several of the loggers were running with different eeprom buffering levels to help me understand how this affected the power budget. I won’t wade into all of that data here but two of the most directly comparable records are from units 26 &  27:

Logger # starting voltage sleep current
# records buffered  V.drop/8500 records
26 5243 mV 0.28 mA 512 30 mV
27 5198 mV 0.26 mA 96 33 mV

Unit 26 was handicapped by a slightly higher sleep current and a starting voltage above the lithium plateau (I often see a small quick drop on 3xAA lithiums above 5200 mV) The fact that it still delivered a smaller voltage drop on the batteries over the three month run implies that increasing the size of the eeprom buffer does improve performance. Logger 26 had a 32K eeprom so it only experienced 16 SD card writing events, while the smaller 4K buffer on unit 27 required 87 SD writes.  Both loggers created six separate log files during the run and the cumulative drip counts were comparable.  It’s still a close call, and the increased buffering does not providing a huge savings, perhaps on the order of 5-10%.  Since the extra I2C eeproms only cost $1.50, and the coding to support them is trivial, I consider that to be an easy way to get another month of run time. As with the buffering tests I did back in 2014, it’s clear that all those eeprom page-writes (3mA x 5msec  + mcu uptime) take a significant amount of power. But at least they are not subject to the random latency delays you see with SD cards.

I added larger LED limit resistors to each logger on this service visit, so even if the drip rates pick up dramatically during the wet season, power used by the interrupt will be reduced compared to the runs since August. All units that were capable are now buffering about five days worth of data to the eeproms. The current crop of “best builds” with Rocket scream boards and pin-powered RTC’s, are getting down to 0.15 mA, implying that they should be good for a year long deployment provided the SD cards & sensors hold out. Of course I don’t count chickens anymore, no matter how good the numbers look. Though all units delivered a full data set on this deployment, two of them suffered dramatic increases in sleep current when their ADXL’s suddenly started consuming more power. You can easily spot when these kind of sensor failures occur by looking at the power supply voltage log:

020_SleepCurrentChange2

I am sure there are more gems buried in the data, which I will post here as they are uncovered.

<— Click here to continue reading the story—>

Calibrating DS18B20 1-Wire Sensors with Ice & Steam point measurement

You will need to crimp the ends and give each sensor a serial number, but don't label the sensor itself as I have in this photo or the will fall off during the steam point testing.

Give each sensor a serial number, but don’t label the sensor itself as I have in this photo or the labels will just fall off during the steam point testing. After adding crimp pins to the wire ends it becomes easy to gang them together on a breadboard for testing. Despite Maxim’s warnings, I had star configurations above 20 sensors reading well with them close together like this.

I’m probably not the first person to note that sensor calibration is one of the big differences between the mountains of data coming from the citizen science movement and that produced by research professionals. (…mea culpa…) After opening this can of worms, I think I am beginning to understand why: Accuracy calibration rapidly gets complicated, or expensive, and often it’s both at the same time. By the time you have what you need to do the job, the difference between a $0.30 sensor, and a $30 sensor, is pretty insignificant. So it’s no surprise that few people work on calibration methods for low cost sensors, or why normalization approaches are used instead.

But I am already spending far too much on this little hobby, so despite knowing that the folks over at Leighton Telescope managed to get their DS18b20’s to about ±0.01°C with a NIST traceable thermometer, I thought I would see how far I could get on my own.  I suppose if I was an alpha geek,  I would make my own platinum RTD  and calibrate the sensors against that.  But I’m not quite there yet. I should also point out that numbers are not my strong suit, so there could be some significant errors in what I have cobbled together here and I appreciate any feedback to help correct those…

The first thing that occurs to me is: Can you read the temperature more accurately  by averaging a bunch of these sensors together?  If the readings from the sensors have a mean and standard deviation, then as the number of sensors increases then the standard deviation should decrease…right?  The data sheet gives you a sense of how far you can get with that approach, because I assume that Maxim/Dallas used a very large number of sensors to derive their typical performance curve:

DS18B20_TypicalPerformanceCurve

But if I understand what people say about this graph, the only reason the 3 sigma spread on that graph looks better than ±0.5 at 20°C is because the errors in the sensors used to derive that curve were truly random, and had a nice Gaussian distribution around that mean. However, since the actual batch of sensors I am holding in my hand is likely from the same production run, it is subject to systematic errors that don’t cancel each other out so nicely. And since I bought them on eBay, there is also a chance that they might be fake DS18b20’s.  So I could have no idea how my mean error line was related to the one on Maxim’s graph.

But there are still useful things you can do with this kind of averaging:

test

The front temperature display on this clunky old Fischer Scientific was off by more than 2°C, and it was missing a foot. While it’s hardly a temperature chamber,  the insulation and covering lid produced a slow cooling curve, so I could be reasonably confident the sensors were being exposed to the same temperatures. Don’t use data from the rapid heating cycle, because temperatures are likely to be unevenly distributed in the bath.

First of all you can get rid of the bad sensors by selecting a group that has a consistent behavior over the temperature range you are looking at, with readings that fall within the manufacturer’s specifications.  To get enough data for this kind of assessment, I needed to run at least 10 sensors at the same time so that the average had some statistical weight. For this testing I picked up an old five Litre isotemp bath (you can find them for $25-$50 on eBay) but you could just as easily do this with hot water in a styrofoam cooler. With about 20 sensors on a breadboard in a star configuration (4.7k pullup), I brought the water bath up to a stable 40°C, and then moved the entire thing out into the fridge and left it logging during the cool down. The lid was on, and I had several towels over top to make the process go as slowly as possible.  It took 12 to 24 hours for each batch of sensors to reach ~5°C.

With this data in hand, I looked at the residuals by subtracting each sensors raw reading from the average of all the sensor readings.  This exercise sent one DS18 straight into the bin, as it was more than 2.5°C away from the rest of the herd for its entire record.  Another was triaged due to a strange “hockey stick” bend in it’s residual around 25°C.  I threw out the data from those two duds, and recalculated the average & residuals again.  Just to be on the safe side I decided not to epoxy any sensors into a long chain if they were more than 0.3°C away from the average. (although I am still wondering whether eyeballing residuals like this is enough to exclude the right outliers?)

You can then normalize the sensors to each other by fitting a quadratic equation to a graph of each sensor & the overall average line. Excel can generate these coefficients for you with the linest function, or it can solve the quadratic with Goal Seek.  But the easiest method I found was make a 2nd order (but not higher) fit with the chart tool’s trendline function. Make a scatter plot of the data with the averages on the Y axis, and data from one individual sensor on the X axis.  Then right click on the data points to select them, and choose ( Add Trendline ) from the pull down menu, with the [ ] Display equation on chart tick box checked.      (here is an example of the technique using an older version of Excel)

The equation you see displayed will convert that particular sensors output into corresponding temperatures on the average line. With this transformation, each sensor will yield the same reading if it is in the same thermal environment, and you can accept that any differences between two sensors in the chain represent real differences in temperature.

This kind of normalization is as far as most people go. However for the reasons I outlined above, we can’t be sure that we were using a valid sample for that mean data. In my tests it looked like I did not have an equal distribution of sensors above and below the average line, so I still didn’t really have a handle on whether this was improving the absolute accuracy. (I will post some example graphs of this later…)

That brought me to calibrating the DS18b20’s against intrinsic physical standards which rely on the fact that during a phase change  (melting, freezing or boiling)  adding and removing heat causes no change in temperatureIn fact those heating curve plateaus are known so precisely that they use them at NIST to calibrate the expensive thermometers that I am trying to avoid buying.  Today they do this with Gallium‘s triple point (29.7666 °C) and the triple point of water (0.010 °C), but they used to use Gallium’s melting point plateau. (29.7646 °C)  Gallium sells for less than a buck a gram on Amazon and a density of about five grams per cubic centimeter means a block big enough to surround one of the DS18’s is almost within a DIY’ers budget. (100 grams will make a disk about two inches across and a quarter inch thick) But considering that commercial Ga melt cells cost about three grand, either that stuff is nasty enough to get me into trouble, or you need allot more more of it, at higher purities than you can buy on eBay to build one.  Then there is the significant time it would take to refreeze the block again for every single sensor. And finally, all exposed metal must be carefully lacquered as Gallium will form an amalgam with many metals, and any dissolved metals will compromise the purity of the bath, shifting the melting point. And you would probably have to cover everything with Argon wine preserver.

So I went hunting for other substances I could use for a mid range calibration point and found several good boiling points such as: Ether (35 °C), Pentane (36.1°C), Acetone (56 °C), and Methanol (66 °C). Despite my enthusiasm over coffee the next morning,  all of them were summarily rejected by my wife, who strongly suggested that I look for calibration procedures that do not create large amounts of highly explosive vapor. Given how unstoppable she usually is in the pursuit of  good data, I was not expecting this outburst of common sense 🙂

So I looked at the other primary standard used to calibrate pt100’s. Turns out it is possible to make your own triple point cell, and if that’s not good enough for you,  Mr. Schmermund also produced plans for a freezing point of mercury cell (–34.8 °C) (See: “Calibrating with Cold”, Shawn Carlson, Scientific American, Dec. 2000 issue).  However the local 7-11 was fresh out of liquid nitrogen when I checked, and I had this gut feeling that risking mercury induced brain damage was not going to pass the cost/benefit analysis either. If I actually did need sub zero calibration I think I would try using Galinstan, (−19 °C) which is now replacing mercury in glass thermometers.

If you can pre-chll the sensors in one corner of the bath, the whole process goes much faster.

Pre-chilling the sensors in one corner of the bath makes the process much faster. Hold the sensors by the cable, not the metal sheath, or heat from your hands will affect the readings.

It was looking like calibrating against anything other than distilled water was going to take a substantial amount of effort compared to what I was seeing in the NIST and EPA videos. Most sources indicated that the ice point and steam points were at least an order of magnitude more accurate than my ±0.1°C target, making them suitable for the exercise.

While the overall procedure is pretty easy, it did help to practice a few times to get a sense of when I could trust the readings. Checking that you have just the right amount of water in your ice bath makes a big difference, and don’t run the sensors at full tilt or they will self heat. (I left 15 seconds between readings) Since errors on my part would cause the sensor to be warmer than the true ice point, I took the lowest reading, while stirring, as my final reading. The difference between stirring, and not stirring was usually 1-2 integer points on the sensors raw output (0.0625-0.13 C) and this was consistent for all the sensors.

If these sensors were linear then reading the ice point was a direct measure of the b in y=mx+b. And this got me wondering if one point calibration was enough all by itself.  But once again my wet blanket science adviser assured me that nothing on those graphs told me if the offset was constant over the sensors range. Hrmph! (Although according to Thermoworks, ice point alone can be a good way to check for drift, because the most common error in electronic temperature sensors is a shift in the base electrical value)

I found a silicone vegetable steamer lid for the calibration that had three DS18B20 sized holes in it already.

I found a silicone vegetable steamer lid for the calibration that had three DS18B20 sized holes in it already.  Getting the right pace for your slow rolling boil is important, and this lid sheds the condensed water back into the pot reasonably well. Alligator clips also help speed the process.

So I moved on to measuring the steam point. Water’s boiling point is not necessarily at 100°C and the only factor that is really involved in the variance is atmospheric pressure. Altitude is often given as an alternative when pressure information is not directly available and there are plenty of places to look up elevation and barometric pressure data (& converters) for the necessary corrections.

I already had some MS5805-02 sensors on hand, so with the help of Luke Millers library, I could read my local atmospheric pressure for the correction directly.  The accuracy of my pressure sensor was ±2.5 mbar (similar to  the more common BMP180) with the B.Pt adjustment equation being: Corrected B.Pt.=100 (°C)+((PressureReading-1013.25mbar)/30)  So the 5 mbar total error range in the pressure sensor could change the adjusted boiling point by up to 0.166°C.  This means that the error in my pressure sensor measurement is at least as significant as the other aspects of this procedure. Better than the default ±0.5°C, but it puts a limit on how accurate I will can get with my steam point measurement.

Doing multiple sensors at once saves significant time, but be carefull or you will pay the piper with a couple of burn fingers

Cutting down the stacks on the Fred steamer lid allowed me to do multiple sensors at once. This saves time, but be careful or you will pay the piper with a few burned fingers when you change them out.

With each sensor just under the surface of the boiling water (since the evaporation process happens a little bit above 100°C) each one took about 5 minutes to warm up to reading temperature with the water on a slow to medium boil (and it was easy to see that on the serial monitor) I didn’t consider the test done till I saw at least a full minute of stable output (reading the sensor every 10 seconds) Since errors in my technique would produce readings on the cold side, I took the highest ‘frequently repeated’  number as the final reading. Most sensors settled nicely while some of them toggled back and forth by one integer point from one reading to the next.

In comparison to the steam point procedure, I trust the Ice point as more reproducible because it does not suffer from any pressure information dependency. Perhaps more important is the fact that 100°C is far away from my 20-30°C target range, leaving the possibility for significant errors if the sensors have a non-linearity problem.

With the ice and steam readings in hand, I could construct a two-point calibration for each of my DS18B20’s with slope M=Δy/Δx, and B=(the ice point reading).  (explained here, and that left you in the dust there are lots of fill-in-the-blank spreadsheet templates on the web)

At this point I am still doing tests & chewing on numbers, but the standard deviations around the mean line are being reduced by this ice&steam point calibration. The problem is that even after I apply the resulting slope and intercept I still have significant residuals from a mean that is derived with the corrected numbers. I thought that the two point calibration would make the graphs the individual sensors line up very closely with one another, and that they would have nearly identical slopes(?) I am left wondering if larger sensor errors up at 100°C mean that I need to apply some additional process to normalize my sensors to each other in the 30°C range after doing the two point calibration.  But using the process I described above would generate ‘b’ value corrections, and I am very reluctant to modify my y intercept numbers because I think using the ice point to measure that offset is robust. These doubts about accuracy of the steam point, the sensors linearity, and my lack of a nice “mid-range” standard to calibrate against, have me hunting for a method which would gracefully combine a single (ice) point calibration with normalization. And the dip in the datasheet’s mean error curve between 20-30°C implies that even after applying ice point corrections my average line will still be 0.05°C lower than actual (?)

Another important observation is that the means generated from the uncorrected data were within 0.14-0.16°C of the means calculated after applying the two point calibration. Either my sensors actually did have a reasonably normal distribution of error, or I might have missed something important.  The implication in that first case is that normalization alone should improve your overall accuracy, but I still need to get my hands on a calibrated pt100 to know for sure….Argh!

Addendum 2015-05-18

Bil Earl just posted a beautifully written article on sensor calibration, which puts everything here into context. A great job once again by the folks over at Adafruit!

Addendum 2016-02-12

Just adding a quick link to a small post on the pre-filtering I do with these sensors, which I only posted because no one else seems to bother posting data on the ‘typical quality’ you see with the cheep eBay sensors. And after splashing out on a Thermapen reference thermometer ($200), I can try a multi-point calibration for these sensors that is closer to my target temperature range.

Addendum 2016-03-05

Just put the finishing touches on a new calibration approach which, compared to this ice & steam point method, was an order of magnitude faster to do. If you are calibrating a large number of sensors, the reference thermometer is definitely worth the investment.

Using multiple 1-Wire DS18B20’s for a DIY Temperature Sensor Chain

Temperature is a fundamental physical parameter which can be used to track how water moves and interacts with the rest of the environment. Most waterways in the world are multi use, and temperature sensors are a simple way to monitor rivers and streams, to see how they are being affected by urban pollutionagricultural runoff,  solar heating, groundwater exchange, etc.  In larger water bodies, we also want to track the cycles of temperature stratification.  Sometimes we deliberately disrupt thermoclines with aeration to preserve game fish, but at other times we depend on metalimnion stability to provide a barrier between the E. coli we dump in, and the water we take out for drinking.  Monitoring hydrothermal plumes can even shed light on geological activity under the ocean floor.

1st attempt: epoxy & 1/2" pipe

My first attempt with epoxy & lengths of 1/2″ pvc was successful enough to keep me going. For shallow water deployments, a simple treatment like this would probably be good enough to last for many months. Epoxy is the most expensive component, so each node cost ~ $4.00 with the benefit that each sensor is very robust afterward. You can also check out Luke Miller’s sensor waterproofing on his blog.

Temperature is also a key metric of ecological integrity because it exerts a profound influence on aquatic creatures. Many species time their reproduction and migration according to seasonal water temperatures and, as temperature increases, the capacity of water to hold dissolved oxygen is reduced. In coastal environments, temperature and salinity are very strongly associated so you can use it as a reliable proxy to record tidal cycles, and saline intrusion into fresh water habitats.

All of these applications require simultaneous sampling at different depths and locations, so arrays of temperature sensors are a standard tool for addressing water quality issues. Today, many researchers are looking to the open source movement to help make these large installations more affordable.  One obvious candidate is the inexpensive DS18b20 temperature sensor because it’s one wire protocol makes it possible to string them together in a daisy-chain configuration.  Electronics hobbyists have taken note, and are putting them all over the place with Cat5 network cables. Reading those pages convinced me to take a closer look at the DB’s from the perspective of the Cave Pearl Project: Would it be possible to turn these humble band-gap temperature sensors into something like a research quality thermistor string?

A review of typical commercial options gives you a sense of how much it actually costs to build a network of temperature sensors:

Sensor Cost/Node Precision ±Accuracy Comments:
iButton $25.00
(stand alone)
0.10°C ±0.70 Thermochrons have made a new class of low resolution networks possible,  with large #’s of sensors (Note: You need to coat these guys in PlastiDip if you are deploying them outside, as they are not really waterproof)
Hobo Water Temperature Pro v2 $129.00
(stand alone)
0.02°C ±0.21 Here is an interesting USDA study using TidbiTs which have identical cost & spec.
 NexSens T-Node FR $250/node + $150/cable 0.01°C ±0.075 Typical of high end sensors used in large well funded projects at NOAA, etc

The iButtons are basically disposable, and I don’t think it would be worth anyone’s time to make them from scratch if all you need is 0.10±0.7°C.  But if you need more precise information, a simple 10 node string puts you around $1500 in the mid range, and $4000+ at the geotechnical high end.  Factory calibration of 0.0625 ±0.5°C puts the DS18B20s somewhere between the Hobo loggers and the low end Themochrons. But with each sensor on the same chain, you would be able to keep all the sensors synchronized better than stand alone units.  After seeing the elegant pro-level system, I knew I also wanted something that could be assembled from interchangeable segments, to customize the chain for each installation.

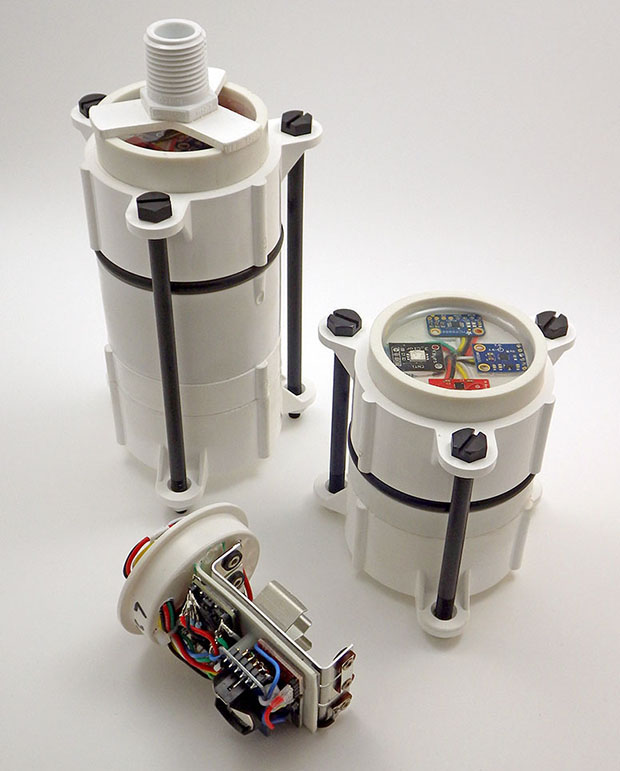
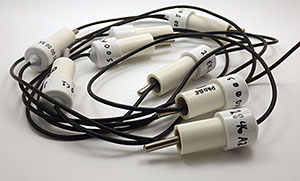
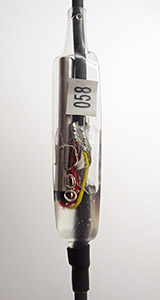
I googled and grazed my way through various YouTube videosinstructables, etc. looking at how others had water-proofed these sensors. After digesting that, I produced a some prototypes using a modified version of my underwater connector idea that have the DS18b20 potted in an irrigation pipe coupling:

all it took was a slight modification of those underwater connectors

~ $9 each for materials. The barbs are tapped to aid adhesion, JB Plasticweld forms a plug to hold the epoxy in.

The 1-Wire Address Finder and the library from Miles Burton work well with this changeable configuration. I preferred the code over at Paul Stoffregen’s site, as it gives you the raw integer reading, the ROM address, and the temp in °C as soon as you connect a new sensor.  But like most of the scripts that uses address arrays, it will read them in numerical, rather than physical order.  So you will eventually end up hard coding the Rom addresses unless you switch over to something like the DS28EA00 that supports sequence detection through a chain mode function. This allows you to discover the registration numbers according to the physical device location in a chain, and if the DS28 also had better resolution/accuracy than the dirt cheap DS18’s, I’d be converted.

The one-wire guide at the Arduino playground has a most valuable tip for driving a string of sensors like this:

“The master can address all devices on the bus simultaneously without sending any ROM code information. For example, the master can make all DS18B20s on the bus perform simultaneous temperature conversions by issuing a Skip ROM [CCh] command followed by a Convert T [44h] command.”

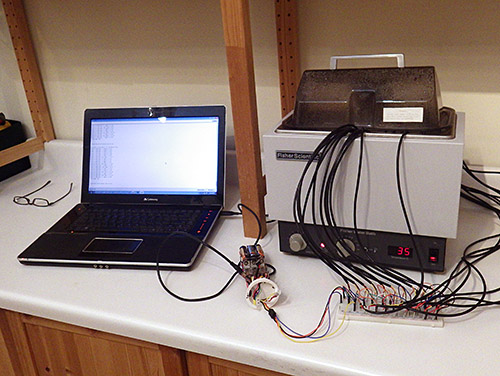
This means that I can minimize the number of times the Arduino has to wake-up for each set of readings. But these sensors are still going to pull about 1.5 mA each during the 750ms 12-bit conversions, so there is going to be a substantial power demand during each set of sensor readings even if I put the μC to sleep while it waits for the data. (and you can only sleep if you are not using parasite power) Thirty or more sensors on the bus will also generate allot of communication and data buffering. I have no idea yet how much juice all that is going to take so I built some larger housings, with room for twelve AA batteries, to drive these long daisy-chains:

This chain is 13.5m long, with 27 nodes (1m, 0.5m and 0.25m lengths)

This prototype is 14m long, with 1m, 0.5m and 0.25m cables.  I’ve had no data reading errors so far…

Maxim has guidelines for reliable long line 1-wire networks which suggests that longer networks need 100 Ω resistors at each node for distributed impedance matching or you could run into timing/reflection issues. As I am working in reasonably restricted cave environments where the floor to ceiling distances rarely exceed 20m, I did not add these resistors. If I start seeing the dreaded 85°C error after I load the bus, I will try a lower value pullup resistor, or perhaps a barrier diode. There is even an I2C to one wire bridge out there that can adjust the strength of the pull-up dynamically as your network grows, although since the one-wire bus is so easy to get running, I would only cobble the two networks together if I had an unusual situation.

these are using deans xyz - the trick is toget the wires to fold the right way

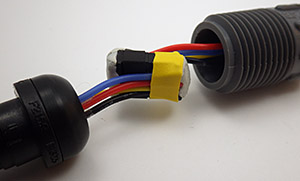
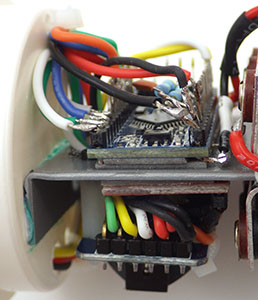
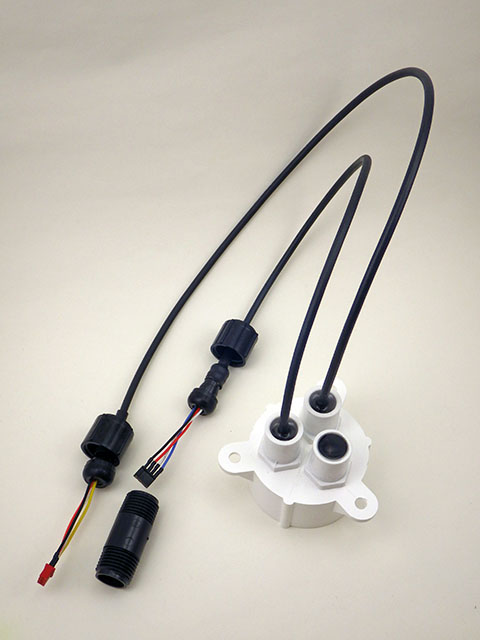
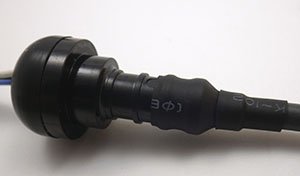
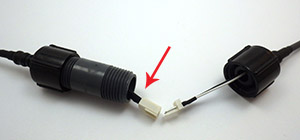
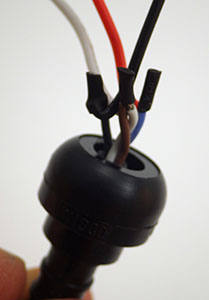
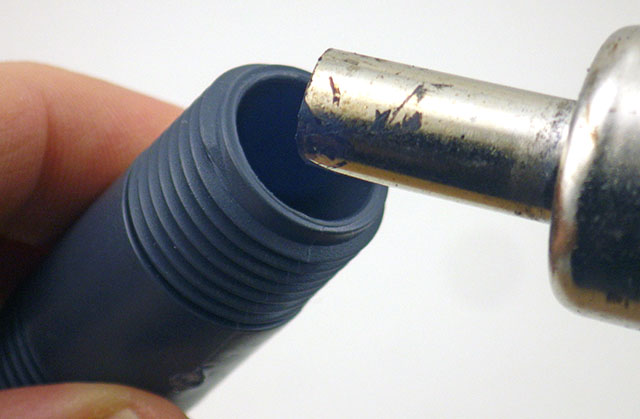
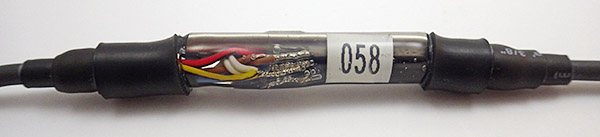
I am using Deans 1241 Micro 4R plugs, which just barely fit inside the pipe. These connectors are really solid, but the trick is to get the wires to fold without pinching when you mate the o-ring to the seat on the opposite side of the connector.

The sharp eyed will note that there are four conductors on that interconnect.  I used four conductor cable for added strength because silicone jacket cables are so soft and floppy that the sheath really provides no support at all. And this offers the potential for a second one-wire network that is separate from the first if communication errors start to appear. Alternatively, I could add other one wire devices to that second line for more functionality. I have not figured out what this might be yet, but perhaps I could include some kind of leak detector to make the system more robust. I am also keeping an eye on the one-wire weather station crowd to see if an interesting sensor pops up there.  And finally, I wanted a four wire connector that could also be used with I2C breakouts, as most of my other builds use sensors with that protocol.

I think this is approaching the largest string I would want to deploy on a dive.

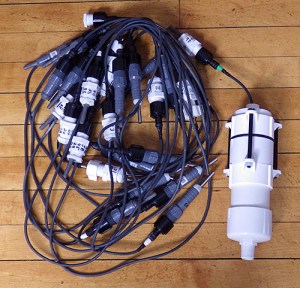
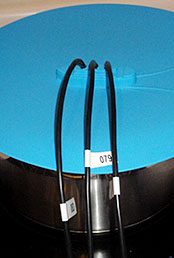
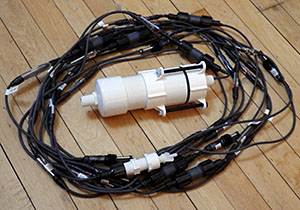
With 27 nodes, this is approaching the largest string I would want to deploy on a dive.  I need to put some thought into how to handle this massive tangle hazard safely.

I have replaced the cable that came with the “waterproof” DS18B20 sensors, as the insulation was far too thin for the rough handling I expect to see and the 28awg wires would add significant resistance over a long run.  But silicone jacket cable is expensive and I am still searching for an affordable 24awg, 4-conductor option. (If you have a suggestion, please pop it in the comments!)  The PVC and Poly-urethane jacket cables I have tried so far are just too stiff to “hang right” under water without a weight on the line, and this would put strain the data connections.  The standard solution is to run a suspension wire alongside the thermistor string with the data lines connected to this armored stiffener. While this works great off a boat or a buoy, I would prefer not to have to deal with those extra components on a cave dive.

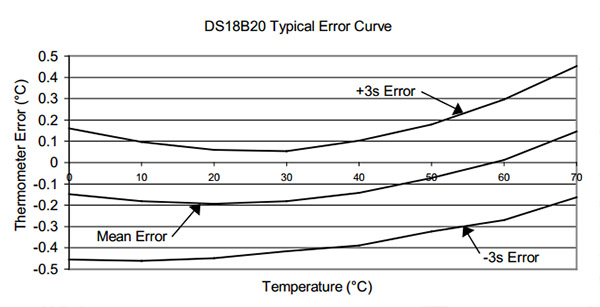
After addressing the issues with the physical build, I still have an elephant standing in the corner.  While an accuracy of ±0.5°C might be good enough to track the refrigerator in the garage,  ±0.1 °C is about as coarse as you want to go for research applications. So a lot of the burden of making this thing really functional will be the calibration. If you replace the Arduino’s 10-bit ADC, then there are thermistors that give you ±0.1°C right out of the box, and I would like to get these DS18b20’s into that ball park before I say the newest addition to the Cave Pearl family is ready to deploy.

Maxim has a document describing how to curve fit the error of a band-gap based digital temperature sensor with 2nd order polynomials to achieve accuracies in the 0.02-0.04°C range,  but they make the assumption that you already have a NIST traceable platinum RTD to determine what the errors actually are. But what if you don’t have that $5-600 piece of kit just lying around? (+another $150/year for the required annual re-calibration) Is there any other way to calibrate temperature sensors like this to improve their accuracy?

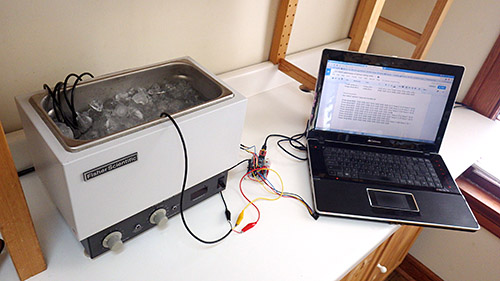
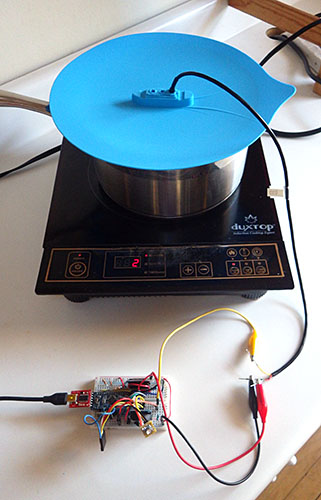
Actually, there are verification procedures that use the ice and steam points of water, and I will detail my attempts to use these “old-school” calibration methods in the next post. In theory at least, these intrinsic standards can bring our DS18b20’s well within a mid-range accuracy target of  ±0.2°C.  At the end of it all I will try to borrow a certified pt100 to see how close I actually got.

Addendum 2015-02-23

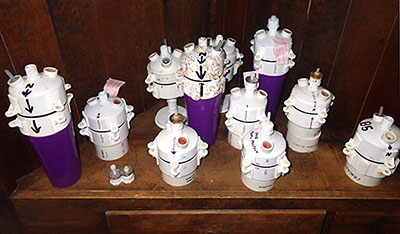
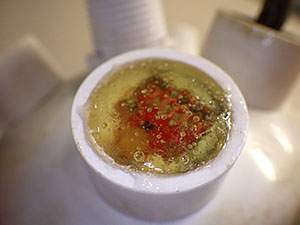
After handling that long chain for a few days of calibration, I realized that I needed to mount those sensors with a much smaller physical profile or they were going to be a pain the backside under water. So I came up with a simple combination of heat shrink tubing and epoxy that keeps the sensor much closer to the cable than a hard-sided mould:

text

Using clear heat shrink will let me monitor leaks, aging, etc. There is heat shrink tubing on those solder joins, but it became invisible in the clear epoxy.

caption

Heat from the bottom and as the tubing shrinks the epoxy “flows” up to the other end. When you seal the upper end leave some excess epoxy trapped in the tube. Apply another ring of shrink to cap it off, and with both ends fully sealed & cooled down, gently heat the entire surface. As the leftover wrinkles disappear the heat shrink tube turns into a tension structure creating a smooth rounded profile.

The trick is to seal one end of the clear tubing first, and then inject the epoxy into that from the open end.  Once the tube is about 2/3 full 0f epoxy, shrink the upper open end of the tubing down to it’s minimum diameter. Very gently heat several spots along the tube  – as those areas contract it pushes the epoxy up toward the open end.  Then wipe away any excess so the meniscus is level, and seal the upper end of the outer tube to the cable with a short section of adhesive lined heat shrink tubing, making sure that you trap as few bubbles as possible. I usually use adhesive lined heat shrink for those two end tubes, and I let the upper ring completely cool so that if forms a good seal before heating the rest of the clear heat shrink tube.  I usually use Loctite E-30CL  epoxy as this sets much more quickly after the reheating process, often becoming hard in about 30-45 minutes. This approach to mounting the sensors would also work with ‘naked’ Ds18b20’s, but having the sensors already mounted in the stainless steel sleeve makes it much easier to do the ice & steam point calibrations before you commit to actually using a particular sensor.  At only $1.50 each, you should expect to triage at least some of them for being out of spec.

Completely encasing the sensor like this will induce some thermal lag, if you are really worried about that you could make the tubing shorter and not seal the upper end, leaving the metal sleeve exposed.  If field handling indicates that the hard epoxy is too brittle, I will hunt around for a flexible amine curing silicone, or a low durometer clear urethane, to fill the nodes (typical hardware store silicone gives off acetic acid while curing which is bad for electronics)

Addendum 2015-03-01

With more handling, those epoxy filled tubes did end up feeling a little fragile at the thin ends, so I reinforced them with a few more wraps of adhesive lined 3:1 heat shrink tubing:

I also moved the join so that it overlaps the sensor, so the metal sleeve acts as stiffener

I also moved the solder joins so that they overlap the sensor, this lets the metal sleeve acts as stiffener for the whole unit.

In addition, I decided to make the chain in 2m segments, with sensors at fixed distances along each segment. This reduces the total number of joins in the cable, while still allowing for custom configurations. In the photo (belowyou can see that I used a longer piece of pipe in the segment connectors than was necessary. My hope is that if I distribute some buoyancy throughout the chain there will be less strain on the segment nearest to the datalogger. Those segments will be bearing the weight of the whole sensor string because the logger will most likely be mounted on the ceiling of the cave passages. The real test will be when we actually install them, as there is always some unforeseen factor that comes into play under water.

Addendum 2015-03-02

I just came across a great write up by someone using DS18b20 sensors to track ocean temperatures over in New Zealand. (I knew I couldn’t be the only one…)   Interestingly, he uses a star configuration for the sensor connections. While this is much faster to connect than the daisy-chain approach I have taken, it looks like he ran into some problems with his long cable runs and had to use a very strong 480Ω pullup resistor. There are plenty of photos, and a good explanation of how he used normalization to smooth out between-sensor variations. While this is helpful for tracking relative changes in temperature, it does not necessarily improve the accuracy of these sensors.

Addendum 2015-03-06

The second prototype with 30 DS18b20 sensor nodes, 12 m of cable length

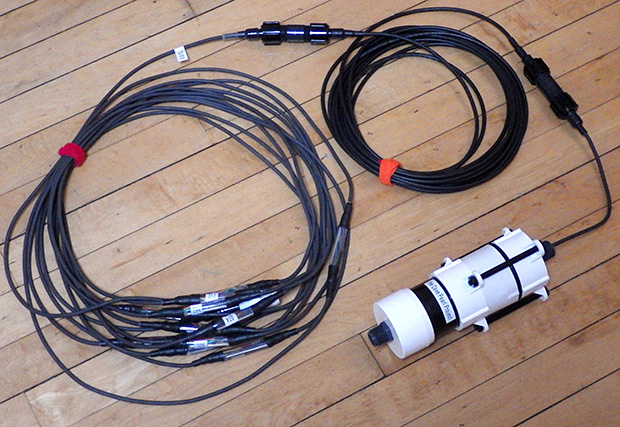
The second prototype with 30 DS18b20 sensor nodes distributed over 12 m of cable with 7 inter connections

I have been putting more segments together for a second prototype. For the newer nodes I used Loctite U-09FL urethane. This stuff is less brittle than the epoxy after curing, however it sets almost immediately when you apply the heat to the shrinkable tubing. The result is that the nodes didn’t “smooth out” like they did with the epoxy, and so they ended up looking like clear Jello raisins.  You can’t be too aggressive with the heat gun or the outer sheath splits, making a bit of a mess.

The hardest part is pulling the sensor wires free of the old cable as it tends to be filled with black epoxy. You will loose a few sensors by accidentally cutting them in the process.

The hardest part is pulling the sensor wires free of the stock cable as it tends to be filled with black epoxy. Expect to loose a few sensors by accidentally cutting wires in the process. Most sources I found recommended using unshielded cables to reduce capacitive coupling, and warned against grounding unused wires for the same reason. Some folks also suggest adding 100-120 Ω resistors to the data leg of each sensor to reduce the load on the data bus, but I have not tested that yet to see if this really works.

Once I had enough segments ready I did some tests to see how far the chain could be extended before the coms failed.  Line capacitance appears to be the controlling factor on these kinds of networks and most try to keep it low for maximum distances, or better performance. But I am packing quite a few DS18’s close together, so the sensors themselves are more likely to limit my system. With 15 minute sample intervals being typical for an environmental monitoring application,  I could even look into slowing down the bus, rather than speeding it up.

With a standard 4.7 kΩ pullup, I was able to get to 30 sensors responding  well on 12m of 4x 26awg silicone jacket cable.  Changing the pullup to 3k3, allowed me to add 15 more sensors on an extra 8m of cabling. And taking the bus to a fairly aggressive 2k2 let me add 19 more sensors and an additional 7m of cable. So my add-hock test reached a total of 63 daisy chained nodes on 27 m of cable before the readings became unstable. I did not see 85°C errors, but when the network approached the R-C rise time limit, the readings started looking like this:       (in a room at 20°C)

2015/03/06 16:58 Cycle: 1, InternalV= 3293
Probe 0 Temp Raw: 268 Temp C: 16.238
Probe 1 Temp Raw: 288 Temp C: 18.0
Probe 2 Temp Raw: 16 Temp C: 1.0
Probe 3 Temp Raw: 322 Temp C: 20.125
Probe 4 Temp Raw: 332 Temp C: 20.238
Probe 5 Temp Raw: 113 Temp C: 7.62
Probe 6 Temp Raw: 323 Temp C: 20.187
Probe 7 Temp Raw: 280 Temp C: 17.244
Probe 8 Temp Raw: 324 Temp C: 20.250
Probe 9 Temp Raw: 17 Temp C: 1.62
Probe 10 Temp Raw: 256 Temp C: 16.0
Probe 11 Temp Raw: 320 Temp C: 20.0
Probe 12 Temp Raw: 66 Temp C: 4.125
Probe 13 Temp Raw: 24 Temp C: 1.244
Probe 14 Temp Raw: 32 Temp C: 2.0
Probe 15 Temp Raw: 268 Temp C: 16.238
Probe 16 Temp Raw: 320 Temp C: 20.0
…etc…

Adding a couple more nodes after that caused the reads to completely fail. The numbers then become zeros because I use  memset(rawTemps,0,sizeof(rawTemps));  to clear the temperature reading array after the data has been transferred to the eeprom buffer. Doing this between readings makes it much easier to spot when sensors drop out.

Thirty sensors is a bit tight for my application, so I will remove the 4.7K resistors I have on the loggers now and make an in-line adapter that lets me change the pull-up on the fly if a particular installation starts giving me grief.  But going much larger than 10m & 30 nodes might be putting too much data at risk if we have a point failure. Another limitation on the practical side is that my FTDI USB adapter can only source about 50 mA, so I can’t use the skip ROM command to trigger temperature conversions on more that about 33 sensors before I risk hurting the chip during tethered test runs. 

Addendum 2015-04-05

DIY Cave Pearl data loggers based on Arduino Microcontrollers
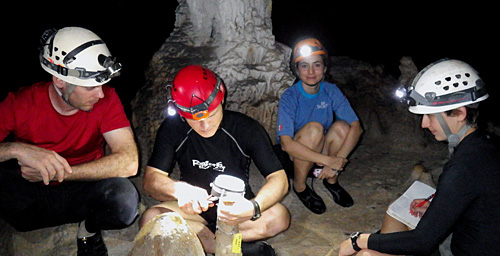
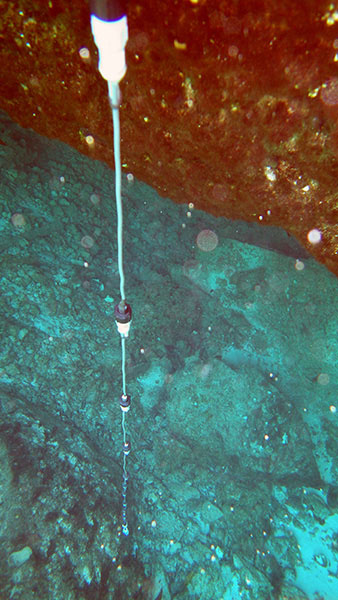
We recently had a chance to test the first prototype (with the separate individual nodes) out in open water. To make sure the connections were up to the challenges of “normal” fieldwork, I let students handle & install the unit, with no specific instructions other than letting the last sensor just rest on the bottom. (yes, I cringed a few times…) The lowest sensor was at 6.5m depth, and the unit gathered temperature data in a saline water outflow for about 7 hours with no leaks or problems.  On the same trip we also deployed two “clear epoxy tube” chains in a different cave system spanning depths from 7 to 14m. I don’t have any photos as that deployment was significantly deeper, and beyond the reach of our little point & shoot.  Both of those carried 12 x AA batteries, and the plan is to leave them running in-situ till mid year, at which point I should have a pretty good record of power consumption of these long sensor strings. 

Addendum 2015-04-20

I mentioned using E00CL epoxy earlier, but have since gotten back some cave deployed RH sensors that all failed due to moisture permeability on the E05CL epoxy I used to build them. And those humidity sensors were not even under water!  So for future builds, I will stick with E30CL. It’s gooey to work with, but I have several units that have been under water for more than a year using that epoxy. 

Addendum 2015-07-08

The single sensor chain in the photo above ended up coming home after the field trip, and since it was just sitting there, I set it up on the bookshelf for a power drain test:

Multi DS18b20 power drain test.

Because the DS18’s run on fumes when they are not doing a conversion, this logger slept at 0.11 mA. The units currently in the field have more sensors and longer cables, but seeing that less than half of a three cell battery’s capacity was used on this two month run gives me confidence that the 12 cell loggers we deployed had far more power than they needed. So the only real question is how long they remained water tight* with the crummy epoxy used on some of the nodes. If I am lucky, the marine heat shrink tubing I used for physical re-enforcement will have provided a water tight seal on those ends.

P.S. * Those deployed units survived their first underwater test and worked brilliantly. For more details click HERE

Addendum 2015-10-30

Just an update to that 20-node DS18B20 sensor chain’s power test:

Power drain test with 20 dS18b20 nodes on 3xAA cells

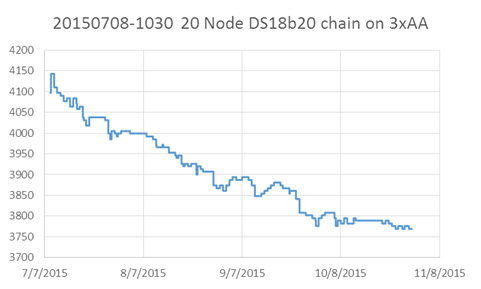
These units save 200 records (~2 days worth of data) to an onboard 32k Eeprom buffer before doing a flush to the SD cards.

So we have already done five months on 3xAA battteries, confirming that those DS18B20s are very nicely behaved sensors in terms of their overall power consumption.  But that P.S. curve is bumpier than I am used to seeing from alkaline batteries read with a 2x 4.7M ohm divider,  so I might go digging on what causes that to happen.  It could just be that simultaneous temperature conversons ( 20 sensors x 1.5 mA x 750ms ) is enough of a load that the batteries feel that hit.

Addendum 2018-12-01

Just an update regarding a problem we ran into on some deeper deployments of 24m x 24 node DS18b20 chains.  I’d been running those with 3k3 pullups and they passed all run tests at the surface – but those strings suffered a slow progressive read failure after about five months between 20-50m depth.  This was a slow bus failure, and the tidal cycle showed up clearly as the sensors fell off, and then rejoined the set. My best guess is that the soft silicone jacket on the cable became progressively more compressed over time, and this raised the bus capacitance just enough to push the timing out of spec.  Adding a second pull-up to the end of the bus brought all the sensors back on line, so my recommendation is to stick with ~2K pullups if you build longer chains like this. Harder PUR insulation cable jackets might also have prevented this very tricky problem.

Addendum

This was only the first in a series of posts on the DS18b20 builds we deployed on our project:

We have now moved on to using NTC sensors for our DIY temperature chains.

A DIY Underwater Housing for Arduino Data Loggers made from PVC pipe

Doodles are a fundamental part of the process...

Doodling is a fundamental part of the process…

I spent a great deal of time cutting, sanding and gluing my underwater housings last year. And I learned a heck of allot about adhesives, O-rings, hull penetrations, and potting circuits.   But mostly I learned that I like soldering more than I like cutting…sanding…and gluing PVC. Holiday travel left me with a wicked stomach flu on New Years, so I had a few bedridden days to contemplate all this and think about how I could simplify the design. I was already cutting up Formufit 2″ table caps to provide bolt supports on the 3″ housings, and I just had this sense that I was missing a trick by taking those table adapters apart just to glue the pieces back together again.  Perhaps, if I made the build more compact, I could just use the Formufits as they were?

In all, I probably spent a week, staring into space and sketching ideas, and another week assembling prototypes. But I think I have finally sorted the new Cave Pearl underwater housing design for 2015. The taller unit here has six AA batteries, while the “mini” has only three:

caption

My wife dubbed these “Stormtroopers” because the black details against the white PVC reminded her of those Star Wars characters.  Given how important actual storm events are to data they will be gathering, I’m cool with that 🙂

Boards are held in place with double sided tape

Boards are held in place with 3M double sided tape and the RTC breakout is inverted on 12mm M2 standoffs. This makes it easier to replace the coin cell on units where I power the RTC from a pin on the Arduino, since they will be in battery powered ‘timekeeping’ mode most of the time.

This assembly requires a small number of 2″ pipe cuts,  and only two surfaces need to be wet-sanded for the o-ring seats. Putting all those sensor breakouts under epoxy in the single ring on top lets me juggle the them around, and is more forgiving of different board dimensions than my older designs. I would not have put that much faith in the Loctite E30CL if I had not already seen last years units survive for so long under water. This design requires a very tight build for the electronics, and I don’t think I could have tackled soldering like this when I created the original housings in 2014. Aside from the new 32k eeproms, this is still just a variation of the basic three component logger that I published in July last year. I am simply putting it together on both sides of a .060″ ABS sheet that I bend into shape with a heat gun.

Of course this new design will have to go through the usual round of underwater tests, and I hope that the long nylon bolts act as spoilers for the vortex shedding I am bound to see in the higher flow systems.  I will add some rounded baffles if that becomes too much of a problem.  Even if this design does not prove suitable for the flow meters, it is so quick to assemble that some version of this style will become the standard housing for my other underwater sensors.  There are more variations coming off the bench, and I will post a few of the better ones as they come together, especially ones that let me flexibly extend the housing to hold more batteries for really long deployments.

 Addendum 2015-02-06

This post has only been live for  a few days, and I have already had several offline requests for more information. So here are some details on how I put these housings together, starting with an exploded view of the parts:

Only 2 surfaces (arrows) need to be wet-sanded down to 800 grit for the O-ring seats.

Only two surfaces (arrows) need to be wet-sanded for the O-ring seats. I take it to 800 grit, but 600 would probably be ok. Examine your parts before buying, as brands vary considerably in the number of casting seams & ID information they place on the rims.  To do the least amount of sanding possible, buy the ones with the smoothest finishing, and flip your parts around so that you are not sanding down any edge cuts for o-ring seats.

The pipe is schedule 40 PVC, and the center piece is a standard 2″ coupling. The pvc ring bordered by the arrows is only glued on the coupling side, and it extends into the upper cap only far enough to provide a backer for the o-ring, and to hold the top cap in alignment. The top cap is not glued, but is held in place by the five inch 1/4-20 nylon hex bolts. These bolts are slightly wider than the holes in the Formufit endcaps, so you need to drill them out a bit. But I would suggest that people start their builds with threaded rod, rather than fixed length bolts, as this gives you the freedom to experiment with different lengths of pipe. The o-ring pictured here is a #332 3/16″width 2 3/8″ID x 2 3/4″OD, and its diameter extends slightly outside the PVC (pressure at depth will push them inwards…). A smaller diameter 1/8″-229 also works, and fits inside the seats. I am still trying to find an affordable supplier for 5/32″ cross section o-rings, which would probably be the best size to use. I use Loctite Hysol E-30CL to pot my electronics.  I use the clear epoxy is so that I can see my indicator LED’s and keep track of how the epoxy is aging. But if you replaced that epoxied well of sensors with a clear acrylic disk, you could make camera & light housings for other interesting projects. The only limitations are that everything has to fit inside 2″ PVC pipe, and that those flat Formufit cap ends are only 4 mm thick, affecting the maximum depth they can with withstand.  For now I am expecting these housings to go to at least 100ft/33m safely.

Addendum 2015-02-07

And here is the extendable version of the design:

Just wait till you see what

Each bank of batteries is isolated with a 1N5819 Schottky.  Just wait till you see what I need all this power for . . .

In this version the lower ring of struts (where the white nuts are attached to the 3.5 inch bolts) has the flat surface of the Formufit table cap removed with a hole saw. This turns it into a freely moving slip ring which applies pressure to the bottom of the glued coupling, and thus to the o-ring above it. This build uses a slightly shorter coupling than the initial builds, and the PVC tubing that leads to the rounded end-cap at the bottom can be any length, making room for more boards, etc.  For multi-year deployments, I will probably make stand alone battery compartments this way, connecting them to a separate mcu & sensor housing via my diy underwater connectors.

Addendum 2015-07-23

2inchLoggerPlatformbuildwRocketUltra

The black zip tie (upper left) provides a handle so I can pull the carrier out of the housings.

I have discovered that the long temperature strings really did not need that 12 x AA whopper pictured above, and I now mount the batteries in a power pack module that is physically separate from logger itself. This gives me the added benefit that the batteries can be located further away from the sensor caps, hopefully reducing their influence on the magentometers I use in the flow sensor builds. If I suffer from battery leaks again, I can simply replace the carrier in the field. Should I end up needing a large number of batteries for something in the future, I will just whip up a “Y” adapter cable to connect a couple of these modules in a parallel configuration. The Schottky’s on each bank will keep them from fighting with each other.

Addendum 2015-07-26

And here is the exploded view of the parts for the extendable housing:

Once again only the indicated surfaces need to be sanded. The short 1cm ring and threaded adapter in the lower right corner are optional, depending on how you want to mount your sensors to the top of the unit. I usually put at least one threaded connector on so that I can attach some sort anchor cables to my loggers so that they don't get carried away.

Once again only the indicated surfaces need to be sanded. The short 1cm ring and threaded adapter in the lower right corner are optional, depending on how you want to mount your sensors. I usually put at least one threaded connector on the body so that I can attach some sort anchor cables to my loggers at that point.  The  bolts are just a wee bit bigger than the holes in the Formufit caps – so you will have to drill them out with a 1/4″ bit to let the cap slide freely, and only use nylon if your sensors are sensitive to nearby metal – otherwise go with SS.  The PVC coupling is 4cm wide, and if your couplings are longer the bolts will be too short, and you will need to switch to threaded rod.

Addendum 2016-03-10

As more projects adopt this housing design, many have been asking me about the maximum depth they can withstand, though I have not yet had enough ‘spare’ units to put any through destructive testing. My back of the envelope guess?  The 2″ schedule 40 pvc has a rated operating pressure around 150 psi, so nominally those parts are good to somewhere around 300 feet. So I am confident that we could deploy to about half that, expecting failures to occur first at the solvent welds & hull penetrations. (see pg 69 of the Loctite Plastics Bonding Guide for more info on shear strengths) You would probably need a harder o-ring compound for those depths as well, as the EPDM I am currently using is pretty soft, and would compress significantly below 100ft.  For really deep deployments, you could fill the housing with oil like they do to the motors on ROV’s. Some of those add an ‘external bladder’ with extra oil to balance the internal and external pressure.

We no longer use those large surface area potting – rings shown at the beginning of this post because as you go deeper the epoxy begins to flex, and this ruined some of our temperature sensing IC’s. So keep the diameter of your sensor mounting wells as small as possible, and try to mount the sensors/leds etc. 10mm or more below the epoxy surface.

Bio fouling on estuary unit after 6 months. As you might expect, critters usually kill our pressure sensors before salt water corrosion does.

A researcher over in Europe contacted me while ago when I was using the 3″ end-caps, for a project tracking daily krill migration.  But I have not heard back from him if he was able to go deeper with those thicker, rounded hulls. Our experience is that the PVC housings are unaffected by salt water, and although marine critters will grow on the surface, even boring organisms would rather drill into the loctite epoxy than go through the PVC housings.  We often have to soak the loggers overnight in a muriatic acid solution to dissolve the encrustations before opening the housings.

Addendum 2016-07-31

I just stumbled across an interesting ROV build based on PVC pipe over at instructibles.com that shows just how far you can take this pipes & wires approach. PVC has been a go-to material in the DIY crowd for ages.

Addendum 2016-11-18

“Marine-Grade” 316 stainless steel washers after five months exposure to salt water – after scraping away the ball of brown rust. Whatever the company claims about it’s durability, always cut that number in half.

Just a quick note about those nylon bolts in that photo above.  They expand from their dry length of 94mm to about 96mm when they are wet. This is just enough for them to become loose over  a long underwater deployment unless you over-tighten them considerably going in. We’ve retrieved several loggers where the bolts that were tight when the units were dry, but could be spun freely when then logger came out of the water.  Fortunately the sliding cap design means the O-rings were held shut by the pressure at depth so that seal saved us from data loss.  Our magnetometer flow-sensors are sensitive to the presence of metal, but if your sensor combination is not limited by that I’d suggest you use stainless steel or titanium bolts to hold the housings together.  Or at least soak those nylon bolts in water for a few days before deployment so they are already expanded. Note that the nuts also expand and are hard to release due to the increased diameter of the bolt when everything is wet – give them a day or so to dry out and they become much easier to undo.

Even stainless bolts corrode in seawater eventually, so lately we’ve been using SS bolts, with nylon nuts. That way even if the bolt threads are shot after a year (or two) in salt water, you can open your logger by cutting away the nut with a pair of clippers. Replacement bolts cost less than a fresh set of batteries, so you should probably add a new set of bolts whenever you change the AA cells. 

Addendum 2020-03-01

A quick up date on the progress wrt hull pass-throughs: We’ve been using the sensor pigtails (described on the waterproof connector page) for quite a while now with connector dongles that are potted in E30CL epoxy on the housing body. But that’s overkill for shallow water & surface deployments.  In those cases you can solvent weld threaded NPT connectors to the housing and attach the sensor dongle directly to the housing: (click to enlarge)

For deeper deployments where pressure is significant the hull pass-throughs are hardened with a thick well of epoxy.

For shallow/surface deployments: 1/2 inch threaded NPT connectors can be drilled allowing wires from the sensor dongle to pass through the bulkhead.


Smaller housing made from only two caps (April 2020)

We do observe some pressure-bowing on the flat end-caps below 20m depth even when the wells are filled with epoxy. And since the 1/2 holes necessarily weaken the bulkhead I won’t be deploying direct-connect loggers past 10m if they are made from schedule 40 PVC. With recent advances in power management we’ve also been able to decrease the size of the entire housing.  (w details at @ DIY data-logger Housing from PVC parts)

A Simple DIY Underwater Connector System made from plumbing parts

Up to this point, the Cave Pearls have been self-contained units. But this means that the sensors must be mounted directly on the housings, and the batteries must fit inside.  I already have ideas for new sensors that would require me to overcome these two limitations, so I need to address the issue of how to make electrical connections that are not merely IP68 waterproof, but rugged enough to withstand pressure at depth for a year or more.

I wet-sand the ends (indicated by the red arrows) of that nipple with 600 & 800 grit to smooth away any casting seams.

Wet-sand the ends of that nipple (arrows) with 600 & 800 grit to remove any casting seams. Smooth all o-ring seats.

Use a couple of sizes of heat shrink tube to seal the cable to the pex adapter

On 1/2″ barbs, use a couple of sizes of heat shrink to step down (from Ø12/6 tubing) to the diameter of the cable you are using before sealing the connection with epoxy. Adhesive lined tubing  helps the seal. You can also buy 1/2 NPT x 3/8 PEX adapters for thinner cables, but for some reason they cost twice as much as the larger diameter 1/2 x 1/2″ adapters (?) 

As a diver, I had already seen debates about which connectors are the best on the scuba forums, and a quick Google search quickly finds many suppliers for that market. Most of these are “wet-plugable” connectors encased in delrin/rubber, and they are workhorses in many industrial and military applications. High profile companies like Seacon making a bewildering array of solutions, but their cheapest ones come in around twenty five dollars per socket, so a complete connection will set you back at least $50.


Remove the cone washer before filling adapter with epoxy

Remove the cone washer before filling with epoxy. I score the inside of these 1/2″ barbs with an old 8×125 tap to promote epoxy bonding.

Many of these commercial connectors are rated for deep ocean deployments, able to withstand thousands of psi – far more than I will subject them to in the shallow cave systems. And they often give you a short little pig-tail under the assumption that you will be using it with a cable gland , or a bulkhead connector on a nearby housing ( or at the very least a couple of layers of marine grade adhesive lined heat shrink tubing)  I needed some decent cable runs so I went looking for other applications with longer lines at shallower depths . The pool & underwater lighting folks often use  Bulgin electrical connectors, and the 400 series   Buckaneers  (rated to 10m) occasionally come up on eBay in the $10 range, But again you need to buy two sockets (male&female), and you need to buy the pins which are sold separately. So you still end up around $25 per connection.


Make sure your wires are long enough to extend past the nipple, or you wont be able to make the connection!

Make sure your wires extend all the way through the nipple, or you can’t make the connection! And use soft flexible silicone wires so they fold back into the connector easily.

With all that as background, I went hunting once again through the plumbing section at the local hardware store.  I reasoned that anything that could hold water in, could also hold water out, right?  And I think I have come up with a solution using Nibco pex swivel adapters that is pretty cheap and can be adapted to many different applications. These plumbing adapters are rated to withstand 100 psi, which is roughly equivalent to 230 feet under water.  And that is pressure from the inside out, so my gut feeling is that these things will be able to withstand slightly greater pressure in the other direction, where the forces act to increase the compression of the cone washer.  The thing I like about the swivel adapter mechanism is that it applies pressure to a hard plastic lip on the other side of the washer, so as you tighten the nut there is no rotational force being applied to the parts forming the water tight seal.

And it even looks good!

~$6 for parts, and it looks good too.

These adapters come in a variety of larger & smaller diameters allowing you to use different cable thicknesses, and you can change the length of the pvc riser pipe in the middle to make more space for the internal connectors. This also gives you a way to adjust the amount of air/buoyancy along the run and with a string of connectors this might be a good way to reduce strain on the cable.  I suspect that the schedule 80 tubes in the middle are the weakest point in the system, but filling the internal space with mineral oil would get these connectors to significant depth, as would a filling of paraffin wax, though that would have to be heated again to undo the joint. 

Addendum

TheSimplestDIYUnderwaterConnector

Don’t forget to smooth the seat on that male hose barb side if it has bad casting seams. You want that connection to be as clean as possible. You need to use small connectors for this M-F design.

After building a few of these, I realized that it was possible to make them even simpler if the electrical connectors were small enough.  In the picture here, one side has a Nibco PEX swivel adapter, while the other has a male thread NPT to PEX  adapter. These are both polymer, though it is hard to find an epoxy that will bond to it with an applicator fine enough to put the adhesive into the barb cavity. These fittings are also available in brass for the same price, and the o-ring seats are much cleaner on those than the polymer adapters because there are casting seams on the plastic parts. But I don’t know how well the brass will fare in marine environments. Some of my sensors have stainless shells, so I worry about galvanic effects in salt water?  

After this, pull the cable through so the

Pull these joins into the connector so they are embedded in the epoxy.

In the photo above I’ve used a three wire PC fan connector, and it “just barely” fits inside the cavity of that m/m hose barb. I will use smaller JST connectors in future, or perhaps Dean’s Micro 3pin or 4pin for something more robust.  The internal diameter of the 1/2 pipe is a little over 12mm, so if you need to squeeze more connections in there you could try a couple of “mini micro” JST’s, but I find that soldering all those wires so close together is a bit irritating because it’s easy to accidentally melt the plastic, loosening the tiny pins. 

I also found that the wire inside my cables were too stiff to fold neatly into this much smaller space, so I had to add some flexible 26 AWG silicone wires to the ends. After the jumpers are attached, pull the cable through so that the solder joins get embedded in the epoxy. This has the added benefit of providing a break in the insulation around the wires, so that if you do get a cut in the cable, water can’t work it’s way through the connector by wicking along the copper strands.  I am still hunting for a good supplier of multi-conductor 22-24 awg cable that has a good “handling weight” for underwater applications. It’s hard to shop for something on the internet when what you are really after is something that “feels right” when you hold it in your hands.

A dual connection cap for one of our 2″ underwater housings. We now use harder PUR sheath cables because softer silicone jackets were too easily damaged during deployment dives. For a less expensive option,  Luke Miller has had success using USB cables with his underwater sensors.  A 3/4″ adapter from the pex connector system gives you a way to mount pressure sensors under oil.

I should add the usual provisos here about this being another of my completely experimental ideas so use this at your own risk.  Pex tubing is generally rated to  ~100psi (at temperatures below 74°F) and if the o-rings can withstand that then they should “theoretically” be good to about 60m depth. Translating that into the real world, I expect these connectors to be trustworthy to about 40m, which covers most of our cave deployments.

Addendum 2015-01-30

I just stumbled across a different solution to the expensive underwater connector problem. His method for waterproofing connectors using 3D printed silicone molds is beyond my current capabilities, but its nice to see it explained with such clear documentation.

Addendum 2015-02-01

If those pex adapters don’t have enough room for your cables, I found another great underwater connector project which might do the job for ya 😉

Addendum 2017-01-23

As time goes on I am reducing the number of interconnects, but even with longer chain segments I will probably stick with only 24 sensors per logger.

As time goes on I am reducing the number of interconnects, but even with longer chain segments I will probably stick with only 24 sensors per logger.

Just though I should add an update to mention that quite a few of these connectors have been in service for more than a year on temperature chain deployments. None of them have failed on relatively shallow deployments from 5-15m depth. The only problem I’ve had  is the length of the connector itself can be challenging when you are trying to pack one of those long strings into the mesh bag for an underwater deployment.


Addendum 2018-12-05

I’ve posted a video showing how I build those underwater connectors and use them with epoxy potted sensors:   ( part of our 2017 screw terminal logger series) 

It’s also worth mentioning that you can improve the fit of various parts by taking advantage of the fact that they are thermoplastics:

Rotate & heat the inside corner edge of the tube until ~ 0.5mm of the material ‘softens back’. Don’t over-do it! you don’t want to alter the tube diameter or hurt the threads.

Quickly press the mating o-ring onto the seat while the PVC is still soft enough to conform to the shape.


Before & After heat treatment: the o-rings now form a better seal. This is faster than sanding away any rough casting seams on the parts

Addendum 2020-04-06

These connectors & sensor mounts are part of the housing system we’ve been developing since 2015. You can see the latest underwater housing build @ DIY data-logger Housing from PVC parts

The 2014 Cave Pearl Project ‘Year in Review’

With the last field reports of 2014 out the door, I feel I should post something about the project having completed it’s first year as a “serious endeavor”.  At the risk of sounding like A.J.Jacobs,  it has been “A Year of Living Inventorly”, and the fact that I had never done anything like this before did not stop me from trying to build one of the simplest underwater dataloggers ever made. Looking back, I am very pleased by how much the Cave Pearls developed, both in terms of the electronics:

Platform_tryptic_Jan2014

and the physical build:

Cave Pearl Physical Build Tryptic

It’s been one long string of learning by doing, and with no “formal” training in electronics, I have been using a basic process of elimination approach to tackle each problem as I went along.  Each time I built a one, it became a little easier to see where the next improvements could be made.  I became fairly obsessed about the project and my wife, with her usual good humor, coined the phrase “nerdling” to describe the days spent cutting & soldering in the basement, instead of pursuing my other passions.  But left brain/right brain tropes have always sounded odd to me because inside my head both tasks feel pretty much the same.

The highlights of the year were the field deployment trips:

Date #deployed Logger / Sensor combination
Dec. 2013 2 Alpha Flow Sensors go under water for the first time.
Mar. 2014 3 Beta Flow Sensors   Tinyduino based loggers with Bma250 accelerometers, housing have no latch clamps
1 1st gen. Underwater Pressure Sensor
Aug. 2014 3 3rd gen. Flow sensors Rocket based logger platforms, Rosetta Stone builds to compare sensors, BMA180 accelerometers adopted, epoxy failure in this generation
3 Beta Flow sensors re-deployed  in the open ocean
2 Pressure Sensors    MS5803 based,   2bar & 5bar
6 1st gen. Drip Sensors    deployed at Rio Secreto
Dec. 2014 10 Flow sensors a mix of 3rd & 4th generation units, most go into deeper low flow saline zones, 1 commercial co-deployment and a fresh/saline co-location at one site
3 Beta Flow units 2 rebuilt for open ocean deployment, one unit has been underwater continuously ~ 10 months
11 Drip Sensors 1st & 2nd generation, @ Rio Secreto
2 Pressure sensors 2bar in water & 5bar @ surface
2 1st gen. R.Humidity, Pressure & Temp. loggers

The first time I make a machine, it usually takes a week or two of experimentation, and plenty of epoxy, wire & PVC goes into the bin. But now that the logging platform is more developed,  it is getting easier for me to come up with new sensor/logger combinations. While the underwater housing remains the most time consuming part of each build, the overall improvements in design, and in my own skill level, show clearly in the number of units we have been able to deploy over time:

Cave Pearl DIY housings made from PVC

So I guess that’s a report card of sorts, and I owe thanks to all the Arduino makers out there who shared their code & experience, because they really made it possible for me to pick it up as I went along.  But even with that help, there were still a few bits of information that would have been really nice to know a year ago, that I that just did not find anywhere on the web.  So I thought I would address some of those questions.

How much does it cost to build this stuff?

As a long time freelancer, I keep pretty detailed records. By the end of 2014, the cumulative hardware cost came to about $10,000  including all electronics, tools, and pvc parts. Yep. Really. The waste generated in the process, as you hunt around for the “right parts” is significant, and in the early stages I build at least two units that never leave the bench for every one that makes it into the field.  Now I try to buy “just enough” material to build the next 3 or 4 units, no matter how ridiculous the shipping charges are. (often more than the parts themselves)  If you try to order the cheaper parts from eBay you end up with 2-3 week shipping delays, which is a real impediment to your prototyping workflow.  The problem is that every design change leaves you with a handful of leftover bits from the “old” version, and I now have a substantial collection these orphans in boxes all over my workshop.  Even with diligent effort about 1/2 of the electronic parts I purchased did not get used. (at least not yet…the prototyping is going faster now that I have a critical mass of components on hand) Also, I would advise anyone to buy better tools right at the start, rather than wasting your money working your way up through crummy soldering irons, and low budget saws. A good table top band-saw & drill press are essential.

Should I make a blog for my project?

At the beginning, I really had no idea if it was worth the time and effort to maintain a blog like this. But I know several people who are smarter than I am, working on equally cool projects that no one will ever hear about because they have not put the word out.  So for them I thought I would post a snapshot of the stats from this little opus, which has not been subjected to any “How to promote your blog” efforts because I don’t have any spare time left.  I post links in forums when I have something useful to contribute, and a handful of people have given a nod to my project, but that’s about it:

CavePearlBlogTraffic_2014

In total there were 6861 visitors in 2014, generating 19,456 page views.
At the start of the new year, the stats look like this:

CavePearlBlog_TypicalWeeklyTraffic

As you might expect, at least 1/2 of all traffic comes from the U.S. The UK and Germany lead the western European contingent, which adds another 1/3 of the total, while the remainder is sparsely distributed around the globe.  I used to get really excited when some new country generated a big spike in traffic to the blog. Then my brother explained how botnet attacks work. This went a long way to curing my daily compulsion to check the wordpress stats because the truth is they probably don’t care that much about underwater data loggers in the Republic of Elbonia.  Still, some stats are useful, like the fact that 99.9% of the traffic comes in from Google searches.  Ignoring the home pages, posts with content on “How to do X with an Arduino” are by far the most popular:

CavePearlBlog_TopPages

I was surprised to see the RTC page rise so high in the ranking and I was probably just the first person to gather that information together in one place.  When a page does rise above the one-per-day hit rate that just about everything seems to get (from search engine spiders?),  I maintain that page with regular updates, and that seems to be paying off. I also take the time to cross-link extensively between old and new posts, because several people have complained that they could not navigate around “my website”. There are still many people out there who do not know how blogs work, and almost no one uses the built in search feature.

Where does the project go from here?

On the physical side, I need to make the process of assembling the underwater housings less labor intensive, and I need to improve the overall response to flow rates less that 1 cm/second because the deep saline circulation in those caves is very slow. Wherever possible the design also needs to make in-water procedures for things like buoyancy adjustment faster and easier.

On the electronics side, I will hunt for ways to reduce sleep power consumption, while continuing to use cheap components in my basic “off the shelf” design criterion. I have to find or develop better sensor calibration methods, and there are still many code issues to sort out. With some basic improvements in buffering and data handling during processor up-time, I think I could still see significant improvements in the power budget. Using other data formats is one obvious approach, because it’s all basically integer data. But I will probably stick with ASCI for a while yet, as PString makes the code very easy to modify when I change sensor configurations. This is important because the “sensor caps” are interchangeable modular units, independent of the logging platform and the rest of the housing.

I am finally getting comfortable tackling new sensors at the datasheet level and I now have a general sense of how to get communication working between breakout boards and the Arduino.  I accept the criticism that so far I have been making DIY versions of sensor & logger combinations that are already available on the market; in essence trading build  time for money.  With a year of work under my belt, I would say that this trade is not worth it for equipment that you only need one of,  because getting that first prototype operational usually costs you more than you would have spent on the commercial sensor. It starts to be worth it when you reach about ten units, because by then you have all your parts sourced and you can build them pretty quickly.  From that perspective, this project is just starting to reach a break-even point, with the added benefit that we can make custom builds for a particular research question.  Of course, sorting out a new instrument is so immensely satisfying that I would be doing it no matter how many we actually needed.   My hope is that by the end of 2015 I have the chops to develop genuinely new devices that no one has ever thought of.

But looking at the page stats again reminds me that I probably shouldn’t spend too much time writing posts like this one.  I need to get back to the bench and figure out how to do more stuff with an Arduino…and then write about that.

<— Click here to continue reading the story—>

Field Report 2014-12-20: Our 2nd Drip Sensor Deployment at Rio Secreto

Now that we had all the flow sensors under water, the last big item on the to-do list was the installation at Rio Secreto. New memory cards brought all the 1st generation units down to a more reasonable 0.33 mA sleep current.  The new builds were even better, coming in around 0.22 mA, and they have 32k eeproms allowing them to buffer up to five days worth of data. Not wanting to risk too much on an untried idea, only three of the new builds are pin-powering the RTC, allowing them to get below 0.15 mA between drip counts. I have high hopes for this whole generation, and each has slightly different settings, to help me zero-in on an optimal approach to the eeprom buffering.

Ben Schwartz, Edward Mallon, Fernanda Lasas, Aubrey X

Ben Schwartz, Ed Mallon, Fernanda Lasas, Aubri Jensen

We were very happy to have other cave researchers join us for the day. It never hurts to have extra people on hand for the manual counts, because recording those initial drip rates the “old fashioned way” can take a substantial amount of time. It’s also good to have a fresh set of eyes on the installation, as I often miss things that are embarrassingly obvious while I juggle the low level details about each sensor in my head.  Being able to point out errors like that, with a sense of humor like Ben’s, is one of those vital fieldwork skills that never seems to make it onto the resume, but probably should. Of course, when you bring a bunch of karst researchers together in a beautiful system like Rio Secreto, the conversations start to sound a bit like this. (just substitute in the word “stal”)  I noticed a distinctly inverse relationship between our progress through the cave, and the number of syllables per second  😉

Here Aubrey and Ben are timing drips at a typical cluster.

Aubri and Ben record drip intervals at a 3-unit cluster.

The first chamber (which we started calling Fernanda’s Lab) had a beautiful stalagmite garden on offer, and we tried to cluster drip sensors on actively growing stalagmites of different heights and shapes.  Understanding how drip dynamics and vadose zone chemistry contribute to stalagmite growth is something of a holy grail for my wife, as it underpins all the paleoclimate records that people derive from cave formations. Of course if figuring that out was easy, someone would have done it already.  So we set to work locating drips with the “right stuff”.  Five units ended up in the stall garden, with another cluster off at a more distant pool.  Units 04, 05 and 07 were replaced in their former locations with more robust anchoring this time, as these locations had been washed out by a high water event during the last deployment.

Hopefully the ledge will give some measure of protection

I put the new babies under a dry ledge to keep liquid water away from the humidity sensors.

The last data set gave us a gorgeous pressure & temperature record from the MS5803-02 and I continue to be impressed by sensors from Measurement Specialties.  This time round we had two pressure & RH sensors to deploy in the cave, but I have no idea if those HTU21d’s will survive such long exposure to the high humidity cave environment.  The  5bar pressure logger that we patched up with glue was going to be deployed on the surface, with a drip sensor beside it acting as a crude rain gauge so we can get a better sense of what the cave drips are responding to. By the end of the day we had fifteen instruments on site, making this our largest installation ever!

<— Click here to continue reading the story—>

Field Report 2014-12-18: A Water Flow Sensor Co-deployment.

Heh gringos! No Cueva!

No cueva aqui…

Over the next couple of days, we managed to double the number of flow sensors in the core systems along the transect that Trish was studying as part of a biology project headed up by Dr. Fernando Alvarez from UNAM in Mexico City. We revisited our test rig at the coastal site, leaving a set of three flow units there along with our 2 Bar pressure sensor. All had been tested showing good sleep currents, so hopefully we would not loose our data this time.  Those dives went smoothly, and we ended up with a rare day on our fieldwork schedule that was not already booked.

We knew there was a system in the area were some biologist friends had a Lowel Instruments flow meter (the first time I have seen a commercial unit use the tilt/drag principal…) installed beside their monitoring equipment. But the meter was scheduled for removal in January of 2015 – so this opportunity was brief.  If we could make it out, a co-deployment would give us a chance to compare point velocity numbers from a commercial unit with our DIY project data.  On the down side, it was quite a haul to get out there, on a road that our little rental car was not really capable of handling.  But, thanks to my marathon rebuild session, we still had three flow sensors that we could deploy…

We decided to go for it, and just bring everything along in case the system looked interesting. Thirty minutes of slowly bumping, clunking and screeeeeeeeeetttcccching past the machete stumps, and we made it to the walking trail. From there we still had a good march out to the cenote, so we donned our gear and set out with doubles on our backs; placing each foot as carefully as we could on the uneven trail, while also trying to move fast enough to outpace the mosquitoes.  By the time we reached the water, it was getting pretty hot in those wetsuits!

Yep, we were not going to smell pretty after a dive in this stuff.

Yep, we were going to smell mighty good after this dive.

After we had cooled off , we did the pre-dive checks, secured our mesh bag full of sensors, and set off along the line.  And the water was…. brownish green…(?)  Much more than the other cenotes we had been diving in. But then I noticed that some of those bits of perc were actually moving around, under their own steam, and I understood why a group of biologists would select a site that was so darned awkward to get to. It was heaving with little critters!  When we found the site they had chosen for their monitoring equipment it was at the top of a trapped dome, probably perfect for monitoring things like nutrients, but almost certainly with too little flow for my Pearls to register. I set up a sensor anyway, thinking that if it was a zero flow location, we were not going to have much data to work with for that calibration. Who knows, perhaps we would get lucky and catch a big rain event flushing out the system during the overlap of the two meters?

Then we explored further into the cave.  The line soon descended below the limits of our humble point and shoot camera (so we had to leave it behind), but the visibility opened up below the tannic water showing a spectacularly wide passage, with the fresh/saline transition smack-dab in the center. Trish immediately became very excited, pointing out that there were ripples in the sediment.  We swam further into the passage, and she hand signaled her intent to find a location for a dual installation with our last two units.  I waited on the line while she searched, watching the slowly undulating halocline as it scattered our dive lights across the walls of the passage like a fun-house mirror. Once a site was selected, we configured one unit as a float, for installation on the floor of the passage, and directly above that we hung our last unit from the ceiling; up in the fresh water zone. After an inspection swim to check connectors & compass bearings, we shook hands in an exaggerated ceremony before following the jump reel back to the main line. I don’t think we could have picked a better place for our last installation of the trip if we tried. Worth the hike, and the bugs, and all the scratches & dents we put on that rental car…which now all seemed quite minor…really…no problem at all 😉

<— Click here to continue reading the story—>

Field Report 2014-12-16: Rebuilding & Reloading the Old Sensors.

The depth limits on our point & shoot camera prevented us from capturing photos from the dives. But a pile of 1st & 2nd gen units was slowly accumulating on the floor in our room...

1st & 2nd generation loggers were accumulating rapidly…

Each of the next few days started with a dive to replace old units that had been installed in deeper passages along System Ox Bel Ha, with the new generation of flow sensors.  To avoid the ballast problems we had on the last round of salt water deployments,  we decided to adjust the buoyancy of each flow sensor in-situ, while it was hanging from the support rods. The connectors themselves contributed varying amounts of negative buoyancy depending on their distance from the pivot joint, and some of the deep sites needed up to four rods (~2m) to get the flow meter into the right location in the water column. This required more time at depth than I would have liked the first time we tried it, but over the next few deployments we got reasonably good at weighting the units so that they were sensitive to the gentlest water movements. I need to put some more thought into making this procedure easier to do.

And we knew how important this fine-tuning was in the deep saline zone because each unit we downloaded told us that the August flow sensors were far heavier than they should have been. Ten grams of negative buoyancy is fine in a coastal discharge that races along at 15 cm/second, but when the fastest flows are below 1 cm/s, the pearls needed to be as light as a feather.  Semi-diurnal tides that jumped off the screen when we plotted the data from high flow sites, barely rose above the ADC noise in systems like Maya Blue and Jailhouse.  Of course there were more epoxy failures, and we continued to see units brought down by fake SD cards. The combination of these factors meant that we lost most the data from the last generation of flow sensors. I will never trust retail packaging for electronic components again.

Each rebuilt unit needed a 24 hour test run...

Each rebuild needed a few days of testing to catch code bugs…

And for the first time, we had so many sensors returning from deployments that refurbishing & reloading them was turning into a major part of the trip logistics.  That sounds pretty obvious in hindsight, but I was so used to having the opposite problem: where we concentrated on squeezing every possible  dive out of the “precious” YSI Sonde or Hydrolab, that having to triage old data loggers had never happened to us before. I started migrating parts from the younger units with failed epoxy, into the older generation builds with sound housings. Then every logger had it’s SD card replaced with ‘good sleepers’, and I tested them over again… just to be sure.  I completely rebuilt two of the Beta generation units for CEA’s open ocean deployement, and finally got around to putting the bma250’s they carried into a low current sleep mode.  I even melted grooves into the housings so that Marco could check the sensor orientation “by feel”, after they turned into floating algae farms.

Good enough for a "surface" deployment

I hope it is sealed well enough for a surface deployment…

Things proceeded well: All clocks on UTC? Check.  Replace old style battery connectors? Check. Good data saves from test runs? Check. Every few hours saw another unit up and running with reasonable sleep currents.  But the failed pressure sensor posed a bit of a problem. Bad epoxy or not, we needed two pressure units running so we could subtract the barometric from the combined signal that the under water units were reading. In the end I decided to re-submerge the older 2bar unit I built back in March, despite the fact that it had already done a long stint underwater, and I would leave the newer 5-bar pressure unit on the surface after sealing the hole with some glue from the local hardware store.

I was so zoned getting all these little Frankensteins going that for a while I lost track of the days.  I think it rained…or maybe it was sunny…because I was in Mexico…right? Fortunately while I was going non-verbal, Ben Schwartz and his crew of avid cavers arrived in Akumal. Being somewhat occupied, I hardly noticed the time Trish spent talking to them about to the region, and it’s wonderful cave systems.  They got the two-penny tour of our humble field station and endured my Cave Pearl “elevator speech”, which was still embedded in my brain from the GSA. Good thing too, as scripting & sleep deprivation had crowded out most of my other brain functions by that point.

And at night our room lit up like a Christmas tree every fifteen minutes, because all the little LED heartbeats were blinking in rough unison as loggers ran their overnight tests…

<— Click here to continue reading the story—>

Field Report: 2014-12-12 Retrieve the Costal Discharge Flow Sensors

The C generation units ready to come home.

The ‘C’ generation units, ready to come home.

We planned on retrieving the deeper system units first, so after our customary visit to Bil’s dive center in Tulum, we headed out to one of the sites that our friends Jeff & Gosia had installed for us back in October.  But a cracked sleeve on one of the high pressure hoses stopped the dive while we were still dry, and we spent a couple of hours hunting for a replacement in town.  By the time we were ready to go again, a long dive was out of the question. So we chose instead head over to our primary test site on the coast. It was a short, shallow dive, and I had a new suspension rig that I was keen to put on the ceiling of the cave to bring those flow sensors closer together.  We only had one new sensor ready for the site, but we could always swing by later to put the other units in.

Uh oh, what is that brown stain on the temperature sensor?

Uhhh, what is that brown stain on the temperature sensor?

The tide was with us, and we were at the site moments after leaving the surface. I did the now routine inspections, noting a bit more wobbling than I wanted to see on the suspension rods. I also spotted some discoloration on the white thermal-conductive epoxy I had used for the temperature sensors. I checked my watch, then the unit, watch, unit,…and saw no LED pips.  Now that was a real cause for concern, but there was nothing for it at this point.  So we collected the old flow sensors, removed the anchors, and I set about constructing a new connection rig from the various pieces of PVC I had in the mesh bag by my side.

It looks more exciting in photos than it does in real life...

It looks more exciting in the photos than it does in real life…

A little extreme underwater plumbing, and an improvised extra support for the center of the rod (thanks to my old nemesis: vortex shedding) we had it installed.  We connected the one new sensor we had with us, and were somewhat surprised that it took almost 180 grams of ballast to make it neutral (?), then I remembered that I had lithium batteries in this unit.  High  power/mass ratios are not as advantageous as they might seem in underwater applications.  After returning to the surface, I cradled the Pearls as we drove the tanks back to Tulum, watching for any signs of life, but it was starting to look like all of the units had expired.  I was pretty unhappy about that, especially since C1 was a “Rosetta stone” build, with both a BMA180, and a BMA250 acclerometer inside. I planned to use that data to develop a transfer function that could merge the data from the different build generations.  Now it depended on how long that logger had operated before the epoxy let go. If water had entered the housing, there might not be any data at all. I was also cursing myself for putting an untested adhesive on the pressure logger, as that was our only reliable tide record for the site.

Pretty bummed out at this point...

Wanna see a maker cringe?  Show them this

Back at base, I had a chance to examine things more closely, and the news did not get any better. The new epoxy had degraded into a flakey, rubbery mess, and rust had devoured my temperature sensors. My only hope was that the plastic weld putty around the wires passing through the hull had provided some measure of protection in the shallow water.  Once we had photos of the damage, I started opening them up.

I was not expecting much, so I was pleasantly surprised to find that the loggers with the white epoxy had no water in the main housing. Both C1 and the pressure unit had small battery leaks, because the power module shorted out when salt water bridged the contacts, and alkalines usually pop if you drain them completely. The data files on the SD cards were intact, showing that C1 had two weeks worth of data, while the pressure sensor ran for a month before it lost power. I copied the files over to Trish, and moved on to other forensics.  As with the Beta units in the Akumal Bay, the RTC’s had lost between 30-40 seconds of time over the three month deployment.

The test rig in place

The parallel deployment rig after installation.

Then I turned to C2 and C4, which had been spared the bad epoxy. I had hoped for a full data set from at least one of them, but the log showed that they  barely squeaked into October before pulling their batteries below the 2.8v cutoff. That meant we now had a month long data gap for a system that we had been monitoring continuously since the first alpha units went in. The C2&4 units power curves were so spectacularly bad that I immediately restarted them on the meter, and discovered that both of their SD cards were terrible, with one of them drawing > 7mA while the logger slept. (That’s probably some kind of record, and I am temped to mail it to Bunnie, to see where it came from.)  And just to pour salt on the wound, the 7-8 month lifespan projections from the previous generation made me pretty bravo about power consumption back in August.  So I left the C’s running on a short 5 minute sampling interval, taking three times as many data points as we actually needed. Had I set them to a more pedestrian 15 minute sampling schedule, they might have pulled though. Arrrgh!

But in the end, we had something to work with, and that’s all we really need from these early builds. While I was grumbling about crap SD cards, and adhesives made from leftover chicken parts, Trish had been click-clicking away happily on her data.  She was in a much better mood than I was, so I asked her to cheer me up with a quick peak at some of the raw Z axis records out of C1.  In theory, the 14-bit/1g bma180 (in blue) should outperform the humbler 12-bit/2g bma250 (red) which I had used on the earlier builds:

StratifiedValuesforTwoacc_redisBMA250That 250 data is more stratified, but not nearly as much I was expecting, and the difference in signal magnitude is almost negligible.  Huh…perhaps that inter-generation data translation is not going to be as tough as I though.

By this point (2 am? ish?) my own batteries were running low, so we called it a day. Not a great day mind you, but sometimes that’s just how it goes.

<— Click here to continue reading the story—>