Category Archives: Expedition Reports & Updates

Photos, videos & reports from the field.

The 2016 Cave Pearl Project ‘Year in Review’

That's a chain with 24xDS18b20 sensors pulling only 0.15 mA sleep current. Woot!

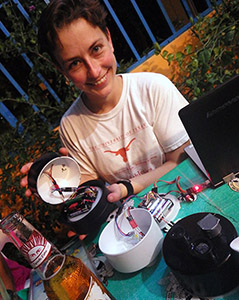
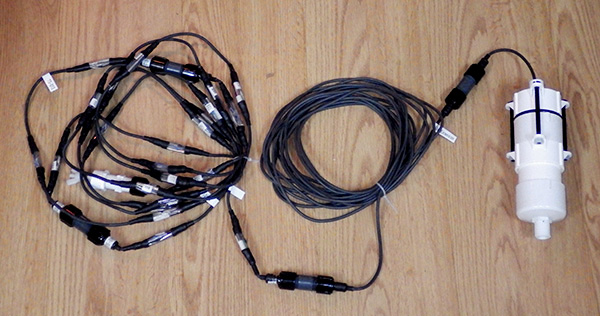
That’s a chain with 24 DS18b20 sensors pulling only 0.15 mA sleep current. Woot!

We made great strides in 2016 with development of new calibration procedures and continued refinement of the housings & connectors for multi-sensor builds. At this point I’ve cobbled together more than 130 loggers for the Cave Pearl Project. While I still have a way to go before I reach Gladwell’s 10,000 hours, we haven’t spent $71 million, and I think I’m starting to get the hang of it. Of course, I felt that way last year too, so perhaps that’s just as good as it gets when you are figuring things out as you go along. It’s not unlike that moment when your boss calls you in for the annual performance review, and then starts the meeting by asking you to rewrite your job description, again, because less than half of the work you actually did last year was in the previous one.

Despite all that building, the number of loggers out on deployment leveled off around sixty five as newer units were often used to retire earlier generations out of the fleet. It’s worth noting that those old dogs are all still running, but field logistics have reached the point where we can’t expand the project unless everything on active duty has more than a year of operating life.  Fortunately the latest Pearls are consistently delivering sleep currents around 0.1mA , so builds with more than three AA cells are probably going to run for two years or more. 

No one ever seems to bother our equipment installations...I wonder why that is?

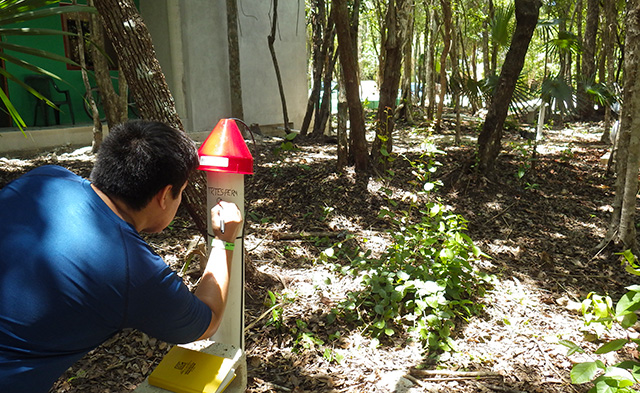
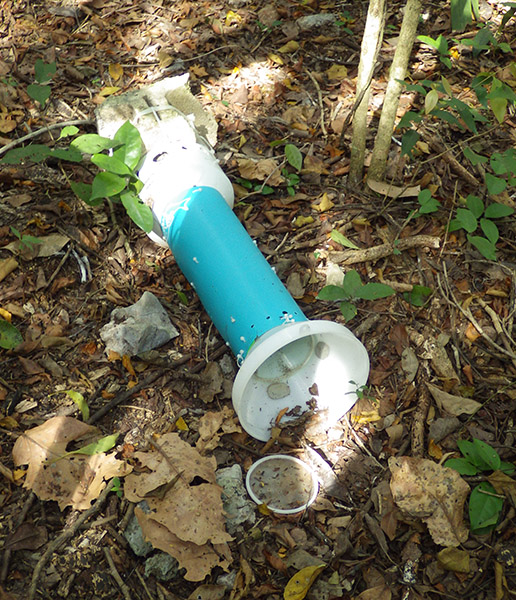
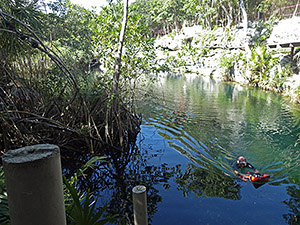
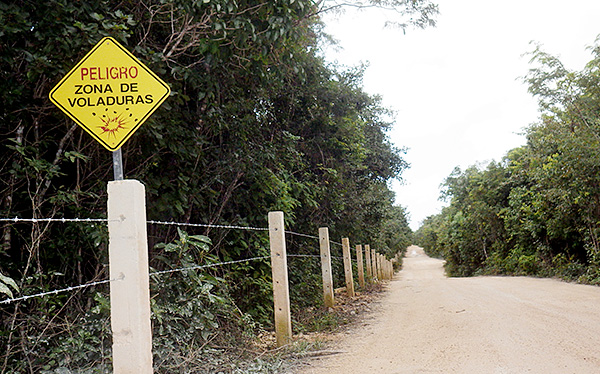
No one ever seems to bother our equipment installations.  I wonder why that is?

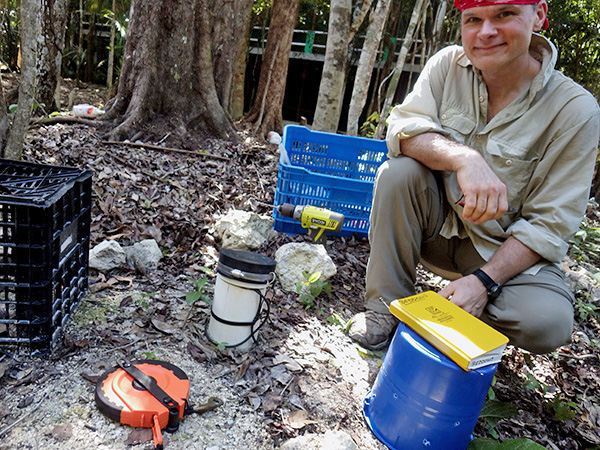
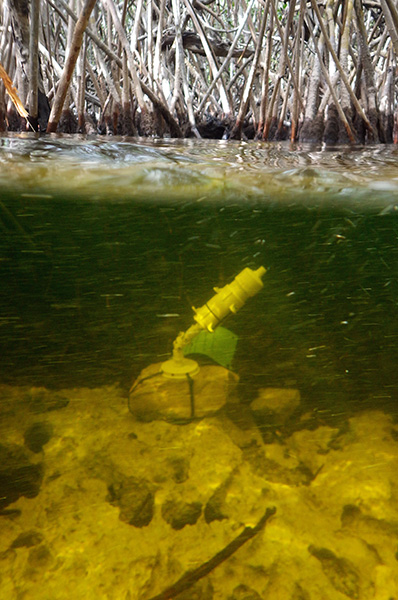
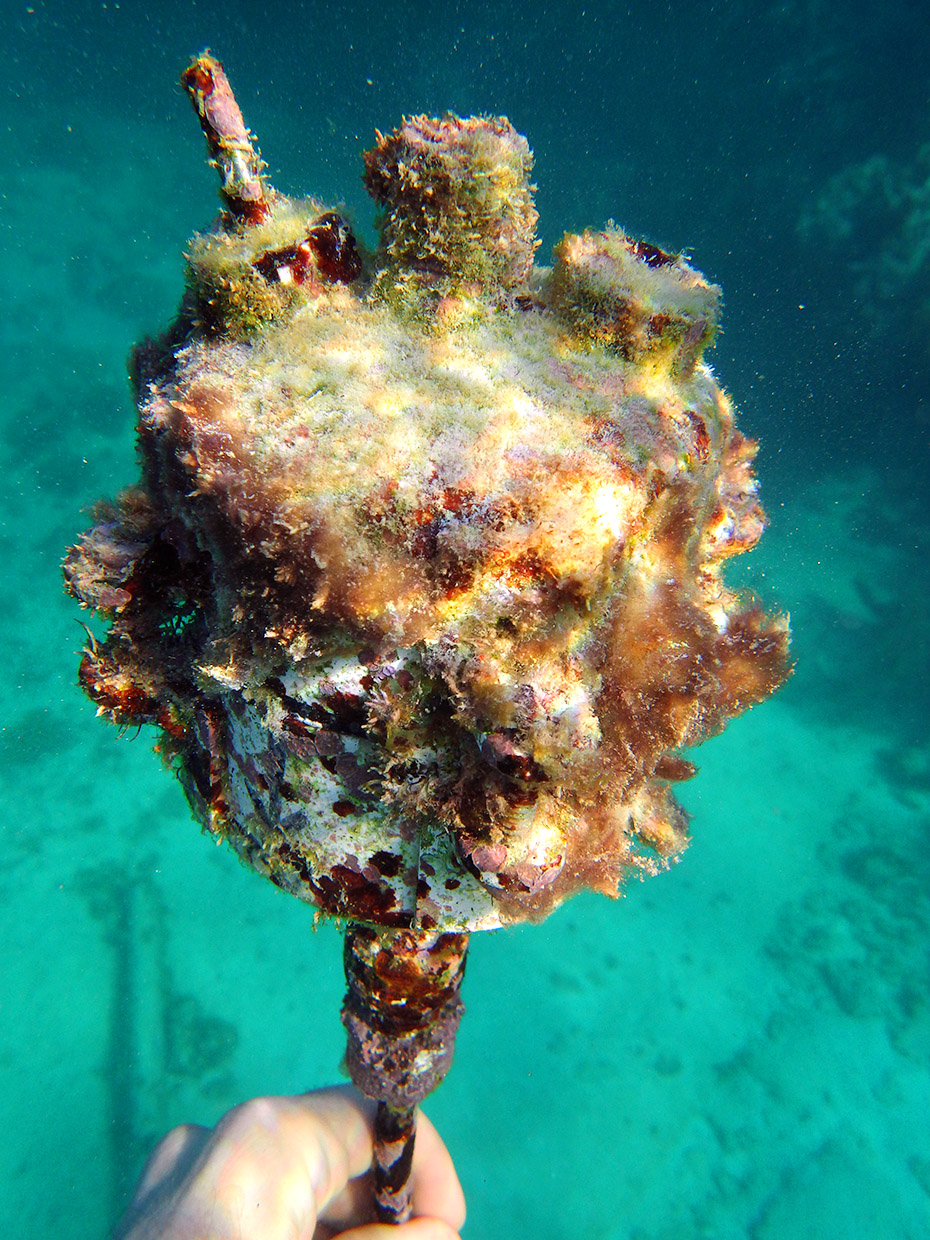
The temp. string loggers are currently the most complicated builds, but they have been delivering some very impressive data sets. Despite their flagship status, most are deployed in sites with a nasty mix of salt water and hydrogen sulfide that’s been destroying the marine grade stainless steel anchor weights. As they take a while to assemble, on-site service and redeployment will be the norm for  those logger installations until we get more of them into circulation. Rapid turn-arounds like that were one of the original goals of the project, but that’s only possible in practice because none of our current sensors are affected the bio-fouling that accumulates over a deployment.

There are plenty of new sensor combinations on the todo list as we round out the hydrology tool kit with more cheap & cheerful ‘tattle-tale’ builds. The recent discovery that you can stretch the I2C bus out to 10’s of meters has opened up many new sensor possibilities.  Long-cable MS5803 pressure sensors are now being put into service for borehole logging and if I can reduce the thermal equilibration time, that sensor also shows promise as part of a drop profiler.  From very the beginning, we’ve had our sights set on a cheap reliable CTD with extended logging capability.

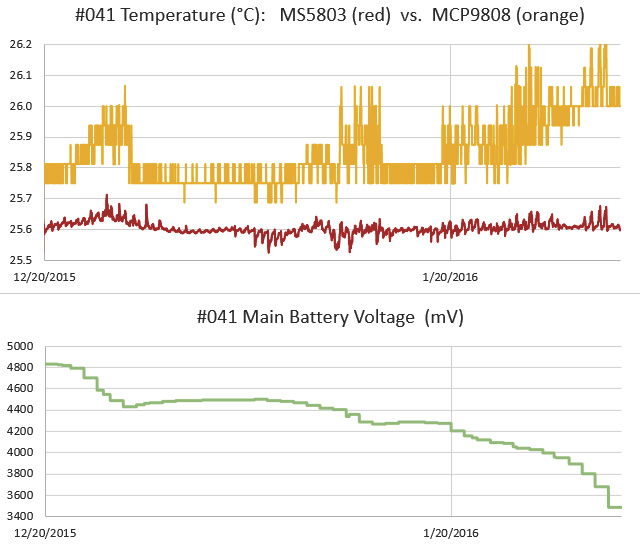
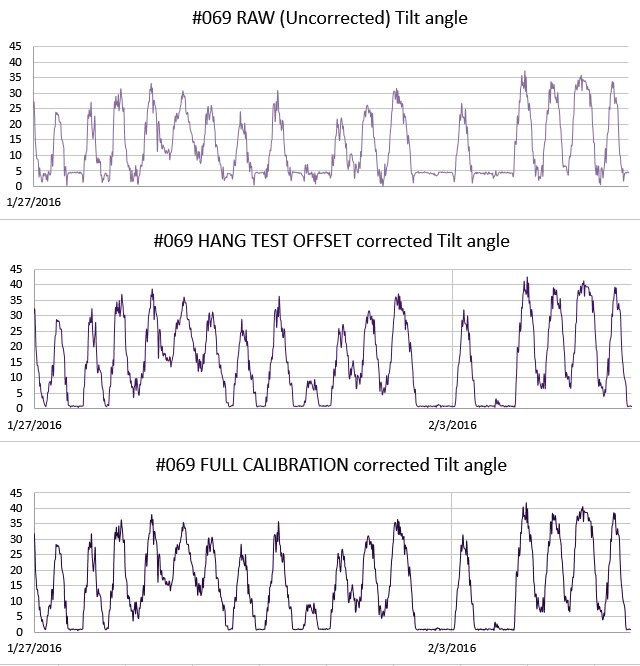
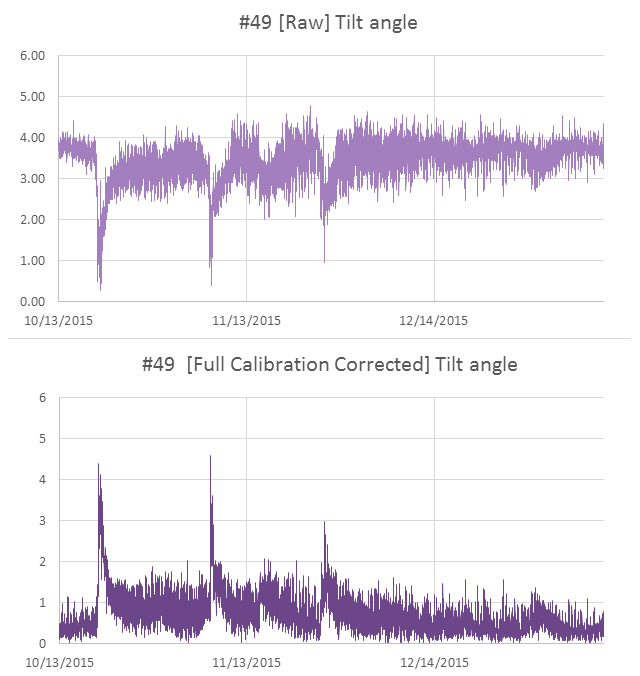
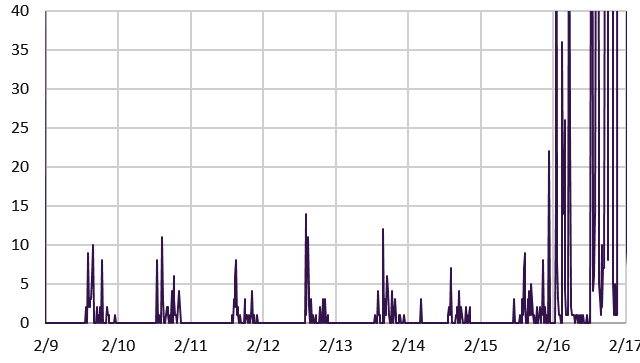
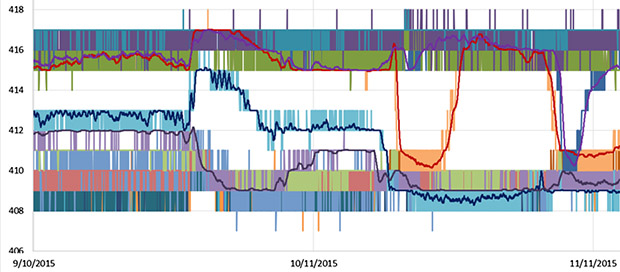
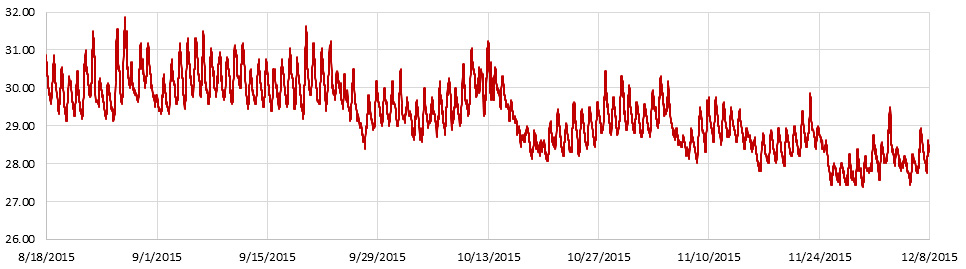
Our oldest monitoring stations are reaching the three year mark, which means we are starting to see repeating annual cycles in the data. As an example, here is the temperature and tilt record from one of the reef stations in Akumal Bay:

annualcycles

The occasional hurricane means there are some lovely ( …to a hydrologist  🙂 ) event records peppered throughout, but the real prize is the baseline data that you only get from multi-year deployments. From the builders perspective, those long records also give me a sense of the inter-unit consistency, which is looking  good despite substantial  changes to the loggers over time. As the project matures, more of my time is being dedicated to sensor calibration and normalization.

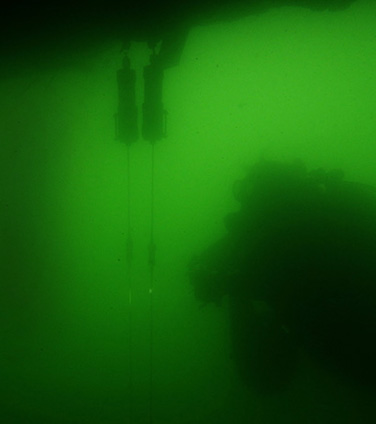
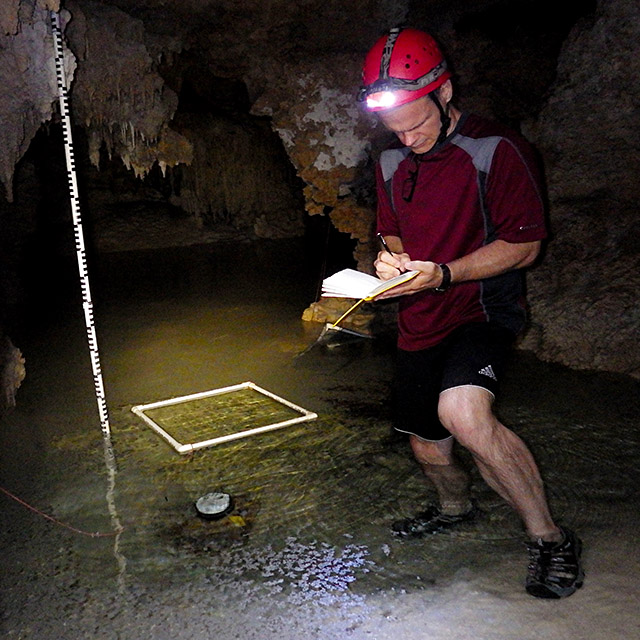
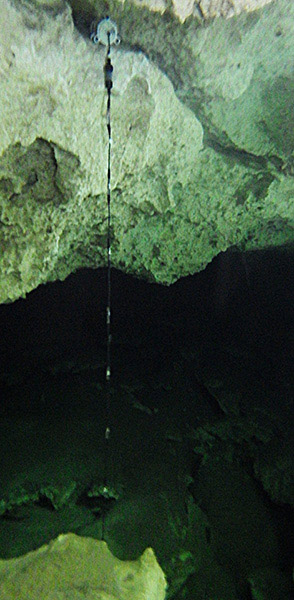
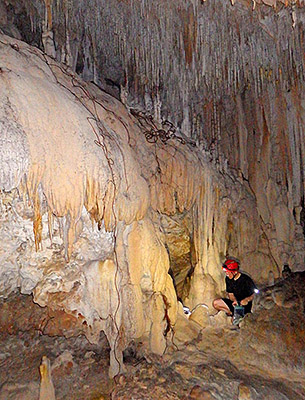
Though we rarely have enough visibility to capture it with our little point&shoot camera, the underwater procedures are getting smoother too:


Cave Pearl data loggers

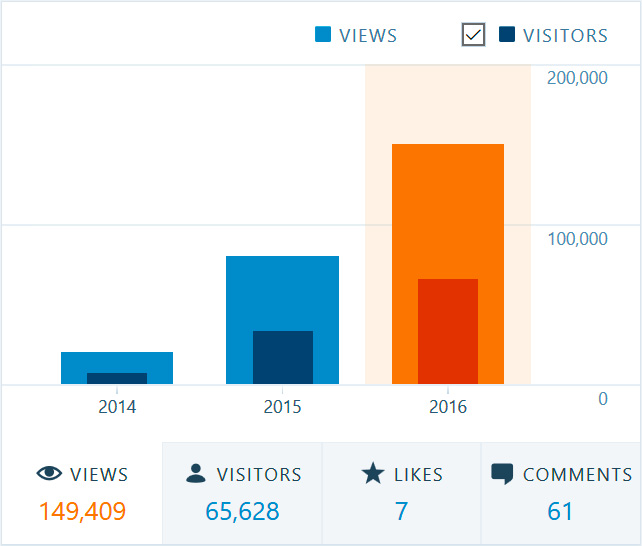
At  ~6000 unique IP’s a month, traffic continues to grow, though I will have to manage more than one post per month if the project is ever going to be a real contender for science geek fame.  The UNO logger has now passed the RTC post in the daily rankings, which shows that the number of interested beginners is also increasing.  The US dominates the overall traffic at (with about 50% of the total), and Germany leads the European traffic, often coming in second only to the US.  If other DIY sites are seeing a similar trend, then I think it’s pretty obvious why Germany continues to be the economic powerhouse of Europe

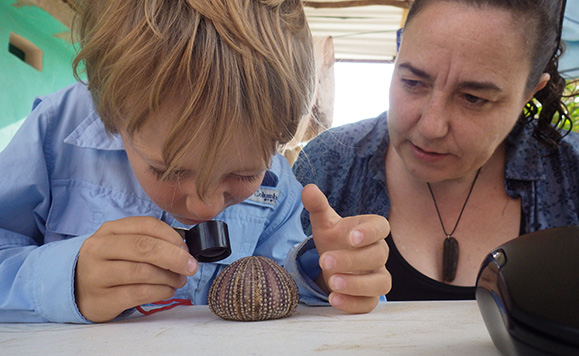
Many years ago I did a short stint as a high school science teacher and some of my good friends are still in the trenches.  Conversations with them often highlight two things:  How their job now depends on standardized test results (so they don’t have much room to change the curriculum), and that resource budgets are shrinking to zero. These are dedicated people who are more than willing to go the extra mile if they can get their hands on the right material.  So I’ve been working to expand the online tutorials into a set that would help a teacher add Arduino based lessons to their curriculum, even if they have do it out of their own pocket:

2016 was another great run of Trish's Instrumentation & field methods course. It's impressive with how quickly the students pick up the Arduino, and everyone got their final projects running though most of them had never held a soldering iron before.

2016 saw another great run of Dr. Beddow’s Instrumentation & Field Methods course. It’s impressive how quickly the students pick up the Arduino system, and everyone got their final projects running though most of them had never used a soldering iron before.

  1. Build your own Arduino classroom
  2. Arduino UNO Logger for Beginners
  3. Using the UNO for Data Acquisition
  4. ProMini based Data Logger (update)

I’m sure that most people missed the significance of the DAQ post when it came out, but in terms of teaching it’s probably the most important one in the set. The IDE’s new plotting function makes it easy to do live demonstrations in front of a classroom simply by adding one print statement to the code:  nothing I’ve tried before even comes close to this level of simplicity.

I use my  ‘UNO-scope’ all the time now because I can do a quick screen capture  or I can send a series of runs to a serial text monitor. In both cases, calculations can be done on the Arduino before the output is sent, converting the raw ADC readings into something more meaningful like current or power.  Then I can go hunting for unexpected events by graphing it up in Excel.  This approach has let me track down things like SDcard weirdness that are very hard to capture during normal logger operation because they only happen when you pass some threshold inside the flash controller:

Cave Pearl data loggers

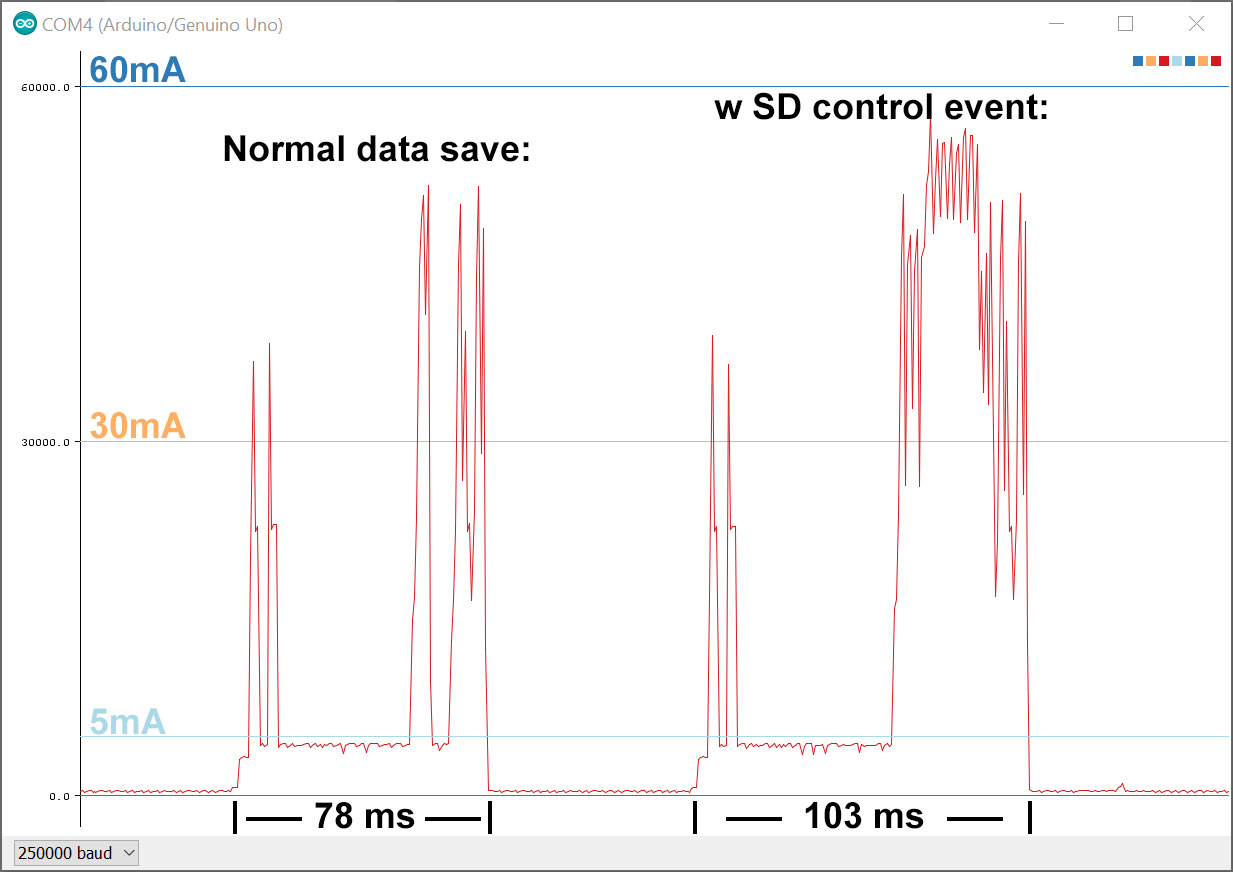
I’ve overlaid the bold numbers, but that’s a screen capture of the IDE output. Modern scopes can do this kind of thing too, but you’ll be hard pressed to find one for the price of an Arduino clone on eBay. With a low value shunt resistor, you can push the ADC clock pre-scalars into the 20-40kHz range, which is more than adequate for the kind of diagnostic work I’m doing, and most stuff you’d be trying to demonstrate in a high school physics class. 

DIY Cave Pearl data loggers based on Arduino Microcontrollers

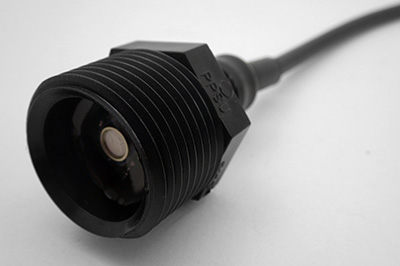
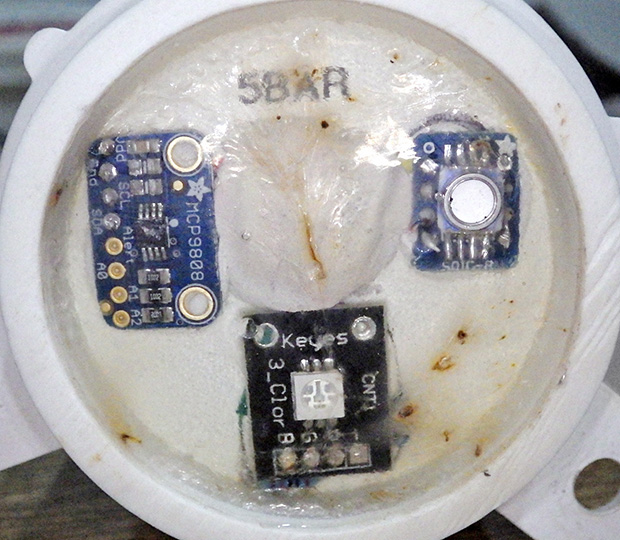
My PVC housings sport smaller separate wells for each sensor as I’m trying to reduce the surface area exposed to pressure & salt water. So far we have only deployed them to ~30m, but deeper sites are on the calendar in 2017.

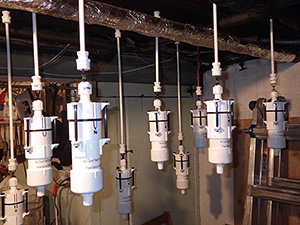
3D printers are finally reaching a price point where people can afford one to help them pursue other more interesting hobbies, and as key patents continue to expire,  new/old high-end tools are entering the consumer market: Forget 3D-Printed Knick-Knacks.  But it’s worth noting I haven’t used any of these tools on the project because I can still build more durable housings out of plumbing fittings from the local hardware store. Total part cost on those is ~$15, and I probably spend less time making them than I would repairing holes or fixing mesh errors on a constantly evolving 3D printed version. But I’m sure the strength and print quality tipping point will occur eventually… probably when DLP’s with stronger resins reach the kind of price point we are currently seeing for extrusion printers.

I will add more tutorials to that set over time, and hopefully we’ll manage to publish a paper or two this year.  The plan is to put them in open source journals so everyone in the world has access, and if we spin up all the collaborative projects we’ve been planning with other researchers, 2017 promises to be a very busy year.

Addendum 2017-01-10

2016 was also a banner year for the Maker movement in terms of media coverage. So I thought I would add selection of those articles here:

Why the Maker Movement Matters: Part 1, the Tools Revolution

Why the Maker Movement Matters: Part 2, Agility


Sometimes those geeky editorials make me laugh, but even then they are still thought provoking.  It’s also good to see more thoughtful criticism and self reflection going on as the movement matures it’s way through the Hype Cycle (beautifully illustrated by this 100+ year old debate about the Wright brother’s)

Making It

Makerspace: Towards a New Civic Infrastructure

Why I Am Not a Maker

Unfortunately that also means the market has grown to the point that the big boys want a piece of the action. While this probably won’t be another  “Embrace, Extend & Extinguish” situation, commercial players inevitably increase the pressure to commoditize the product into easier to use (& thus more sellable) packages. I can see good arguments to support this but I have some concern about developments (like the ESLOV) which eliminate the user’s exposure to actual code: turning great problem-based learning exercises into plug & play activities.  Unless you let students see ‘under the hood’, they’ll walk away thinking technology is about connecting little black boxes for participation marks.  By now it’s clear that we are heading toward a IoT powered world of self driving carsBaxter bots, and staffless stores.  So I can’t help thinking that unless our young people can handle Arduino level programming tasks, they won’t qualify for a job making toast.

Addendum 2017-04-30

On the topic of media: looks like the one-word journals are finally starting to notice the open source hardware movement. Better late than never, though I suppose with all the mergers going on, the whole makers movement isn’t much more than a rounding error on corporate scale balance sheets. 

<— Click here to continue reading the story—>

Field Report 2016-07-09: I²C pressure sensors work on 20m long cables!

Peter Carlin, Jeff Clark, Alex, Trish, and Gosia.

Peter, Jeff, Alex, Trish, and Gosia.    Jeff, Gosia, (and Natalie) took time off work to do some of the more intense installation dives, which helped tremendously.

With the term prep taking up everyone’s time, I almost forgot to post about the wonderful field season we had this summer.  We really covered the bases on this one: from surface loggers, to cave sensors, to new deployments out on the reef.  And there were plenty of new toys in the show, including a couple of “All hands on deck” days for the deployment  and retrieval of several POCIS (Polar Organic Chemical Integrative) samplers.


Dual MS5803 pressure sensor unit for tide gauge & Permeameter

A dual MS5803 pressure sensor unit with the same cable & waterproof connectors I use on the DS18b20 chains.

Potted with E-30cl

Potted in E-30Cl epoxy.

Most of the new instrument deployments on this trip were DS18b20 temp chains and deep pressure loggers. While those under water units continue to give us great data, I’ve added a new model that can record water level with a  MS5803 pressure sensor at the end of a long cable.  That sensor has two selectable bus addresses, and I was very happy to discover that with one on the housing, (recording atmospheric pressure) and one on the end of an 18m cable, both sensors will read OK with 4K7 pull-ups if you lower the bus speed to 100 kHz.  Slowing things down to 50kHz (with TBWR=64; on my 8Mhz 3.3v loggers) let’s me extend that out to 25m, again with the default 4k7s. I’m sure you could stretch that even further with lower pull-up resistor values.  I honestly didn’t remember anything in the specs that said an unmodified I2C bus could be extended out to the kind of run lengths you usually see with one-wire sensors…

Peter Carlin did all the heavy lifting, including several long nights feeding mosquitos...

Peter did all the heavy lifting for the permeamters, including some late nights checking all the stations.

This opens up tide monitoring from  stations above water, and will let us capture some decent bore-hole records.   And since I mounted the pressure sensors inside threaded fitting, we could attach the them to a reservoir for other interesting experiments. What we actually used them for on this trip were falling-head permeameter tests.  One of Trish’s undergrad students planted a veritable forest of PVC tubes in locations all over the field area.   Though he built a couple of the loggers himself in the instrumentation course, it was interesting to see him working through all the other things it takes to run an experiment in the real world. Some of the limestone mounted tests took many days to run, as compared to the much shorter times you see with soil, or cement. So being able to let the data loggers record those slow level changes was a real help.

Checking on one of our water level recorders

One of our older in-water level recorders, with the pressure sensors directly on the housing. This station has been in place since Kayleen recorded the big floods in 2013.

While he was out mixing cement & feeding mosquitos, our room turned into a rolling conveyer belt of incoming an outgoing loggers. With many of the drip logging stations approaching two years in service, I was expecting some attrition  in the set at Rio Secreto. To my surprise the majority of sensor failures were from the newest units installed last December. I had used more expensive Adafruit  breakouts for those builds (while the older drip loggers were built with $2 eBay boards) I’d love to say this is an anomaly, but after building & deploying more than a hundred of these things,  it seems that IC sensor longevity can be unpredictable, no matter where you buy them.  And we are not exactly treating them nicely…

As usual there was lots of great diving, and we even got back up to the north coast to replace those opportunistic mangrove deployments from the last trip. I still can’t get over how lucky I am to be able to see the diy loggers going out in the wild like this.  But for Trish, all this is just, you know, another day at the office…

Of course by the time we reach that point, my work is pretty much done. She’s the one who has to wrangle with all the data, and writing a good paper is a lot harder than building a few loggers…

Addendum 2016-11-23

Not that I need them at this point, but I just stumbled across some I2C extenders over at Sandbox electronics. They claim up to 300m with their differential extender.  Those NDIR CO2 sensors also look interesting, but with the caves over 95%RH for significant periods of time, there is some question  about whether those sensors would work.

Addendum 2016-12-20

A borehole installation for one of the dual pressure sensor loggers

We finally got one of the dual 5803 units set up in an unused well. This has been on the to-do list since mid year, but as you might imagine, there are not that many wells that get drilled without being used right away, so we are very thankful to the land-owner.  Of course there is so much pumping going on in the general area, I have a niggling concern that what we will really be recording is the draw-down, rather than the level of the aquifer itself.

<— Click here to continue reading the story—>

Field Report 2016-03-28: Oldest Generation of Loggers Retired

Securing the backup bungie cord to the anchor.

Securing a backup bungee to the anchor plate.

I know I said I was going to keep the ocean sensors in service till they croaked, but after more than two years of operation I’ve decided to retire the two beta units to our bookshelf museum. B3 & B4 were the last loggers in our fleet based on the Tinyduino platform (and the guys back in Ohio deserve some credit for helping us get the project off the ground!)  The clincher on this decision was the practical issue of still being able to do a full calibration on those sensors, so I can apply that to all that wonderful flow data we’ve gathered from Akumal Bay over the last 14 months.  And you run a risk of loosing your loggers every time you deploy in a high energy environment.

Four Generations of Cave Pearl Data loggers

Four generations of flow sensors, spanning two years of development. Beta4 was literally the fourth data logger I ever made, and the first to run for a significant length of time.

These replacements also bring all of the ocean units into the same generation of Rocket Ultra based builds,  so they should all deliver a year of operation before they need servicing. Much as I loved the Tinyduinos, I never got them down into the 0.15mA sleep currents that I now see the MCP1700 regulator  boards delivering.  As the folks at CEA keep pushing them further out onto the reef,  it’s getting more expensive to deploy & retrieve them, so we need all the run time we can get.

The new locations also mean I can’t just pop in and exchange them on the way to the airport… like I am doing today…

Addendum:
Akumal was the last stop on a busy trip that saw us hopping all over the peninsula to visit colleagues while staying in towns from Tulum to Chiquila.  You see allot of beautiful things outside the tourist strip that never end up in the brochures, but you never quite escape the influence that radiates from that heaving mass of transient humanity.

I think this is reflected in the work of the local artists:

Contrast

<— Click here to continue reading the story—>

Field Report 2016-03-25: Collecting Data in Coastal Mangroves

Their never too young to be a field assistant :-)

They are never too young to be drafted as a field assistants… Eh Trish?

The unique geology of the Yucatan means that hydrologists like my wife typically study water flowing through the flooded cave systems.  But she also advises some of the many great archaeology projects in the area (The Maya had to get their drinking water from somewhere…right?) so we don’t spend all of our time wrapped in neoprene.  Though I have to say that when she does do surface work, she always seems to find the stinkiest stuff around to balance all that canned-air we would otherwise be breathing:

Smells like science!

We did eventually make our way to a wider section where the water was moving swiftly.  The original plan was to simply anchor one of the flow sensors on a rock and drop it in. But after mucking about at the site for a while, we were puzzled to see hardly any displacement on our little tilt meter though the surface flow was quite strong.  Then we realized that the water at our feet also felt warmer than it did on the surface, and it dawned on us that this close to the ocean, the tide was coming in underneath the outgoing fresh water.  The best solution I could come up with on the spot was to put the pivot joint on top of one of the pendulum rods: raising the flow meter to a higher position in the water:

We will have to wait for the data to see if we’ve given the logger enough height and The temperature should tell us if the logger has been trapped in rising salt water.  I would not be surprised if we end up using an entirely different arrangement next time, perhaps with some kind of floating buoy system so we can go back to a pendulum arrangement where the buoyancy is easier to control.  Sometimes all you get from your first deployment, is an understanding of how to do the next one…

BottomDeployment_600

Further in, we could put the logger right on the stream bed which had been scraped clean by the high water velocity. You can tell from the video (above) that we are well past 10cm/sec where vortex shedding starts to be a problem.

The next day we set out at a different river, working our way much further inland to (hopefully) avoid the salt water intrusion.  We also planted a pressure unit to capture water level data near the archaeological dig site.  Given how exposed these sensors are, I can only hope that the local fishermen don’t decide our little bots should spend the rest of their days decorating someones coffee table.

The water in these coastal discharges was racing by comparison to the gentle subterranean flows we usually work in, so I expect allot of turbulent noise in the signal. On top of that the removal of their salt-water ballast mass (used on pendulum installations) moved the center of mass enough that I had to put them in upside down. That’s just the kind of things you run into when you are doing something for the first time. With all the things we learned from the open ocean deployments, I’m really excited to see the Pearls moving into another new environment.

Addendum 2016-07-18

Well we finally made it back up to the north coast, to replace those upside-down units we left back in March:

Happy to report that the first deployment gave us good data, and I think this next crop will do even better, provided they don’t get hit by a passing boat propeller…

Addendum 2017-06-24

Believe it or not the unit was still buoyant, and gave us reasonable data.

After nearly a year we returned to discover that the stream-bed unit pictured above had gone AWOL, and the remaining two flow sensors were heavily encrusted with criters of all kinds. We’d seen bio-growth before on reef deployments, but never to this extent. To avoid further losses, the replacement sensors have been painted black and deployed in “stealth mode” locations.


Addendum: 

During these deployments we stayed in the fishing village of Chiquila.  I spotted this lovely graffiti during a morning run:

JellyFish

<— Click here to continue reading the story—>

Field Report 2016-03-17: MCP9808 Temperature Sensor Fails Under Pressure

Cave Pearl data loggers

In this shot you can really see how the addition of the drag flag amplifies the tilt signal.

Then next day saw some routine logger replacements at our favorite coastal cave. It’s relatively shallow, making it a good place for a shakedown dive, and we have plenty of air time to develop funky new underwater deployment procedures for our little bots.  The fact that it’s also an un-decorated mud pit is just gravy, as it means that no one bothers our instruments like they would in the prettier high-traffic caves.  Strong tidal influence also provides a good range in the data and this cave has been continuously instrumented since our alpha trials back in 2013.

Of course that also means this location has seen more instrument failures than anywhere else, and again it delivered some bad news with the good: showing that even a great sensor can eventually crack under pressure:

MCP9808 pressure failure brings down the logger

This logger had been performing well since mid 2015, and initial consumption curves indicated it should go a year or more on 3AA’s. But we had some hints in the last dataset that the temp sensor was struggling, and this time it burned through a set of batteries in less than six weeks, with the 9808 reporting imaginary temperature excursions very similar to those we saw from the TMP102 failures last year. Each was accompanied by a significant hit to the power supply, which would imply that we probably had some kind of pressure induced self heating going on inside the IC. (perhaps because of a short?)

The suspect MCP9808 (upper left). I have moved away from these large surface area sensor wells as I think they might be subjecting the sensors to larger bowing forces at depth.

The wonky MCP9808 after 9 months. On newer builds I have moved away from high surface area sensor wells as I think they might subject the sensors to larger bowing forces at depth. The LED also became flaky, with only the blue channel still operating.

That’s a bit of a bummer, because the MCP’s offer better off the shelf accuracy than most of the other temperature sensors in that price range.  So unless I want to put the breakout inside the housing, I’m forced back to the humble DS18B20’s that I used at the beginning of the project. I had a feeling this might happen, so on this trip we deployed a special 3-sensor cap on one of the loggers, with sensors inside the body, embedded in epoxy, and one projecting directly into the water. Hopefully that will let me determine how much lag we get from moving the temp sensors inside the pvc shell.  Since we typically don’t take readings more than once every 15 minutes, I’m hoping we don’t see much effect from the different arrangements.  During basement testing, thermal inertia rounded off short temperature peaks significantly, but that was at a five minute sampling interval, in air rather than water. 

Even with calibration you need some way to determine your mounting offset...

Even with calibration, you still need some way to determine the mounting offsets.

All three flow sensors delivered beautiful records, and the worst build actually  provided the best insight into the need for sensor calibration. Logger #69 had a 5° tilt error due to an adhesive failure during the build.  At that time I was still learning how to calibrate the sensors, so I was doing estimates of sensor mounting  offsets by simply averaging the readings from an overnight test where I hung the logger on a pivot joint.  The relatively large error on #69 meant that I almost rejected that sensor cap outright, but I figured we should put the unit in a high velocity site to test if it was still usable.   I later did a full calibration on that unit (with Magneto 1.2 software) to generate a more complete set of axes bias & scaling factors.

With the latest flow data in hand, I could now see how much difference the extra effort of full calibration makes:

TiltAngleCorrections

Those two corrected sets differ by a maximum of 0.5 degrees, implying that I can generate pretty good correction factors for older gen units in the field by simply hanging them in a closet over night. This also gives me a way to keep tabs on sensor drift without completely reprogramming the loggers, which I usually don’t have time for during fieldwork.

This is probably ‘good enough’ for our high flow sites, but for the deeper saline deployments (where the flows creep along in the sub-cm/second range) I’ll probably have to go full Monty since half a degree might be a significant portion of the total signal. And I have accumulated enough compass calibrations by now to show that in comparison to the  well behaved acclerometers,  magnetometer correction factors are all over the map with bias & offsets sometimes approaching 20%.


Spotted in Tulum:
TiltAngle

Working with a five degree mounting offset…


Addendum 2016-04-10:

Still processing the data from this last trip, and I found a good example from of one of those low flow systems, where the full calibration was needed to correct the axes bias errors:
Cave Pearl data loggers

Once you get down into the weeds, the factory offsets are larger than your signal, potentially hiding the phenomenon you are looking for. And you still have the challenge of filtering out the relatively high acclerometer noise, without destroying the more subtle tidal signals…

Addendum 2016-04-30:

I can only imagine what kind of incredible calibration challenges faced the people who made first direct observations of a gravitational wave, but I think I’m beginning to understand the sentiment behind this awesome tattoo…

Addendum 2016-05-06:

Hackaday just posted about an elegant new tilt sensor idea, using a variable differential transformer filled with ferrofluid. This principle of variable inductive cores has been used for years by YSI to detect salinity, but seeing this fellows approach makes me want the look at the technique again, if I can figure out a way to reduce the power consumption…

Addendum 2016-07-30:

We had another MCP9808 from that gen.  go down, but this time the power curve was the exact opposite of what I am used to seeing for IC sensor failures:

interesting power curve with temp sensor failWhile the sensor was throwing out a string of ‘Maximum Reading’ errors, the power consumption for the logger was normal. Then the sensor started delivering normal data again, but was obviously drawing enough juice to take the rest of the logger down quickly. Weird…

<— Click here to continue reading the story—>

Field Report 2016-03-16: Rain Gauges Over Reporting

Fer_RioExchange

As this was a dry part of the cave, I even risked bringing in the laptop…

One of the first priorities was a trip out to Rio Secreto to service drip loggers. Data from the last season confirmed that all of the loggers are good for at least 6-8 months, so we now have the option of servicing some units, while leaving others for a later trip. As the install base continues to grow, that’s becoming an important consideration for the trip logistics. Even so, our schedule was pretty tight so we decided to try servicing the units ‘in-situ’, so we only had to make one trip.

The forest floor gauge was knocked over by critters, despite a fairly hefty anchor.

Mapaches?

After that I tackled the climate stations we had on the surface. I was keen to see data from the logging rain gauges as this was only their second real-world deployment.  Back in Dec. we deployed two units, with one on the roof of a building, above the tree canopy, and one on the forest floor. My heart sank when I found that something had knocked the forest unit over, despite a fairly hefty cement anchor. That happened only a couple of weeks before our retrieval, so we still had a fairly complete data set.

Our original thought was to use the comparison data to see how much rainfall was being intercepted by the canopy, but the sheltered forest floor record also ended up providing me with some vital information about how wind was affecting the rooftop unit:

F

TypicalDailyWindNoise

The ground unit had none of these 0-15 count spikes which peaked at mid-day (local time).

The drip counter inside the rain gauge is essentially using it’s accelerometer as a vibration sensor, which gave us in-cave sensitivity down 12cm drip-fall distances. So it probably should have occurred to me that we needed to reduce the sensitivity for surface applications.  The daily noise is pretty easy to threshold away in Excel with an if statement [ =IF(DataCell-threshold<0,0,DataCell-threshold) ] and different settings showed that the typical daily ‘background noise’ was adding about 10%.  I’ve even heard that funnel wetting & other losses cause cheap rain gauges to under-report by that much, so this daily bump might come out in the wash.  A thornier problem lies with the ‘windy day’ events, which produce the larger spikes. And that effect is probably embedded in the rain storm data as well.  Though with ~10 drops counted per mL of water through our funnel,  actual rain events usually count up into the thousands.  So I can apply pretty aggressive filtering (with thresholds around 200) and doing so hints that the stronger wind events are probably adding another 20% to the overall totals. I know that’s sounds pretty bad, but hey – it’s a prototype right?

So there are a batch of sensitivity trials ahead, and once again I need some external data to calibrate against.   Of course anything that can count accelerometer alarms can just as easily be counting reed switch closures, so it’s back to the bench I go… 🙂


Spotted in Tulum:

Signal2Noise

Signal-to-noise ratios…

<— Click here to continue reading the story—>

Field Report 2015-12-20: Winding Down…

Whew...home stretch!

On the home stretch…

I know we are nearing the end of a fieldwork trip when we start to see the floor in our room again. By that point we are usually dog tired after several days of a routine that could be summarized as: If the sun is up: dive/install loggers, if the sun is down: prep data loggers.  We try to make sure there are a couple of dry days before the flight home, but if anything those are even more busy as we run around returning  borrowed equipment, and talking about interesting new sites with our cave diving friends.

Trish & Natalie planing future deployments

Trish & Natalie planning new deployments

This is where I just stand back and watch in quiet amazement as Trish weaves all those loose ends together in the flurry of last minute activity. Of course some times we have a quiet conversation afterward, that starts with me asking “Uhhh, so exactly how many loggers did you just promise to deliver, that I have to build?”  Still, when you have so many amazing people offering to help with the project, it’s really darned hard to say no.

Aubri shows off her new loggers

Aubri shows off her new loggers, painted black because it just looks cooler  🙂

As ever, there are always plenty of cool things on a fieldwork trip that don’t make it onto the blog, like that moment when you realize the graph in front of your eyes is probably going to lead to a publication all on its own, or that point when you realize that you can’t close the windows to use the car’s air conditioning any more because collective foot rot has set in, and is approaching biblical levels. But even glossing over all that, I couldn’t sign off on this trip without mentioning one notable highlight: Aubri Jenson is a caver, and cave diver, who has joined us on past field trips deploying Cave Pearls. However this time she arrived with her own set of loggers, which she built for her own research.  Watching her describe them to the other cavers in at the restaurant, was a milestone for the project that filled my nerdy heart with the kind of joyful songs and laughter that I haven’t heard since… May 25, 1977.  Wooot!

<— Click here to continue reading the story—>

Field Report 2015-12-15: New DS18B20 1-Wire Sensor Chains Installed

A typical DS18b20 temperature string deployment

A typical deployment

The August deployment produced both success and failure from our 1st-generation temperature strings. We still managed to get both of those older units back on their feet with fresh batteries, and we add two beta units to the set.  I really had to scramble to get the new chains ready in time because we are spending more time on testing and calibration as I try to squeeze the best possible performance out of these humble DS18b20’s. It takes me about a day to solder and epoxy a  section with 8-12 sensors, so these instruments also represent a significant amount of build time. (note: the length of the wires in between nodes does not affect that time very much)

Although both of the alpha loggers passed the overnight tests following their first run, the shorter (25cm) chain developed a reading problem as soon as it was powered up. The fact that this error occurred before the unit went near the water tells me that it was either a sensor failure, or a problem with the connectors. I have been using Deans 1241 micro connectors between the segments because they seem really robust, but my gut tells me those break points could also add some signal reflection problems.

Here I am 'prospecting' for thermals by dangling a 24m chain from a life jacket and moving it around the cenote. I thik I will put a display screen on one of the next units to make this task easier.

We went hunting for potential deployment locations by dangling a 24m chain from a life jacket and moving it around the cenotes to generate profiles. I think I will put a display screen on one of the next units to make these ‘prospecting’ trips easier in the future.

The logger itself ran for the duration, but the log data was a string of the dreaded 85C (ie: 1360)  and ‘-1’ read errors.  Since these numbers are fairly distinctive, I will put an error check in code on startup to see if I can intercept this kind of problem in the future.  At least the pressure record from the MS5803 on the housing survived intact, and that sensor seems to be working again now that I have removed the Qsil silicone coating that I had over top of the sensor on the previous deployments.

I isolated the read fault to the first segment of the temperature sensor chain, and when that section was removed the rest of the sensors ran well enough. We decided to re-deploy the parts that were still running  (although the chain is now less than four meters long) and I brought the dodgy section home for some forensic testing. I am suspicious of the U-09LV urethane that I used on a few of the nodes, thinking that it’s higher moisture resistance might not compensate for the stiffness and overall durability of E-30CL.

Fortunately, the longer chain that we deployed in the deeper inland site performed well, giving us another record with sensors spanning the halocline:

raw data

Two months of raw DS18b20 output, Logger 46  (10m cable with 20 sensors). Note: the warmer temps shown at the top of this graph are from sensors deeper in the water column, while the cooler temperatures are from shallow sensors in fresh water

Even with relatively long 50 cm spacing, the large rain events of the season pushed the fresh/salt boundary around so much that several sensors (indicated here with 48pt moving averages) switched from the saline, to the fresh water, and then back again. It will be interesting to see if those bands tighten up, or spread out, after we apply our normalization factors.

New DS18b20 Temp strings ready to deploy.

This 6m x 24node chain has a 10m extension, allowing us to change sensor positions in the water column by simply tying off the excess.

After several meetings to obtain permission from the landowners, we managed to install our new set of DS18b20 temperature strings.  We decided to co-deploy a combination of high and low spatial resolution chains, so that we still have a good chance to get data, if one loggers dies.  Due to memory limitations, etc. I built them with twenty four sensor nodes per logger, and even with those spread out over 24m of cable, 3k3 pullup resistors are enough for the one wire communications. That’s aggressive enough to give me some concern about self-heating if I was doing multiple readings, but I figure that with the bus at 3.3v it probably just comes out in the wash.

This deployment site had significant amounts of hydrogen sulfide at depth which forms a visible layer that is shown well by these photos from Angelita.  It will be interesting to see how the chemistry affects our sensors. It certainly had an effect on me, as I was a little worse for wear after that dive.

<— Click here to continue reading the story—>

Field Report 2015-12-14: Re-install the Drip Monitoring Network

New tufa based installation.

These large soft formations often form around the tree roots that drill down into the caves from the surface.

I brought six new units to cover attrition of the older drip sensors, but with only one failure in the last round, the scheduled replacements left us with several ‘old but still working’ loggers in hand.  With so many good stalagmite-forming records in the bag, we decided to look at some of the amorphous flow-stone draperies on the periphery of the cave. It will be interesting to see if we can develop a sense of how much these sources contribute to the water draining into the cave.

Although I had not yet determined if the Masons RH experiment was working, we decided to re-installed those multi-probe logger since they capture both temperature and barometric data, which is still very useful information for the project.

A roof-top deployment is nearby, for comparison.

With a roof-top deployment nearby, we hope that comparisons with ground level units might provide some idea how much rain is evaporating before it even hits the ground…

With the success of the rain gauges, we decided to disperse those loggers to topside locations ranging as far as Tulum. I will build more for the next deployment, as we would eventually like to have surface rain gauges at all of our cave monitoring sites (precipitation is as relevant to the flow loggers as it is to the drip sensors!).  That’s a tall order, so I am happy that nearly all the units are delivering one-year or more operation on a set of batteries, so we no longer have to change them on every trip. As readers of this blog know, it’s been a long road bringing the project to the point where we can just leave the loggers in place if we run out of time, without loosing any data.


In all, there are now more than twenty five loggers in operation at Rio Secreto, which is the largest concentration of instruments we’ve ever had at one location. My hope is that the information we are gathering today helps to preserve their cave when the growing metropolis of Playa del Carmen reaches their doorstep.

The road out to Rio Secreto skirts the boarder of the largest limestone quarry in the area. A dramatic example of the different perspectives you encounter about how the natural resources of Mexico should be utilized. Of course, as a Canadian, I see exactly the same issues playing out back home...

The road out to Rio Secreto skirts the boarder of the largest limestone quarry in the area. A dramatic example of the different perspectives you encounter about how the natural resources of Mexico should be utilized. Of course, as a Canadian, I see exactly the same issues playing out back home…

<— Click here to continue reading the story—>

Field Report 2015-12-11: Flow sensors go Farther & Deeper

Baruch Figueroa-Zavala (from CEA) recently installed a new Cave Pearl flow sensor just down the coast from Akumal bay:

The latest reef deployment of the flow loggers

The latest reef deployment, 14m depth. (photo courtesy Baruch)

This marks our deepest ocean sensor deployment to date, and two backup bungees were added to ensure this unit does not get torn from it’s anchor like the last one we put outside the sheltered environment of the bay. The turbulence shadow from the reef will likely have some effect on the flow, and it will be interesting to see if this logger accumulates the same amount of bio-growth as the shallow water units…

Marco and I snorkeled out to retrieve both of the B-generation units in Akumal Bay, which were still running well. Both were heavily encrusted despite the thorough cleaning they had in August, and to my eye it looks like there might be even more gowning on them now than they had last time. I am wondering if the acid bath somehow roughens the surface, allowing more critters to get a foothold (?)  Of course it could just as easily be a result of some seasonal nutrient flux, so I leave it up to the biologists to comment. One thing that surprises me is that we are only now seeing the first evidence of a marine animal burrowing into the instruments, and they chose to attack the epoxy rather than the PVC. A subtle reminder that poly vinyl chloride is not the most benign substance in the world.

These units have been under water since the second flow meter deployment.  With twenty months of continuous operation under their belt, they are still producing solid results despite some fairly dodgy Dupont jumper cables that I would never use in my current builds. This makes me feel pretty good about all the laborious hand-sanding I did on those early housings:

B4_FlowRecord

Akumal Bay (North) Tilt angle (°) (from raw accelerometer readings)

It looks like a nice two-week tidal signal was coming through until the big rains took over the flow pattern. The temp sensor on-board shows how all that precipitation lowered the mid column water temperature in a pattern that is now beginning to look very familiar:

NorthBayTemperatureRecord

Unit B4: Akumal Bay (North) DS18b20 Temp (°C)

I really have to build myself a CTD to find out if the water temperature also tracks salinity, and if so, I wonder how that affects all the critters out there on the reef?

A few days later, after a good cleaning and a fresh set of batteries, we tried go back and  reinstall the flow sensors, only to find police waving everyone away from Akumal at the highway. For several days a group of protesters from the pueblo blocked roadway access in a vigorous dispute over access to the beach, so we had to leave the loggers with CEA staff for later deployment. Yet another reminder of  how the combined pressures of tourism and development completely dominate the regional dynamics, and I hope that the situation can be resolved in a way that preserves the bay for future generations.

<— Click here to continue reading the story—>