328p processor System Clocks & their Distribution pg26
Most micro-controllers use a quartz crystal oscillator to drive the system clock, and their resonant frequency is reasonably stable with temperature variations. In high accuracy applications like real time clocks even that temperature variation can be compensated, and last year I devised a way to measure temperature by comparing a 1-second pulse from a DS3231 to the uncompensated 8Mhz oscillator on a Pro Mini. This good clock / bad clock method worked to about 0.01°C, but the coding was complicated, and it relied on the ‘quality’ of the cheap RTC modules I was getting from fleaBay – which is never a good idea.
But what if you could read temperature better than 0.01°C using the Pro Mini by itself?
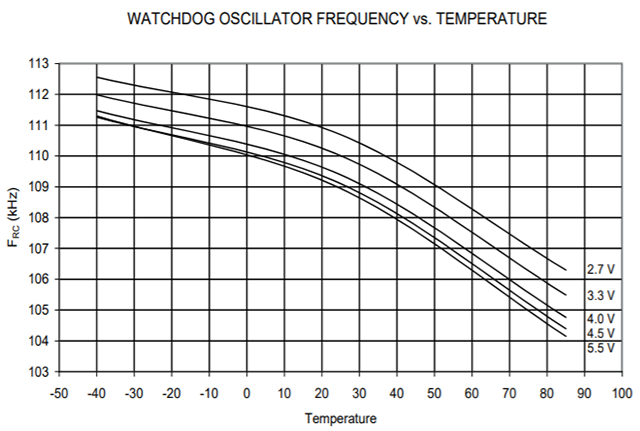
Figure 27-34: Watchdog Oscillator Frequency vs. Temperature. Pg 346 (Odd that the frequency is listed as 128kHz on pg55?) Variation is ~100 Hz/°C
The 328P watchdog timer is driven by a separate internal oscillator circuit running at about 110 kHz. This RC oscillator is notoriously bad at keeping time, because that on-chip circuit is affected by external factors like temperature. But in this particular case, that’s exactly what I’m looking for. The temperature coefficient of crystal resonators is usually quoted at 10–6/°C and for RC oscillation circuits the coefficient is usually somewhere between 10–3/°C to 10–4/°C. There’s plenty of standard sensors don’t give you a delta that large to play with!
To compare the crystal-driven system clock to the Watchdogs unstable RC oscillator I needed a way to prevent the WDT from re-starting the system. Fortunately you can pat the dog and/or disable it completely inside its interrupt vector:
volatile boolean WDTalarm=false;
ISR(WDT_vect)
{
wdt_disable(); // disable watchdog so the system does not restart
WDTalarm=true; // flag the event
}
SLEEP_MODE_IDLE leaves the timers running, and they link back to the system clock. So you can use micros() to track how long the WDT actually takes for a given interval. Arduinos Micros() resolution cannot be better than 4 microseconds (not 1 µs as you’d expect) because of the way the timer is configured, but that boosts our detectable delta/° by a factor of four, and the crystal is far more thermally stable than the watch-dog. It’s worth noting that timer0 (upon which micros() depends) generates interrupts all the time during the WDT interval, in fact at the playground they suggest that you have to disable timer0 during IDLE mode sleeps. But for each time interval, the extra loops caused by those non-WDT interrupts create a consistant positive offset, and this does not affect the temperature related delta.
WDTalarm=false;
// Set the Watchdog timer from: https://www.gammon.com.au/power
byte interval =0b000110;
// 1s=0b000110, 2s=0b000111, 4s=0b100000, 8s=0b10000
//64ms= 0b000010, 128ms = 0b000011, 256ms= 0b000100, 512ms= 0b000101
noInterrupts ();
MCUSR = 0;
WDTCSR |= 0b00011000;
// set WDCE, WDE
WDTCSR = 0b01000000 | interval;
// set WDIE & delay interval
wdt_reset();
// pat the dog
interrupts ();
unsigned long startTime = micros();
while (!WDTalarm) { //sleep while waiting for the WDT
set_sleep_mode (SLEEP_MODE_IDLE);
noInterrupts (); sleep_enable(); interrupts (); sleep_cpu ();
sleep_disable(); //processor starts here when any interrupt occurs
}
unsigned long WDTmicrosTime = micros()-startTime; // this is your measurement!
The while-loop check is required to deal with the system interrupts that result from leaving the micros timer running, otherwise you never make it all the way through the WDT interval. I haven’t yet figured out how many interrupts you’d have to disable to get the method working without that loop.
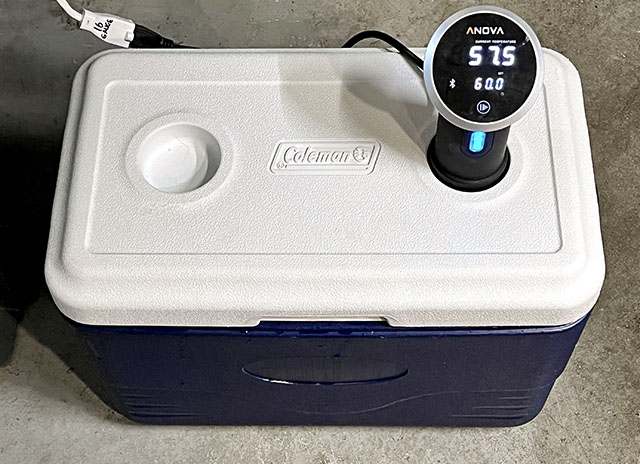
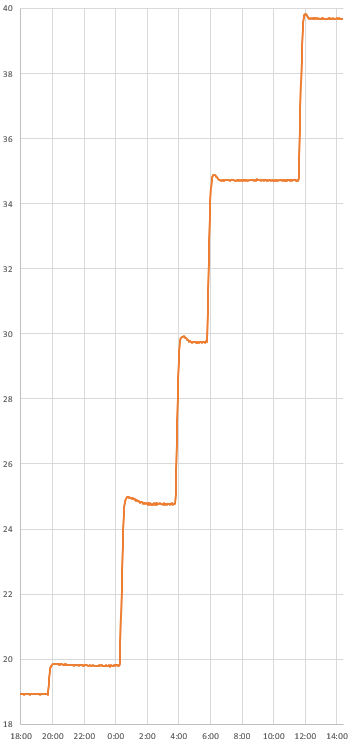
To calibrate, I use my standard refrigerator->freezer->room sequence for a repeatable range >30°. Since the mcu has some serious thermal lag, the key is doing everything VERY SLOWLY with the logger inside a home made “calibration box” made from two heavy ceramic pots, with a bag of rice between them to add thermal mass:
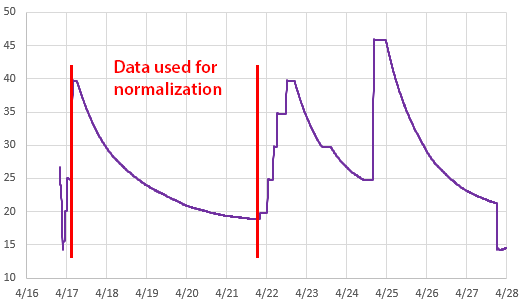
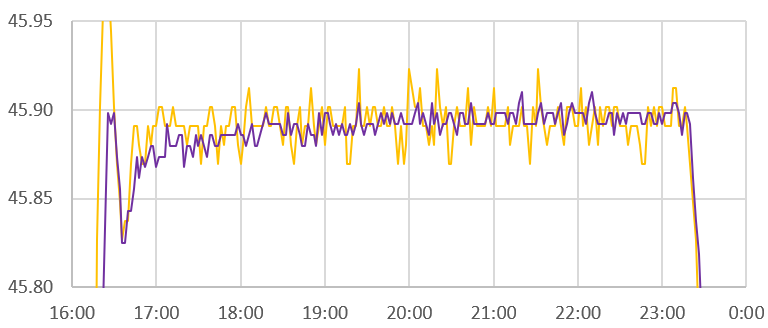
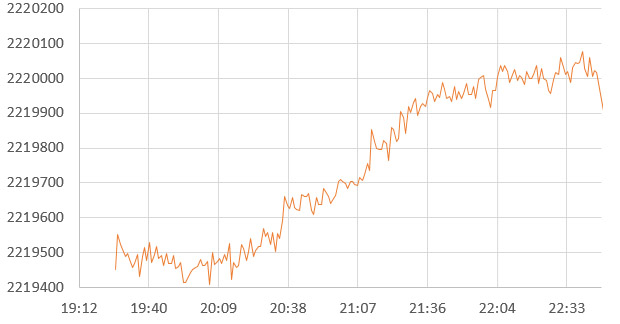
1sec WDT micros() (left axis) vs si7051 °C Temp (right axis) : Calibration data selected from areas with the smallest change/time so that the reference and the 328p have equilibrated.
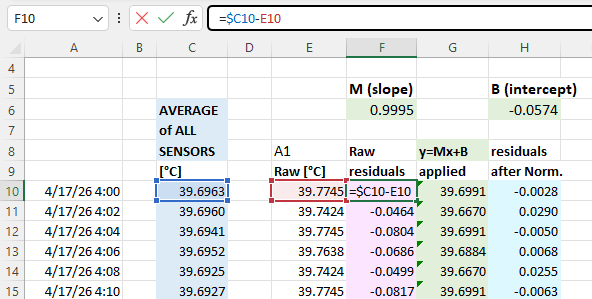
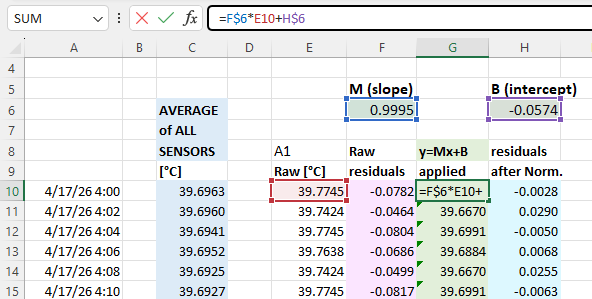
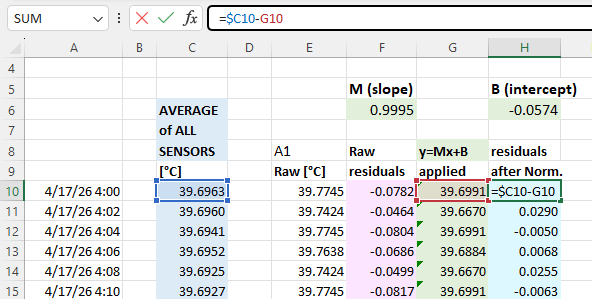
If you use reference data from those quiescent periods, the fit is remarkably good:
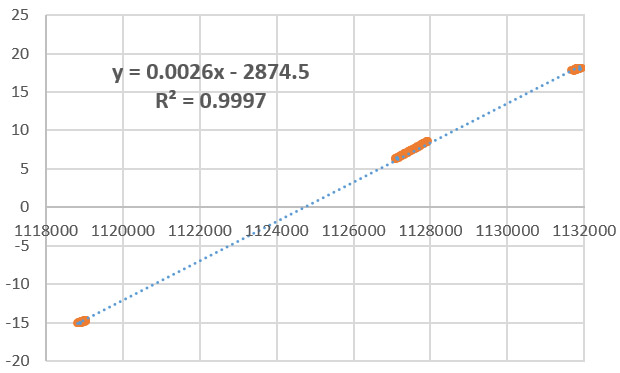
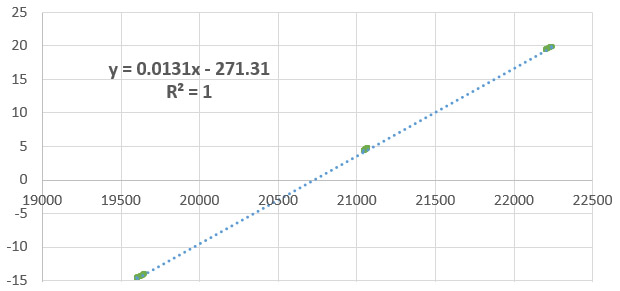
si7051 reference temperature vs 1 sec WDT micros() : A fit this good makes me wonder if the capacitor on the xtal oscillator is affected the same way as the capacitor in the watchdogs RC oscillator, with the net result being improved linearity. In this example, there was a constant over-count of 100,000 microseconds / 1-second WDT interval.
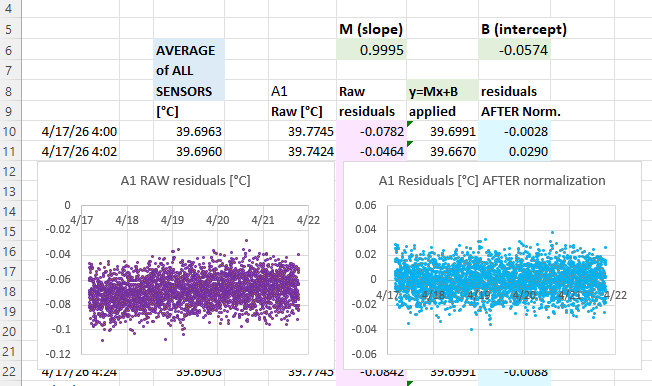
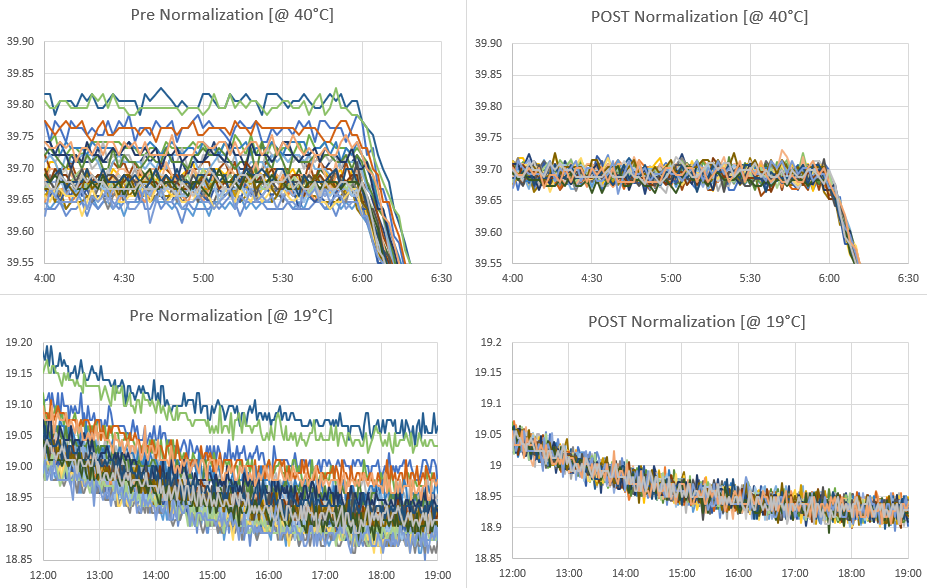
I’m still experimenting with this method, but my cheap clone boards are delivering a micros() delta > 400 counts /°C with a one second interval – for a nominal resolution of ~0.0025°C. Of course that’s just the raw delta. When you take that beautiful calibration equation and apply it to the raw readings you discover an inter-reading jitter of about 0.1°C – and that lack of precision becomes the ‘effective’ limit of the resolution. It’s going to take some serious smoothing to get that under control, and I’ll be attacking the problem with my favorite median filters over the next few days. I will also see if I can reduce it at the source by shutting down more peripherals and keeping an eye on stray pin currents.
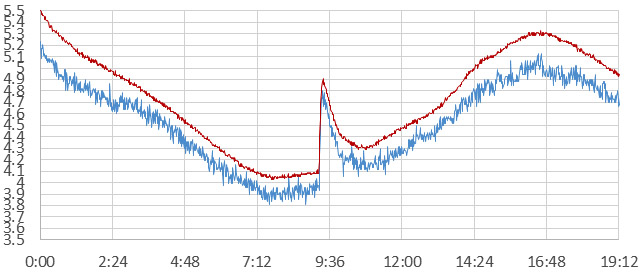
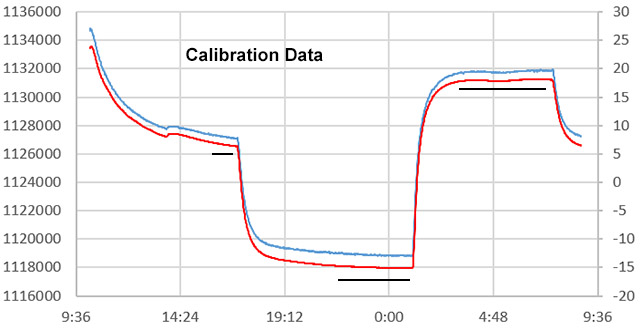
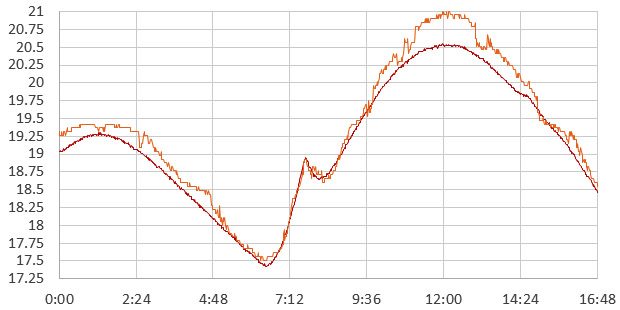
Noise from si7051 reference (red) vs Cal. equation applied to raw WDT micros readings (blue).
Doubling the interval cuts the the noise and the apparent resolution in half, and if you are willing to wait around for the watchdogs 8-second maximum you can add an order of magnitude. Of course you could also go in the other direction: a quarter second WDT interval would deliver ~100 counts/°C, which still gets you a nominal 0.01°C though the jitter gets worse. Note that you can’t use the ‘b’ coefficients from one interval to the next, because of the overhead caused by the non-WDT interrupts. That “awake time” must also be contributing some internal chip heating.
The si7051 reference sensor needs to be held in direct physical contact with the surface of the mcu during the room->fridge->freezer calibration; which takes 24 hours. Since my ref is only ± 0.1ºC accuracy, calibrations based on it are probably only good to about ± 0.2ºC.
There are a few limitations to keep in mind, the biggest being that messing with WDT_vect means that you can’t use the watchdog timer for it’s intended purpose any more. (interferes with RocketScream’s lowpower library) The other big limitation is that you can only do this trick on a voltage regulated system, because RC oscillators are affected by the applied voltage, though in this case both oscillators are exposed to whatever is on the rail, so a bit more calibration effort might let you get away with a battery driven system. (and now that I think about that… if you did the temp calibration while the system was regulated, you might then also be able to derive the system voltage from the two oscillators while running unregulated.)
Self-heating during normal operation means that this method will not be accurate unless you take your temperature readings after waking the processor from about 5-10 minutes of power-down sleep. The mass of the circuit board means that the mcu will always have significant thermal lag. So there is no way to make this method work quickly and any non-periodic system interrupts will throw off your micros() reading.
Every board has a different crystal/capacitor/oscillator combination, so you have to re-calibrate for each one. Although the slopes are similar, I’ve also found that the raw readings vary by more than ±10k between different Pro Minis for the same 1sec WDT interval, at the same temperature. The silver lining there is that the boards I’m using probably have the cheapest parts available, so better quality components could boost the accuracy , though I should insert the usual blurb here that resolution and accuracy are not the same thing at all. I haven’t had enough time yet to assess things like drift, or hysteresis beyond the thermal lag issue, but those are usually less of a problem with quality kit. If your board is using Y5V caps it probably won’t go much below -15°C before capacitor failure disrupts the method.
It’s also worth noting that many sleep libraries, like Rocketscreem’s Lowpower lib, do their own modifications to the watchdog timer, so this method won’t work with them unless you add the flag variable to their modified version of the WDT_vect. To add this technique to the base code for our 1-hour classroom logger, I’ll will have to get rid of that library dependency.
Where to go from here:
- Turning off peripherals with PRR can save power and reduce heating during the interval.
- Switching from micros(), to timer based overflows could increase the time resolution to less than 100 ns; raising nominal thermal resolution.
- Clocking the system from the DS3231’s temperature compensated 32khz output could give another 100 counts/°C and improve the thermal accuracy. My gut feeling is the noise would also be reduced, but that depends on where it’s originating.
Despite the limitations, this might be the best “no-extra-parts” method for measuring temperature that’s possible with a Pro Mini, and the method generalizes to every other micro-controller board on the market provided they have an independent internal oscillator for the watchdog timer.
Addendum:
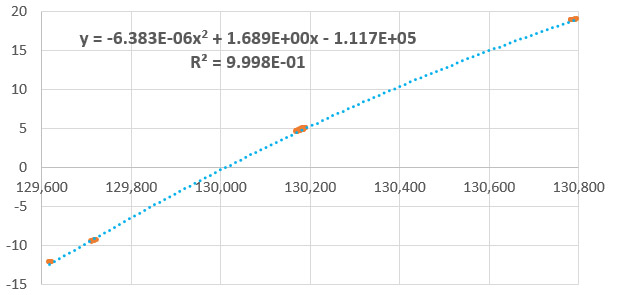
As I run more units through the full calibration, I’m seeing about 1 in 3 where a polynomial fits the data better for the -15 to +25°C range:
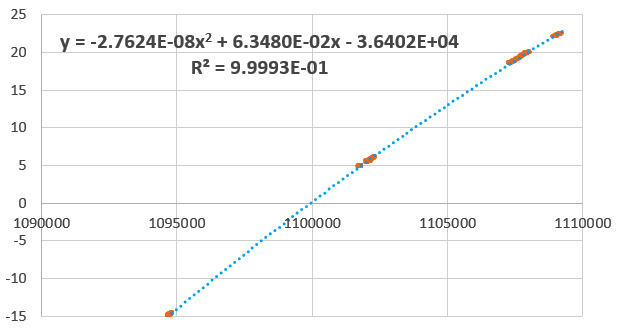
si7051 reference temperature vs 1 sec WDT micros() : a different unit, but both clone boards from the same supplier
This is actually what I was expecting in the first place and I suspect all the fits would be 2nd order with a wider range of calibration temperatures. Also, this is the raw micros output – so you could make those coefficients more manageable by subtracting the lowest temperature reading from all those above. This would leave you with a numerical range of about 16000 ticks over 40°C, which takes less memory and is easier for calculations.
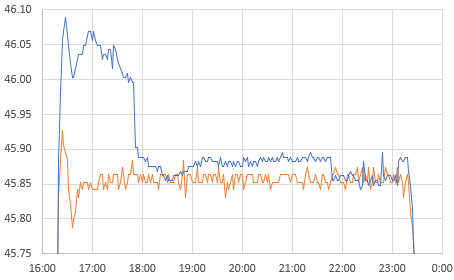
And just for fun I ran a trial on an unregulated system powered by 2xAA lithium batteries. Two things happened: 1) the jitter/noise in the final Temperature readings more than doubled – to about 0.25°C and 2) calibration was lost whenever the thermal mass of the batteries meant that the supply was actively changing – regardless of whether the mcu & reference had settled or not:
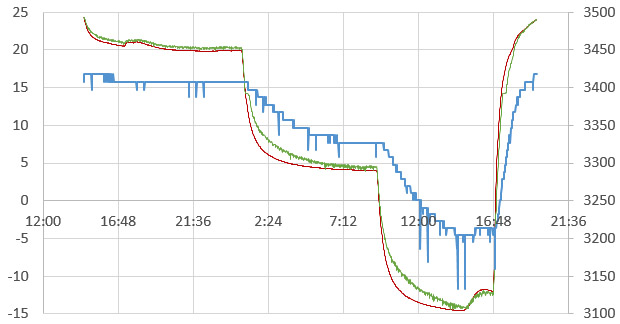
Red is the Si reference [left axis], Green is the calibration fit equation applied to the WDT micros() [left], and blue is the rail voltage supplied by 2xAA lithium batteries [right axis] (Note: low voltage spikes are caused by internal housekeeping events in the Nokia 256mb SD cards)
This morning I did a trial run which switched from micros() to timer1 overflows, using code from Nick Gammon’s Improved sketch using Timer 1. This increased the raw delta to almost 5000/°C, but unfortunately the width of the jitter also increased to about 500 counts. So I’m seeing somewhere near ±0.05°C equivalent of precision error – although my impression is that it’s been reduced somewhat because Timer1 only overflows 122 times per second, while the Timer0/micros had to overflow 100k times. So changing timers means less variability from the while-loop code execution. Next step will be to try driving the timer with the 32khz from the RTC…
Addendum 2019-02-27
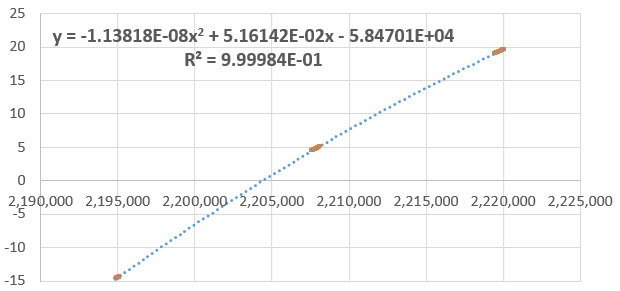
So I re-jigged another one of Nicks counting routines which increments timer1 based on input from pin D5, using the WDT interrupt to set the interval. Then I enabled the 32.768 kHz output from a DS3231N and connected it to that pin. This pulse is dead-dog slow compared to the WDT oscillator, so I extended the interval out to 4 seconds. This long-ish sample time only produced a delta of about 40 counts/°C.
Si7051 reference temp vs Timer1 counts of 32kHz output from DS3231N (based on data selected from quiescent periods)
There wasn’t enough data to produce high resolution, but my thought was that since the DS3231N has temperature compensated frequency output, it eliminates the xtal as a variable in the question of where the jitter was coming from. This approach also causes only 2-3 overflows on timer1, so the impact of code execution is further reduced. Unfortunately, this experiment did not improve the noise situation:
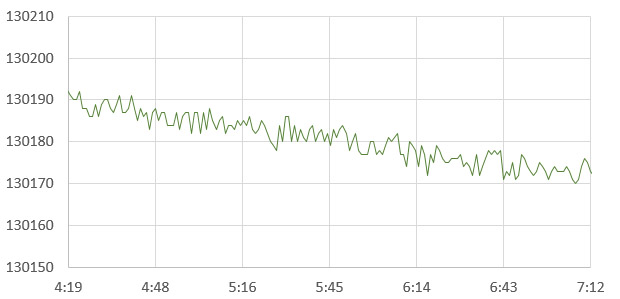
DS3231 32khz clock tics vs 4sec WDT interval Raw reading jitter during a relatively quiescent period.
That’s about 8 counts of jitter in the raw, which produces readings about ±0.1C away from the central line. That’s actually worse than what I saw with the Xtal vs WDT trials, but the increase might be an artifact of the pokey time-base. The smoking gun now points squarely at variations in the WDT oscilator output as the source of the noise.
That’s kind of annoying, suggesting it will take filtering/overhead to deliver better than about 0.1°C from this technique, even though higher resolution is obviously there in the deltas. The real trick will matching the right filter with all the other time lag / constraints in this system. Still, extra data that you can get from a code trick is handy, even if it sometimes it only serves to verify that one of your other sensors hasn’t gone squirrely.
—> just had a thought: oversampling & decimation eats noise like that for breakfast!
Just fired up a run taking 256 x 16ms samples (the shortest WDT interval allowed) with Timer1 back on the xtal clock. Now I just have to wait another 24 hours to see if it works…
Addendum 2019-02-28
OK: Data’s in from oversampling the WDT vs timer1 method. I sum the the timer1 counts from 256 readings (on a 16msec WDT interval) and then >>4 to decimate. These repeated intervals took about 4 seconds of sampling time.
si7051 reference temperature vs 256x Oversampled Timer 1 reading on 16 msec WDT interval: Fit Equation
This produced 750 counts/°C for a potential resolution of 0.0013°, but as with the previous trials, the method falls down because the jitter is so much larger:
Variability on 256 Timer1 readings of 16msec WDT interval : During quiescent period
100 points of raw precision error brings the method back down to a modest ‘real’ resolution of only ±0.066°C at best. The fact that this variability is so similar to the previous trials, and that oversampling did not improve it, tells me that the the problem is not noise – but rather the WDT oscillator is wandering around like a drunken sailor because of factors other than just temperature. If that’s the case, there’s probably nothing I can throw at the problem to make it go away.
Several people pointed out that there is another way to measure temperature with some of the Atmel chips, so I decided to fire that up for a head-to-head trial against the WDT method. Most people never use it because the default spec is ±10°C and it only generates 1 LSB/°C correlation to temperature for a default resolution of only 1°C. Some previous efforts with this internal sensor produced output so bad it was used as a random seed generator.
But heck, if I’m going through the effort of calibration anyway, I might be able to level the playing field somewhat by oversampling those readings too:
si7051 reference temperature °C vs 4096 reading oversample of the internal diode: Fit equation
Even with 4096 samples from the ADC, this method only delivered ~75 counts /°C. But the internal diode is super linear, and the data is less variable than the WDT:

Variability from 4096 ADC readings of the internal reference diode : During quiescent period
Five counts of raw variability means the precision error is only ±0.033°C (again, this becomes our real resolution, regardless of the raw count delta) . So even after bringing out the big guns to prop up the WDT, the internal reference diode blew the two-oscillator method out of the water on the very first try.
volatile uint16_t adc_irq_count;
ISR (ADC_vect)
{
adc_irq_count++; //flag to track how many samples have been taken
}
internalDiodeReading=0;
adc_irq_count = 0;
unsigned long sum = 0;
unsigned int wADC;
ADMUX = (_BV(REFS1) | _BV(REFS0) | _BV(MUX3)); // Set the 1.1v aref and mux for diode
ADCSRA |= _BV(ADSC); // 1st conversion to engage settings
delay(10); // wait for ADC reference cap. to stabilize
do {
noInterrupts ();
set_sleep_mode( SLEEP_MODE_ADC ); // Sleep Mode just to save power here
sleep_enable();
ADCSRA |= _BV(ADSC); // Start the ADC
do{
interrupts();
sleep_cpu(); // Sleep (MUST be called immediately after interrupts()
noInterrupts(); // Disable interrupts so while(bit_is_set) check isn’t interrupted
} while (bit_is_set(ADCSRA,ADSC)); // back to sleep if conversion not done
sleep_disable(); interrupts(); // Enable interrupts again
wADC = ADCW; // Reading “ADCW” combines both ADCL & ADCH
sum += wADC; // Add new reading to the total
} while (adc_irq_count<4096); //sets how many times the ADC is read
ADCSRA &= ~ _BV( ADIE ); // No more ADC interrupts after this
internalDiodeReading=(sum >> 6); //decimation turns sum into an over-sampled reading
For now, I think I’ve kind of run out of ideas on how to make the WDT method more precise..? Oh well – It’s not the first time I’ve tried to re-invent the wheel and failed (and it probably won’t be my last….) At least it was a fun experiment, and who knows, perhaps I will find a better use for the technique in some other context.
I’ll spend some more time noodling around with the internal diode sensor and see if I can wrestle better performance out of it since it’s probably less vulnerable to aging drift than the WDT oscillator. I’m still a bit cautious about oversampling the internal diode readings because the math depends on there being at least 1-2LSB’s of noise to work, and I already know the internal 1.1v ref is quite stable..? I threw the sleep mode in there just to save power & reduce internal heating, but now that I think about it the oversampling might work better I let the chip heat a little over the sampling interval – substituting that as synthetic replacement for noise if there is not enough. The other benefit of the diode is that it will be resilient to a varying supply voltage, and we are currently experimenting with more loggers running directly from batteries to see if it’s a viable way to extend the operating lifespan.
Addendum 2019-04-05
So I’ve kept a few units perking along with experiments oversampling the internal diode. And on most of those runs I’ve seen an error that’s quite different from the smoothly wandering WDT method. The internal diode readings have random & temporary jump-offsets of about 0.25°C:
si7051 (red) reference vs internal Diode (orange) over sampled 16384 reads then >>10 for heavy decimation.
These occur all all temperatures from +20 to -15C, and I have yet to identify any pattern. The calculation usually returns to a very close fitting line after some period with the offset with about 50% of the overall time with a closely fit calibration. This is persistent through all the different oversampling intervals and stronger decimation does not remove the artifact – it’s in the raw data. No idea why…though I am wondering if perhaps the clocks entropy drift is somehow quantized?