Arduino Pro Mini Data Logger : Part 4 : Power Optimization (2015)

The first three tutorials in this series show how to build a promini based data logger that should sleep around 0.25mA, depending on the quiescent current of your sensors and your μSD card. That will usually get you to at least 6 months of operating life before a bank of three AA batteries in series falls below the 3.5v cutoff on your regulator, and most of our field units make to about 11 months on a good quality set of alkaline AA’s. With their flatter discharge curve, lithium AAs would probably have carried those logger past 12 months,  but if you really want the logger to pass one year of operation you need to do a few other things that might be a bit of a stretch for beginners.  So I am posting them here as “additional” things to tackle once you have built a few of the basic loggers and have them working Ok.  Use the cheap parts till you get the hang of soldering and working out how you want your cables & housing to go together physically.  I find that things usually go well the third time I make a new prototype.

A DIY data logger

Usually takes me about 20 minutes to assemble, or less with solderless headers. At any given time I probably have 6-8 of these breadboard loggers running on the bookshelf to test different hardware and code combinations. Be careful not to bump the SD card connections though, as its easy to kill the card with unexpected power interruptions.

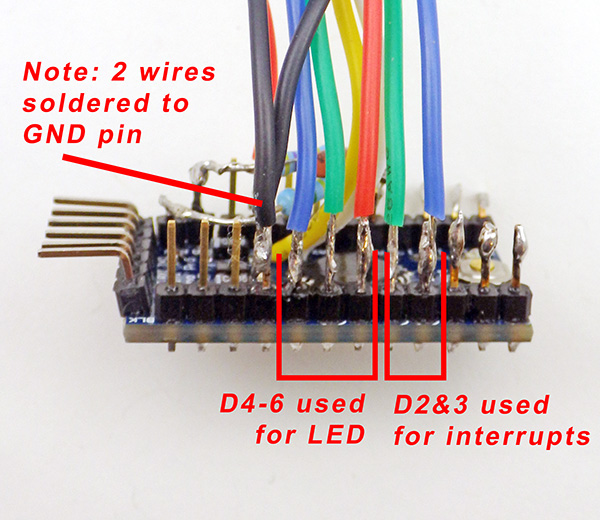
Without question the most important thing you can do to extend the life of your data loggers is to build yourself a breadboard “testing platform”.  This lets you determine the sleep current for each component on it’s own, making it easy to spot fake SD cards, or bad sensor breakout boards. And even good SD cards wear out with time , or are  damaged by high temperatures. Checking that cards and boards go to into a low current modes properly (after the main mcu sleeps) is the best diagnostic I have found to determine if the components are Ok. Good SD cards sleep between 0.05-0.07 mA, and these tend to be older Sandisk 128mb cards. Typical cards pull between 0.07-0.09 mA while sleeping. Any more than than that and I simply do not use the card in my data loggers. The difference between a good sensor breakout board and a bad one can be even more extreme, and you should always look for breakout boards that have a native 3.3v input line to avoid regulator losses. I already mentioned pulling up three of the SPI lines, and the breadboard unit lets you easily test how other pin configurations affect the logger. Pin states are generally preserved during sleep, though any timer dependent functions (like PWM) will be shut down when the associated timer stops, unless you use ‘idle’ mode.  Always avoid floating I/O pins.

Retrofit an MCP1700 voltage regulator to an ebay clone

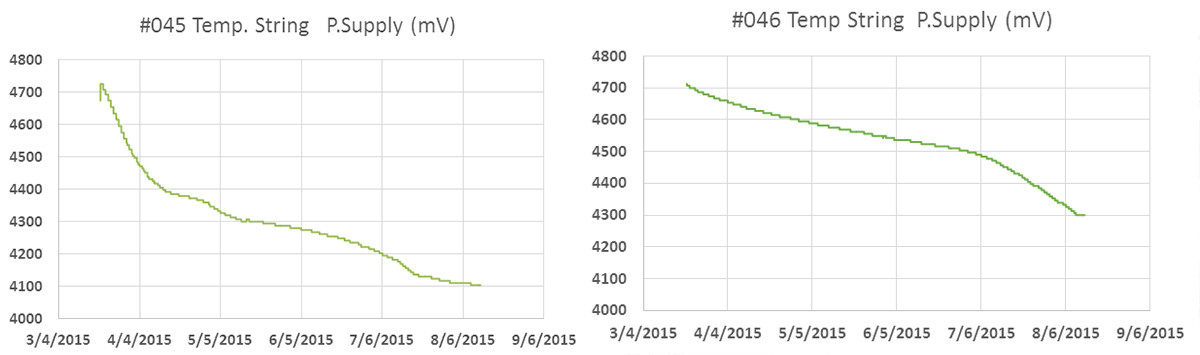
All you have to do to retrofit any 3.3v mini-style board with a more efficient MCP1700 is connect the external regulators output directly to the 3.3v pin, which is the main power rail behind the default voltage regulator. This by-passes the onboard Vreg the same way that your UART board does when you are tethered to USB. When I do this modification I completely remove the original regulator from the Arduino board so there is no leakage current slipping through it while the logger is sleeping.  Also be sure to move the high side of the resistor divider you have monitoring the battery voltage to the new regulators Vin line. Replacing the MIC5205 with a MCP170x will save you ~0.05 mA of sleep current, depending on your particular board. That doesn’t sound like much, but it all adds up over time, and you have 100 mA more current available to power your sensors.

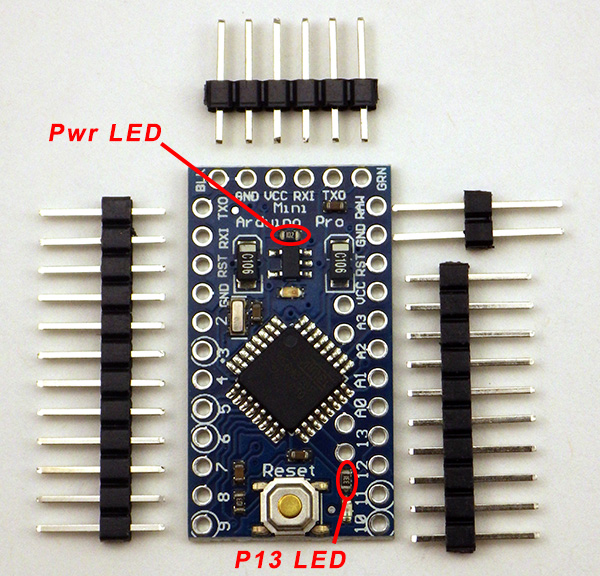
When you test your components individually you notice that there can be significant differences from one pro-mini board to the next (especially with cheep eBay clones) and much of this comes down to the voltage regulator. Sparkfun Pro-mini’s use a Micrel  MIC5205 150mA LDO Regulator, and there are more efficient options out there. I have had success with boards that use MCP1700  & MCP1703 regulators (datasheet) like the Rocket Scream Mini Ultra or the Moteino. Each board has a unique pin-out, so you will have to figure out where to put the jumpers for each particular board.  You can also simply bypass the pro-mini’s on-board regulator and use an external voltage regulator (see the image posted at the bottom of that thread by fat16lib – don’t forget the 1 µF caps.  MCP1700s @ < $0.50 ea here ).

Sleeping your processor & components at every possible opportunity is vital. If there is a power wasting delay statement left in your code anywhere, there ought be a really good reason for it (like waiting for your ADC reading to stabilize, etc)

YL-90_AT24C32eeprom1

You can flick the SCL and SDA pullup off the board easily with the tip of a soldering iron.

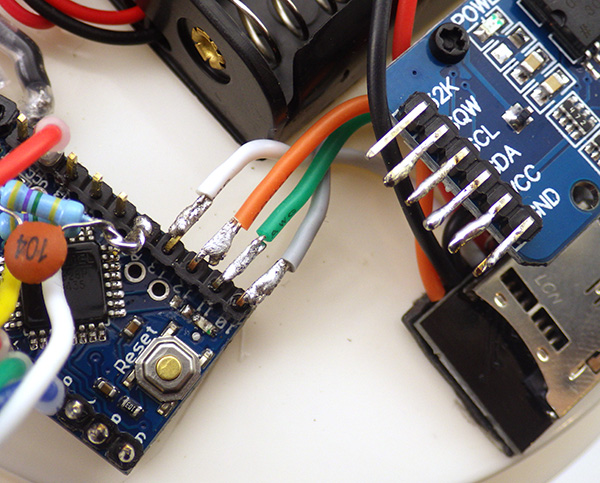
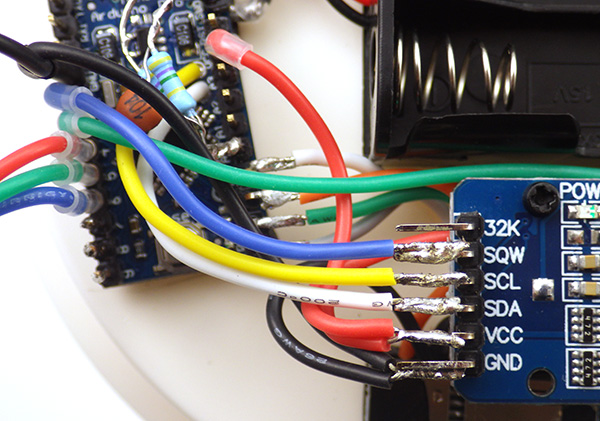
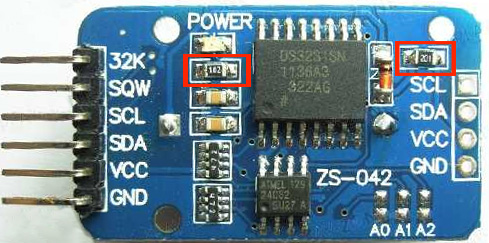
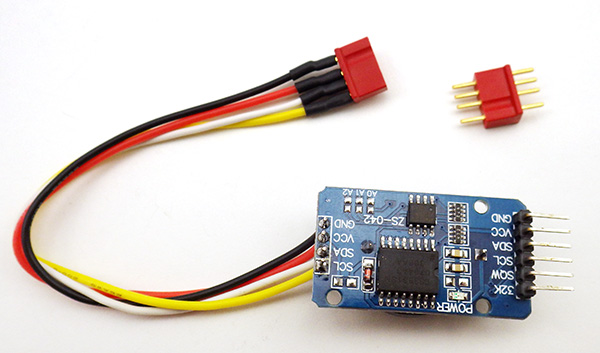
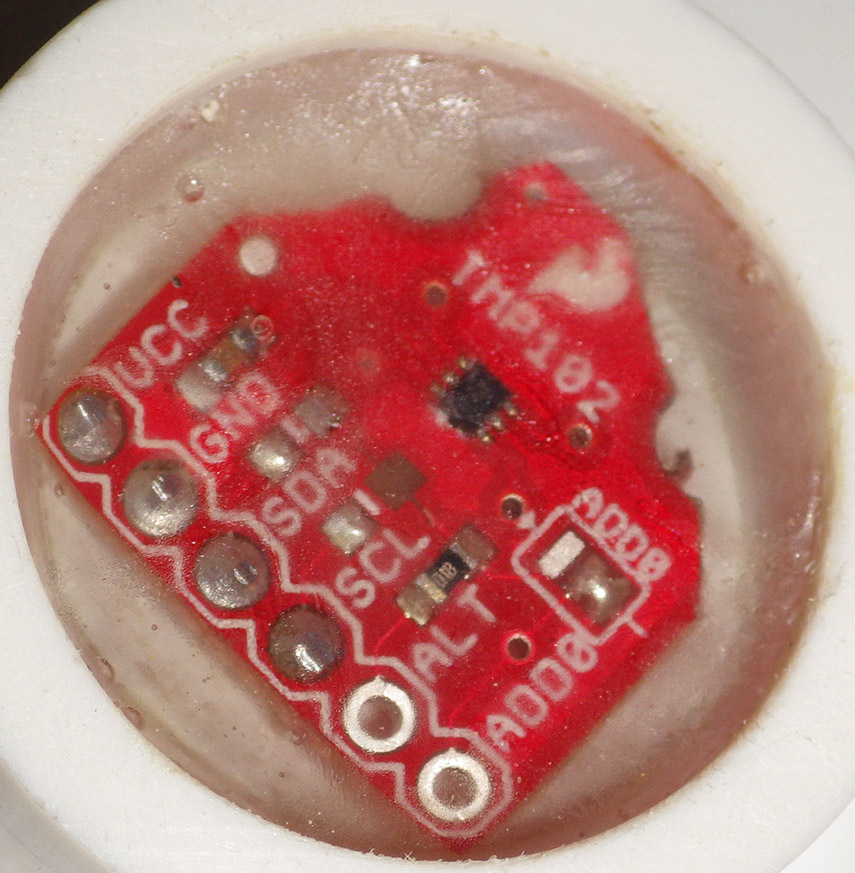
The next life extending technique is to add a larger I2C eeprom so that you can buffer more data before you write to the SD card. The functions I use to do this buffering is included with the I2C eeprom tester example I posted to gitHub.   Eeprom power consumption limits to how far you can take this strategy, but switching from the 4K AT24C32 on that RTC breakout to a 32K AT24C256  provides a $1 way to extend your operating life by 5-10% depending on the amount of sensor data you are handling. The two eeproms are from the same Atmel family, and the wire.h I2C library limits you to 32 byte page writes, so all you have to do is change the bus address in your code and you are done! Same applies to the AT24C512 all the way up to the 2Mb AT24CM02 if you can find them. You can also lift & jumper the address pins (A0,A1) to enable up to four of these Atmel boards on the same bus. (and it would require some code tweaking, but you might also be able to swap some of the larger Microchip brand I2C eeproms into the cheap press fit DIP boards if you wanted bigger chips to play with. Or you could just roll your own breakout board  for a whopping 1024Kb with the 24LC1025 and the 24AA1025 ) The logical end game if you go down the eeprom road is to abandon simple ASCII and start working with struct’s in C.  Then you could store a years worth of data without any SD cards at all.

 .
Isopropyleeprom
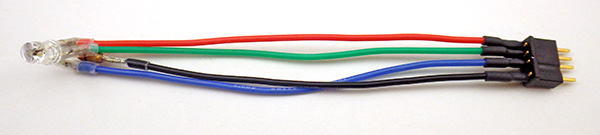
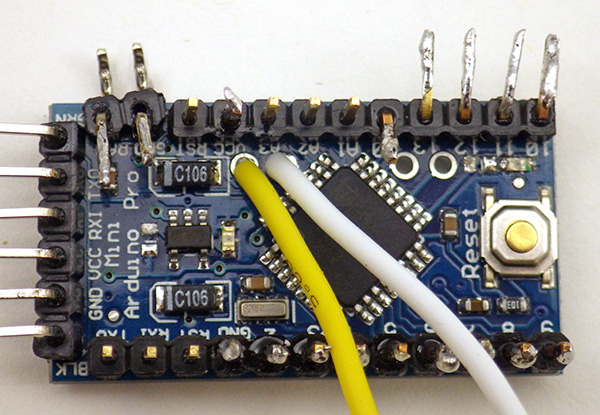
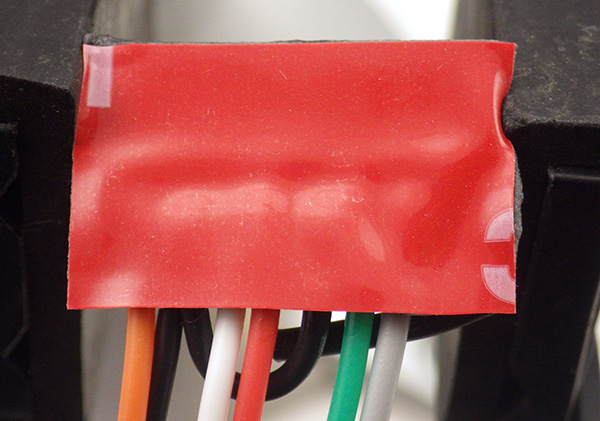
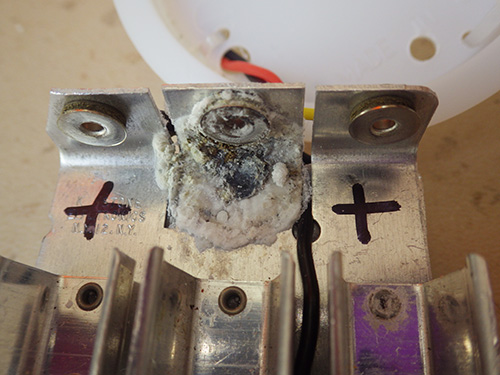
1. Remove the two pull-up resistors from the YL-90 breakout (if that’s the one you are using ) as the RTC board pull-ups are sufficient.  Straighten the riser pins and trim them to about 1/2 length.

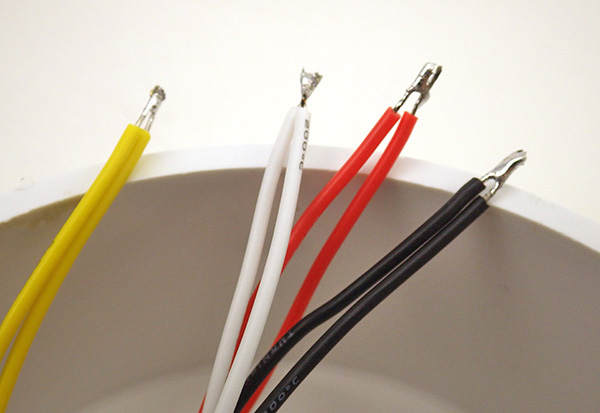
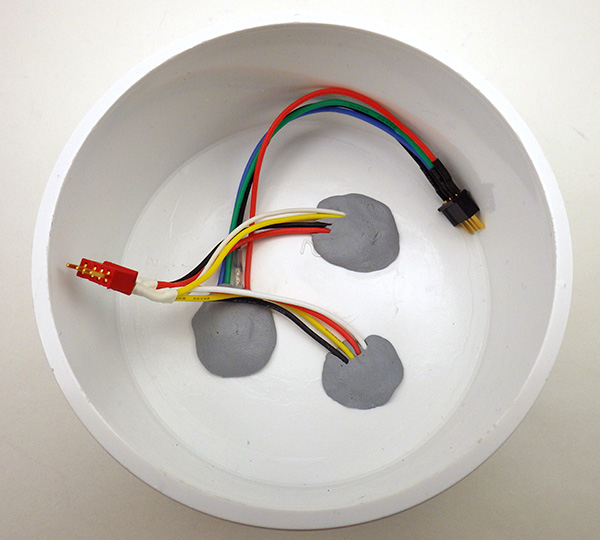
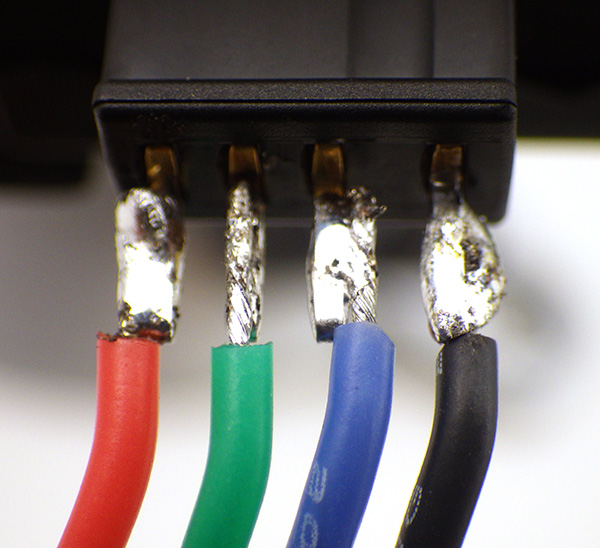
2. Cut 2” lengths of Black, Red, Yellow, and White wire. Solder them to GND, VCC, SDA, and SCL respectively. Shrink wrap the solder joints.

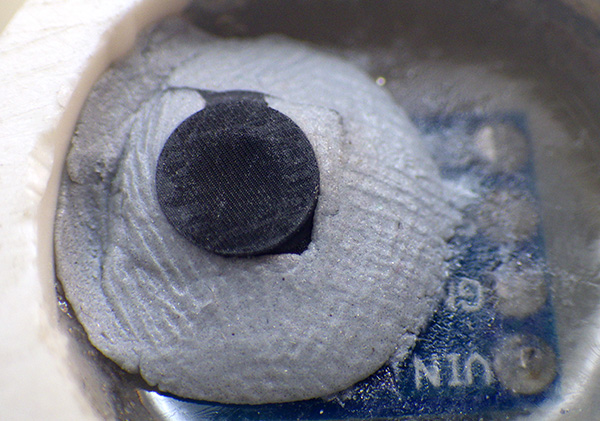
3. Clean the board with alcohol and let it dry.  Apply conformal coating if desired and put a patch of double sided tape on the bottom.

jumpering the eeprom board

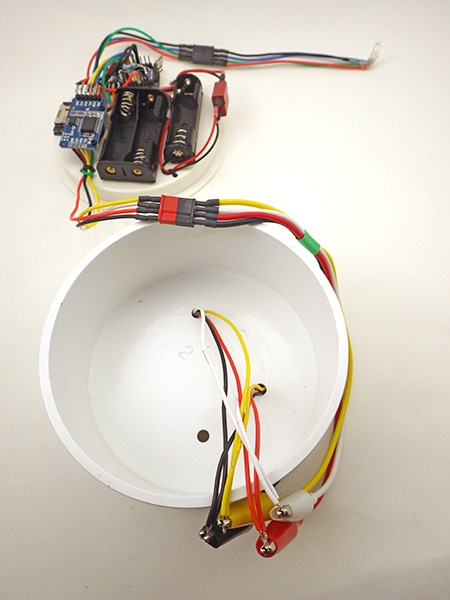
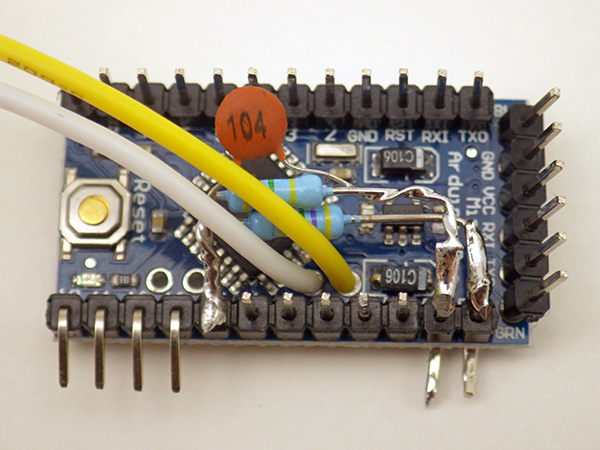
4. The next step is to adhere the eeprom to your logger platform via the tape, so that you can cut the jumpers to length. If you left some excess wire protruding from the board when you added the bus interconnect for the sensor cap, it’s pretty easy to patch the four eeprom wires right onto the cascade port.


Sleeping & buffering are the low-hanging fruit, and after that you get into trickier techniques to improve the power budget. For example that new eeprom also lets you push the bus speed above the 100kHz default if your other I2C devices can handle it. I am still testing prototypes at 400kHz, even though that violates the Tlow spec on 8mHz AVR processors, so I am cautious about recommending that to everyone until I see those units deliver a year of good data. But the results have been promising so far...

Cave Pearl data loggers
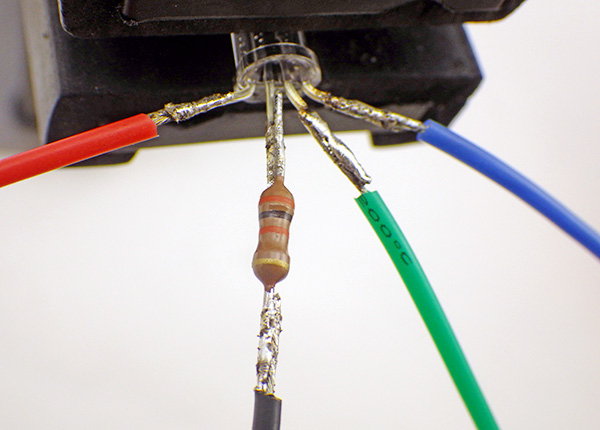
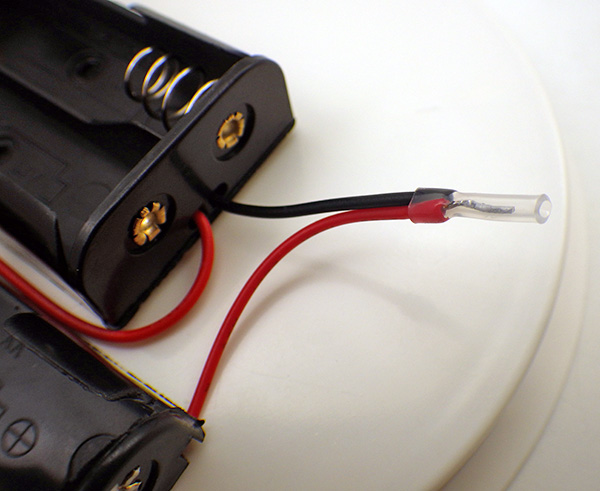
Another useful modification is powering the RTC from a digital pin. For some reason I have not been able to dig out of the data sheet, the DS3231 pulls almost 0.1 mA when it is powered by the Vcc pin. Fortunately, you can force the IC into a miserly 3μA timekeeping mode if you draw that Vcc pin down, and if the Battery-Backed Square-Wave Enable register bit is set the RTC will still generate alarms when running off of the backup battery. But the soldering for this is a bit tricky:

Cave Pearl data loggers
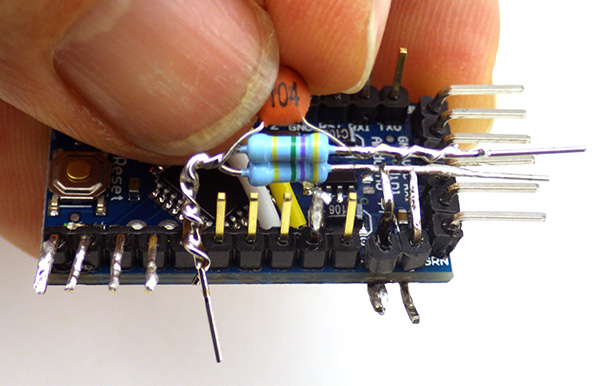
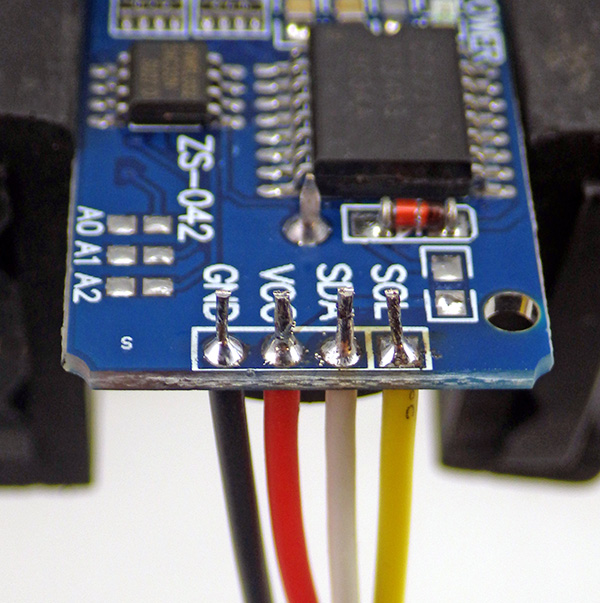
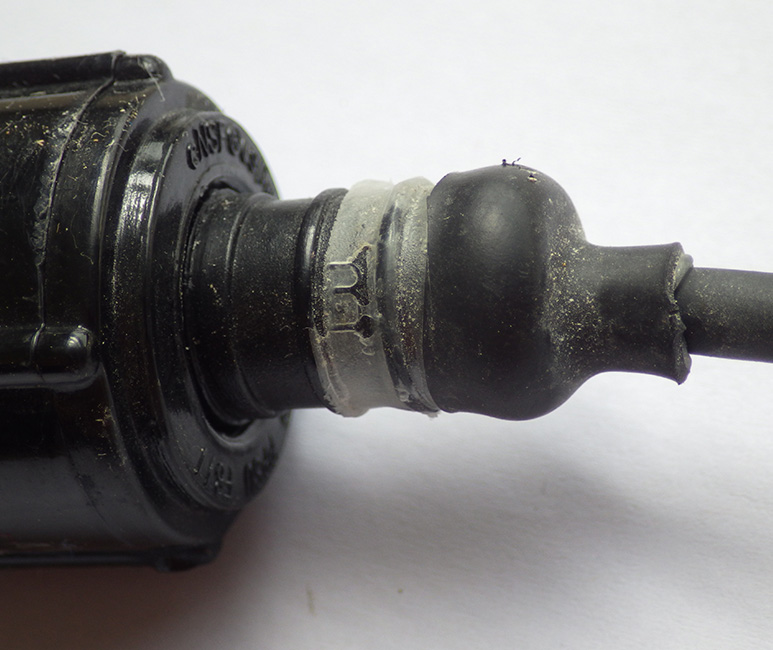
1. After removing the power LED & charge circuit resistors from the RTC board, wedge a fine tweezer tip behind the power pin and apply an iron to the pad on the board. When the solder melts gently lever the pin away from the board.

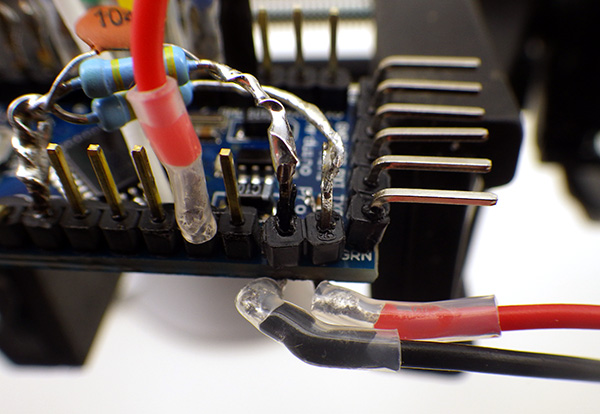
2. Then tin the pin, and solder a jumper wire to the lifted power pin, being careful not to bridge any of the other connectors in the process. I usually secure the jumper wire to the board with a zip-tie so that no physical stress can be transferred to that tiny solder connection later.

Cave Pearl data loggersAt that point you can attach the jumper to a free digital pin on your Arduino, and use digital.write(pin#,HIGH/LOW) to power to the chip only when the logger is awake.  My pin-powered builds have eight months under their belt now, and by spring 2016 I will know if the CR2032’s can provide enough power to drive the RTC in timkeeping mode for a full year. (2016 note: they all made it!)  I am trying to track the coin cell status with another voltage divider on the breakout board, but since lithium cells keep their nominal voltage until they are completely dead unless you provide a load, that record might not give me any useful information. I will post updates on those experiments on my RTC page as they become available. (Note: Even with the default MIC5205 reg on the promini, pin-powering the RTC like this should get your logger down to ~0.17mA sleep current)

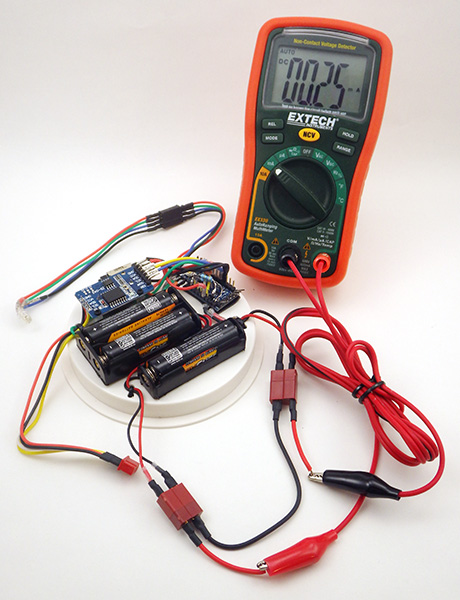
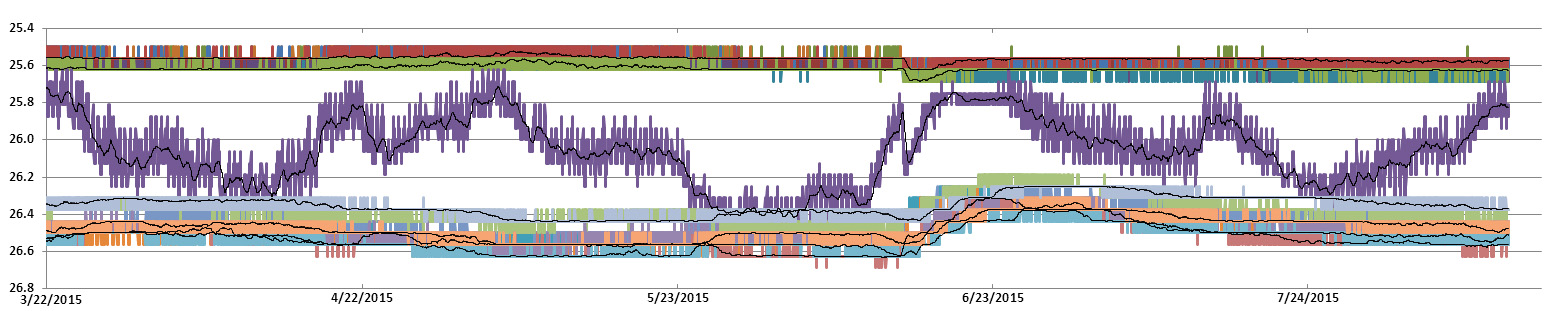
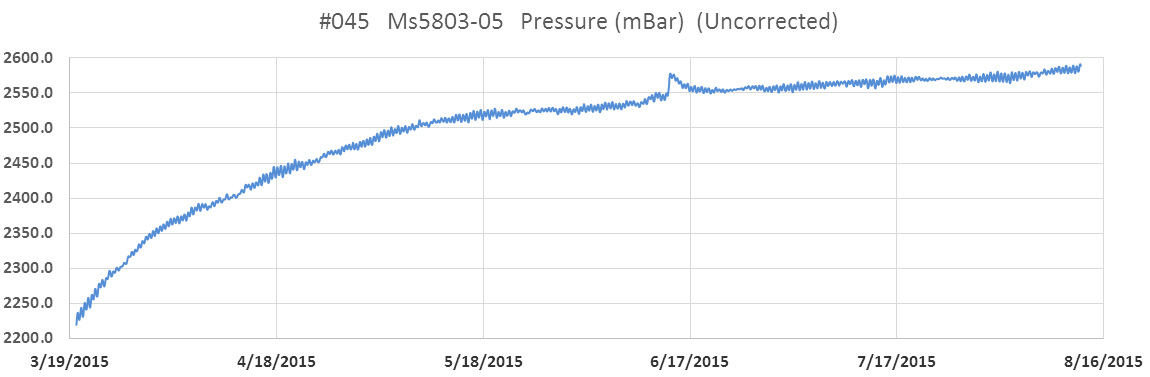
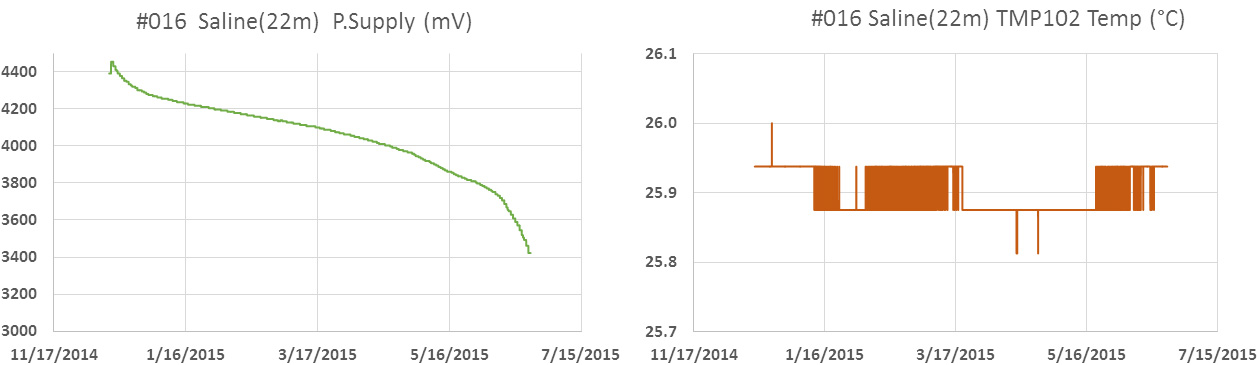
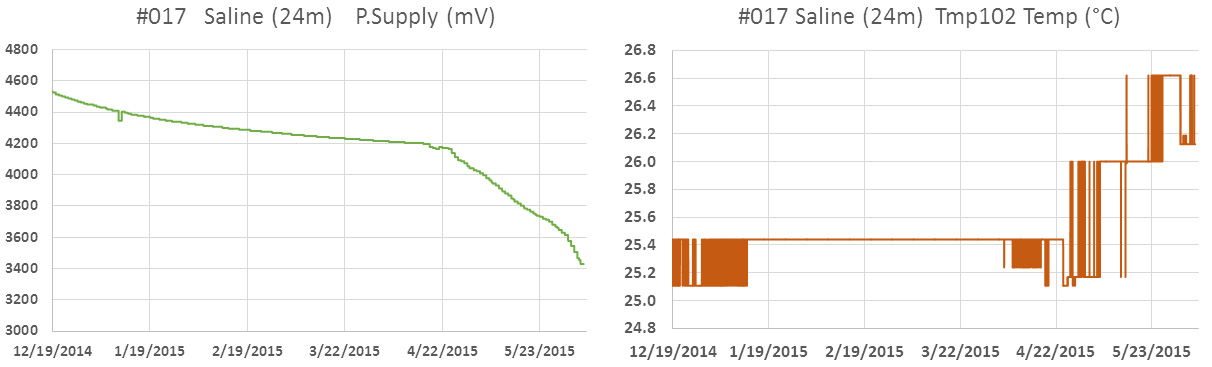
By testing components, changing regulators, buffering, and pin powering the RTC, I am now seeing power curves like this:

036_inCave_PR&RH_20150324-0806

This unit had a TMP102 temperature sensor,  an MS5803-02 pressure sensor, and an HTU21D RH sensor attached, and it still took four months to burn off the over-voltage on 3 AA Duracells. (with a 15 minute sample interval) The logger slept at 0.15 mA because all those sensors all have great low power sleep states.

Though I have reached my original one-year goal, I still keep an eye out for other ways to save power. Several people have explored using a MOSFET to de-power the SD cards but according to the fellow who actually wrote the SdFat library, there are some issues wrt multiple re-starts of the SD library . He also warns that you have to close all files and allow at least one second for the SD card to power down before pulling the plug, just in case you accidentally trigger some internal housekeeping event with the file close command.  The folks over at OSBSS claim they can switch the low side without problems and Nick Gammon seems to be having success with his THL logger switching the high side, though those two examples leave me wondering which way to go.  Some set all the SPI lines HIGH & INPUT before powering down to prevent parasitic leakage after the cut, though the guys at Solarduino imply only the slave select line is vulnerable to the problem, and suggest that line won’t leak if you switch the low side (?)

Another potential factor is low 3.3v I’m using to control the FET, discussed here at  CMicrotek’s Low-power Design Blog:

“When using a P-channel FET to drive a load, a GPIO may not drive the gate high enough to completely turn off the FET so you may be leaking power through the FET. This can often go un-noticed since the amount of power is too low to activate the load. A P-channel FET of similar rated voltage and current as an N-channel FET will typically have 50-100% higher Rds(on) than the N-channel FET. With Rds(on) specs on modern FETs in the double-digit milliohm range even doubling the Rds(on) produces a fairly low value. However, that is simply wasted power that can easily be eliminated if low-side switching is an option for your application.”

Reading that makes me lean towards low side switching; though the 2n7000s in my parts bin probably can’t be fully turned on with only 3.3v on the base?  (Note:  there are beefier N-channels out there  that will work with a 3.3v system if you are also de-powering high current sensors)  Luke_I has proposed using SPI.end() to kill all SPI communications once all files are synced and closed but most people simply set the SPI control register SPCR=0;   When you restore power  after low side switching you have to reset SCLocK(D13), MOSI(D11) & CS back to OUTPUT (MISO stays at input) and set the SCLock line LOW to disable that pullup.  Then you reinitialize the SDcard with sd.begin(chipSelect, SPI_FULL_SPEED);  and reopen your files.   Several sources have suggested that only SdFat allows this re-initialization , while SD.h does not.  

One possibly important thing to note is that the sandisk datasheets states (pg 11) 

“Power must be applied to the VDD pin before any I/O pin is set to logic HIGH. In
other words, CMD, CLK, and DAT0-3 must be at zero (0) volts when power is
applied to the VDD pin. “ 

But perhaps this only applies when accessing the cards in their native SDIO mode? But this does make me wonder if you are supposed to turn on the mcu’s internal SPI peripheral before, or after you restore power to the SD card (?)  I think that datasheet suggest you should be doing it after, but they are switching the high side in that example case.

You can extend that strategy and cut power to the entire logger. As I mentioned in the RTC post, the most elegant way to do this would be using the RTC alarm (outputs low) to control a P-channel Mosfet on the high side of the main battery supply.  When the INT/SQW alarm goes low, this turns the mosfet on and powers everything including the main mcu board which would then goes to work taking samples and storing data. Unfortunately some of my builds use interrupts from both the RTC and the sensors, and there is a good chance that with these frequent startup initializations the resulting delays could miss the phenomenon I was actually trying to capture; like tipping bucket or wind sensor reed switches.

Addendum 2016-02-06

Just thought I would post another shot of a retrofit with an MCP1700 voltage regulator:

Cave Pearl data loggers

Note: I used a 6 volt input MCP1700 here, but the MCP1703-3302E/TO accepts up to 16v

…with the addition of a 2 x 4.7 M‎Ω  voltage divider to put 1/2 of the RAW input voltage on A0. Note that the onboard vreg has been removed (normally you would see it just under the cap in front: you can see some of the empty pads still there) and the two led limit resistors have also been pulled. Other than the mcu there is not much left but the crystal & some caps, and I now think of the board itself as simply a convenient breakout for the 328p. This retrofit with an MCP1700 looses the shutdown enable functionality of the default MIC5205 (marked KBxx or LBxx), and the noise suppression features, but I am hoping the caps are enough to deal with that.  The 1700’s are more efficient at low power than the 5205’s which limp along at about 20% efficiency below at 0.1mA, and loggers typically spend 99.9% of their time sleeping.  The XC6203E332PR is another low-ish standby power option if you need output currents in the 400mA range.

On more recent builds I have started moving the voltage regulator & battery divider from the Arduino board to the battery connectors. Note the ceramic 105's on the MCP1700 as per the proper spec.

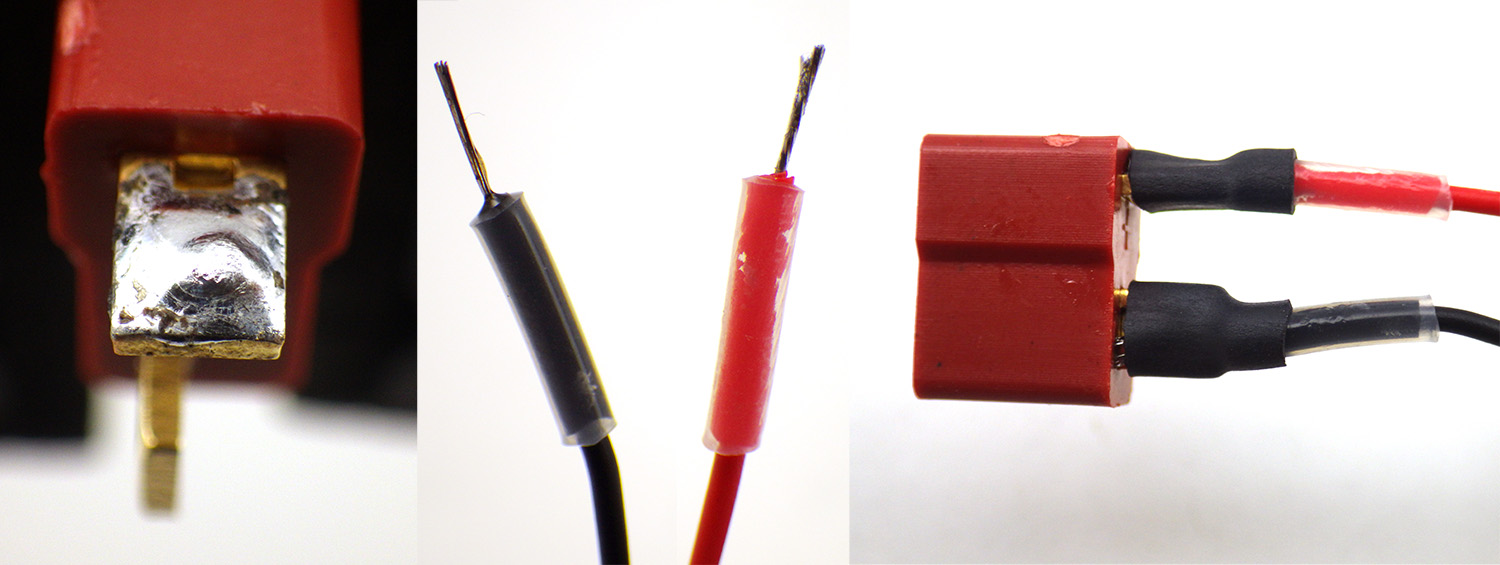
On late 2016 builds I started moving the  replacement voltage regulator & battery divider away from the Arduino to the battery connector. Given that this is now separated from the caps on the main board, I’m using ceramic 105’s on the MCP1700 as per the spec. Three wires run from this deadbug back to the pro-mini: 3.3v, GND, and 1/2 battery voltage from that 2x10M divider, which gets read on an analog pin.

Keep track of the capacitors if you change the voltage regulator, as the ones on the outgoing side are still connected after you remove the original reg. Sparkfun promini’s have a pair of black 10µF C106 smd caps on either side of the MIC5205 (& an extra 0.1uF on the output side). Several of the clones I checked match that layout, but others had a pair of 0range & brown tantalum 475C SMD capacitors (4.7µF). The MCP1700’s call for a fairly small 1µF on either side. Since my loggers are powered by a relatively large battery with little chance of brown out and no input noise, I have not been too worried about adding a big cap on the input side (often people add up to 100uF..?). I could probably get by with the output side caps already on the Arduino board, but I have been adding the ceramic 104’s (0.1µF) anyway, as I’ve seen a few forum posts suggesting that you get better noise suppression by using multiple capacitor chemistry-types with different ESR on outputs. And I am still careful to add 0.1µF ceramic bypass capacitor from +V to GND on every sensor IC.

If you combine a pin powered RTC, with the MCP1700 retrofit, and you have a good SD card, it’s not unusual to see the  logger platform sleeping below 0.1 mA, even for units built with cheap eBay clones. The pro-mini style board is only responsible for about a third  of that after the retrofit.

Addendum 2016-04-21

It would be a good idea to re-read Nick Gammons post on Power saving techniques for microprocessors, as much of what I’ve done to optimize these loggers is covered in more detail there.  For folks who want to take it farther, there’s good background info on low power design in Granssle’s article: Issues in Using Ultra-Low Power MCUs. And Hackaday’s post on TI processors shows how far the art in low power operation goes. 

Addendum 2016-06-04

Kevin Darrah has been posting some brilliant you-tube tutorials on lowering the power consumption of an Arduino. This includes a kill power circuit, which has been on my to-do list for quite some time now. Definitely worth a look. The rub of course is that you then have power-up latencies for everything.  That’s probably around 75-100 milliseconds for a typical Arduino, SD card initialization would probably be about the same (ie about 5 milliamp seconds) and a couple of sensor inits could easily double or triple that total.  So you could burn up to 25 milliamp seconds for the restart. Even with a sleeping SD card drawing power, a logger built with the optimizations discussed here usually sleeps at 0.14 mA or less. So a regular startup is probably equivalent to ~3 minutes of sleep time, and it would take several more minutes of sleep time power to match a really bad 1 second startup if you had some pokey sensors. So it all depends on how much time you need to get everything operational.  As best I can tell, I am still getting operating life that compares well to some of the power down approaches people are using.

Addendum 2016-10-17

Another tip for saving power is to always use high output LEDs, and to use the green as a status indicator color whenever possible. Why? If you look at the typical rating for a high output RGB you see Luminosity numbers like: 800R, 4000G & 900B mcd.  That means that you can use a limit resistor that’s three times larger on the green channel for about the same light output. I often get away with 30K on the ground line, and an extra 20-30K on the green line of a common cathode LED, and I’m still able to see the indicators with pulses in the 10-15 ms range.  With that much limiting resistance, the LEDs don’t impact the power budget at all. LEDs tend to stay lit for a relatively long time after they are turned off so switching the LED on/off with a 50/50 duty cycle at a rate faster than 1Khz will cut the power by half with an imperceptible reduction in brightness. While I would never leave an led on all the time for a datalogger application, if your application needs a power on indicator, consider a slow flash of the LED (for ½ second every 3 seconds)  instead of having it on constantly.

Addendum 2016-10-28

With my hardware reaching reasonable sleep currents, I guess its finally time for me to look at reducing the run time power use by turning off unnecessary peripherals with the power reduction register.  Heliosoph posted tests results from his capacitor powered project, with a reminder about grounding unused pins.  There are some 3.3v numbers over at avrProgrammers and Nick Gammon weighs in with some sage advice on his forum. Each peripheral doesn’t use much on it’s own, but together they total up to ~1mA that is just being wasted.  Here’s a few of the things I’m currently experimenting with:

  1. Disable the digital input buffers you aren’t using with DIDR0
  2. Never leave floating pins – always use a pullup or pulldown resistor.
  3. Disable unused module clocks using the PRR register
  4. Especially the ADC with ADCSRA &= ~_BV(ADEN);
  5. Shut off the analog comparator: ACSR |=_BV(ACD);

Here’s how those look in code:

#include <avr/power.h>
//defines for DIDR0 setting
#ifndef cbi
#define cbi(sfr, bit) (_SFR_BYTE(sfr) &= ~_BV(bit))
#endif
#ifndef sbi
#define sbi(sfr, bit) (_SFR_BYTE(sfr) |= _BV(bit))
#endif
// create variables to restore the SPI & ADC register values after shutdown
byte keep_ADCSRA;
byte keep_SPCR;
// then be sure to store the default register values during setup:
keep_ADCSRA = ADCSRA;   keep_SPCR=SPCR; 

//  1) where the ADC pins are being used, disable the digital input buffers 
//  from http://www.instructables.com/id/Girino-Fast-Arduino-Oscilloscope/step10/Setting-up-the-ADC/
sbi(DIDR0,ADC0D);  
sbi(DIDR0,ADC1D);  
sbi(DIDR0,ADC2D);  
//sbi(DIDR0,ADC3D);  //A3 not used as analog in
//sbi(DIDR0,ADC4D);  //A4= I2C data
//sbi(DIDR0,ADC5D);  //A5= I2C scl
//not needed for A6&A7 because they have no digital capability
//2) set unused analog pins to digital input & pullup to prevent floating
pinMode(A3, INPUT); digitalWrite(A3, HIGH);
//3) And pull up any unused digital pins:
pinMode(pin#, INPUT_PULLUP);

// Disable internal peripherals that you are not using:
// Note to self: Don’t mess with timer 0!
 power_timer1_disable();              // (0.12mA) controls PWM 9 & 10 , Servo library
 power_timer2_disable();             // (0.12mA) controls PWM 3 & 11
  power_adc_disable();                  // disable the clock to the ADC module 
  ADCSRA = 0;                                 // disable ADC by setting ADCSRA reg. to 0  (0.23mA)
  ACSR = B10000000;                  // disable comparator by setting ACD bit7 of ACSR reg. to one.
  power_spi_disable();                   // disable the clock to the SPI module
  SPCR = 0;                                        //disable SPI by setting SPCR register to 0 (0.15mA)
   #ifndef ECHO_TO_SERIAL
   power_usart0_disable();   //(0.08mA) but only if your are not sending any output to the serial monitor!
  #endif
// power_twi_disable();    // (0.18mA) I don’t usually turn off I2C because I use the bus frequently

// Shutting down ADC & SPI requires you to wake them up again if you need them:
// Before any SD card data saving:
power_spi_enable(); SPCR=keep_SPCR;  delay(1);
// Before ADC reading:
power_adc_enable(); ADCSRA = keep_ADCSRA;  // & throw away the first reading or two…

Still to explore:   Lower the CPU clock & then using a lower voltage power source.

Slowing down the processor doesn’t help much if you are trying to minimize processor up time,  but if you get into a situation where you are forced to keep the Arduino awake,  you could try to reduce the power consumption by slowing the main system clock.  I’m not brave enough yet to make new board definitionsmess with the CLKPR system prescaler, since I have so many sensor communication events.  Delay and millis I can deal with, but Timer0 PWM, ADC and probably a few other things have to be set in conjunction with CLKPR to keep them running at the right speed.  Slower clocks let you reduce the whole system voltage, but I still need to 3.3v because of the sensors & SD card.   Fuse setting still seems like the dark arts to me, and I’m not sure shutting down the BOD is a great idea for data loggers…

Addendum 2016-12-05

After you apply the optimizations described above the sleeping µSD card becomes the biggest power drain left in the system.  So I should probably add a reminder here that there is a huge difference between SD cards that sleep well, and those that don’t.  Sandisk cards smaller than 1Gb tend to have lower idling/sleeping current modes ~70µA, but it’s not unusual to see new large capacity cards drawing  200µA(I’ve seen spec sheets floating around the web for special  TwinMOS mircoSD cards, listing incredibly low sleep & write currents, but I have never managed to find any for sale.)   Cards between 64-256mb usually give me the lowest sleep currents, but because those older cards have to be purchased from eBay, there is also a significant difference in their speed when I test them with H2testw, with some being slower than 2.0MBytes/s, and others saving at 5MBytes/s or better. I presume that is because used cards get slower due to the onboard wear leveling circuitry working to avoid the accumulated bad spots, and the SD latency spec is worse than all of those, allowing a card to take as long as 250ms per write event. The default SD library in Arduino usually writes data at about 4500-5000 bytes per second, and even if SdFat performs significantly better even the slowest SD cards are much faster than the Arduino.  And my gut feeling is that the relatively slow I2C bus coms to the EEprom I’m currently using are sand-bagging the system so much that whole question of SD speed is moot until I start using SPI EEproms, or faster Fram

The point is, always try several different cards with your logger, so you can reject ones that do not sleep well.  With a good card you can get an optimized build below 0.1 mA between readings, but a bad sleeper will easily bump the logger back up into the 0.2 mA range, cutting your operating life in half.  It’s also worth remembering that there is a world of difference between how often you see problems with consumer grade vs industrial grade SD cards.

With regards to runtime current:  always format SD cards using SD Formatter, as OS level formatting utilities may adversely affect performance with the SdFat library. According to William Greiman (author of the SdFat library) “Performance of microSD cards is not easy to predict on Arduino.  Arduino uses SPI to access the cards and the SD library has a single 512 byte cache. Modern SD cards are designed to be used on the high speed 4-bit SDIO bus with very large (16 KB or larger) multi-block writes and reads so they must emulate the single block access that Arduino libraries use.  This can mean much internal data movement, erasing of flash, and rewriting of data.”  Once again, older, smaller SDcards suffer less from this problem than larger size cards, and it’s probably a good idea to try to match your data saves to that 512 byte block size.

Addendum 2017-01-20

One extension of getting your loggers down to a low sleeping current is that it becomes possible to power your data logger with solar cells, especially with 500F super caps  available for $3 each on eBay (& capacitor balancing boards at $1.50). A commonly seen conversion is 1Farad = 0.277mAh /V, so you can think of that 500F cap roughly equivalent to a 138mAh battery – somewhat similar to the capacity of a CR2032 coin cell.  Ignoring the pulse discharges for sampling, I’m seeing sleep currents in the 0.1-0.2mA range, implying more than a week of operation with that kind of power.   David Pilling has done some interesting experiments using cheap garden solar cells with super caps.   So has Nick Gammon, and the guys over at Solarduino.net and heliosoph.mit. 

The real question is how to get the logger to recover gracefully from a brown-out event if the sun goes away for an extended period of time, and then comes back and is able to charge the caps up again…

Addendum 2017-05-21

Well, I finally took the plunge and started cutting power to the SD cards: Switching off SD cards for Low Power Data Logging.   I left that step for last because as I was being cautious about anything that might put my precious data at risk, but so far (and I am still testing the heck out of it) is seems to be working well.

Addendum 2017-12-22:

It can take a reasonable amount of soldering & code Kung-fu to implement the power optimization methods described above, and if you haven’t quite reached that level the Adafruit TPL5110 Low Power Timer provides a alternative approach to power management for only $5.  Cfastie has been putting this board through it’s paces over at PublicLab.org.

Arduino Pro Mini Data Logger : Part 3: Sensors & Housing (2015)

Build Instructions – Part 3:  Sensors & Housing

Note: This is the third tutorial in a series providing detailed build instructions for a DIY data logger based on a Pro Mini style Arduino board.  Part 1 of this series covered preparation of the 3 core components for assembly, and Part 2 described connection of those components into a functioning logger. If you are landing on this page for the first time, it might be a good idea to start at the beginning of the series.

Status indicator: common cathode RGB LED

1. Test the common cathode LED with a 3v CR2032 coin cell battery by connecting the GND (usually the longest wire) to the negative side of the battery and each other wire to the positive side of the cell in turn. Note which lead is for red, green, and blue.  Usually the red lead is the one closest to the FLAT side of the led, and the ground pin is the longest lead but there is variation between manufacturers, etc.

LED12. Trim and add a 30 K ohm limit resistor to the GND line. On some RGB LEDs, green is 2-3 times brighter than the other colors, so you can add a second 20-30K ohm resistor to the Green LED line if you power budget is tight, although this will make the green indicator hard to see in full sunlight.


LED23. Cut 4” lengths of Red, Green, Blue, and Black wire. Solder them to the respective LED connections and use shrink wrap to protect the joins. Carefully bend the leads to a 90 degree angle to facilitate mounting in the housing cap later.


LED34. Trim the LED wires to the same length, then strip, twist and tin the ends.  The LED wires will be connected to the male side of a black WSD1241 Micro 4B plug connector, maintaining the same R, G, B, & GND pattern used on the corresponding logger side connector.  Make sure that the other side of the connector is attached while you are soldering so that the plastic doesn’t melt out of shape.


LED complete

You can connect and test your completed LED with your logger platform running the Blink sketch, by replacing the default pin number 13 in the code with 4, 5 & 6 respectively.


I2C Sensor Breakout Boards

Many sensors are available on I2C breakout boards. This guide shows pictures of several including an Adafruit MCP9808 temperature sensor and a MS5803-05 pressure sensor, but the four standard bus connections (VCC, GND, SCL & SDA) would be the same for any I2C sensor and they all get connected in parallel. The DS3231 RTC breakout board in this build puts 4.7k pull-ups on the SCL & SDA lines that we tap at the cascade port. So if you are using multiple sensors you may need to remove the pull-up resistors from some of your sensor boards because those resistors also end up in parallel, and this can place too much pull on those bus lines for the sensors to overcome. If you are only adding one sensor to your logger,  you can usually get away without bothering to remove them.

jumperedI2Cboards1. Cut 3-4” lengths of Red, Black, Yellow, and White wires. Strip, twist and solder those wires to red=VCC, black=GND, yellow=SCL, and white=SDA holes respectively. I find that this is much easier to do with the board in a rubber footed panavise, and the wires supported by ‘helping hands’. Where space is limited, I sometimes mark the wires with a sharpie so I can keep track of which leads go to which sensor from the underside of the pvc cap.

2. Trim and clean the soldered side of the board with isopropyl alcohol to remove flux residue. Trim the free ends of the wires to the same length, and strip & tin the ends. We will be adding a 4 pin deans connector later, but for now leave the ends of you sensor wires free. The sensors will be tested once the wires are inserted through the housing cap, and after the sensors pass the testing stage the connector will be attached to the leads


Mounting sensors on the housing

This part of the build should be done in a well ventilated area (ie: outside or in fume hood if you have one) as pvc solvent fumes are toxic. Make sure your sensor boards have been completely cleaned of any flux residue with q-tips and 90% isopropyl alcohol before potting them!

SensorCap11. Once lead wires are attached to your sensors, select 1cm tall pvc rings of sufficient diameter (1” dia. & 2x ¾” dia. shown here) to contain your sensors and arrange them on top of a 4” PVC drain cap. Often it is handy to leave room for and extra sensor well, as you may decide to add another sensor to the cap later.


2. Roughen the surface of the cap and the inside of the PVC rings with sandpaper to provide some tooth for the epoxy that will be used to pot the sensors later.  Sand the lower edges of the pvc rings so that they  are level and form a tight fit with the top surface of the 4” end cap.

Solvent13. Clean both surfaces, and give the two surfaces that will be brought together a light coating with clear pvc primer, then put a thin bead of pvc cement on the lower surface of the pvc ring and bring it into contact with the previously primed area on the large end cap. It is important that you use ‘just enough” of the primer and pvc cement to bond the rings. If you apply more than a thin bead, the solvent will fail to bond.

Cave Pearl data loggersVery quickly after applying the pvc solvent cement to the ring, put it into place on the surface of the end-cap. You will need to apply firm pressure to each ring with your fingers for about 2-4 minutes until the ring is bonded to the cap surface. PVC cement usually cures to reasonable strength in about 30 minutes, but I like to leave my solvent welds to set over night because residual PVC solvent can interfere with the curing of the potting epoxy and/or turn it an ugly yellow color.

Cave Pearl data loggers4. Once all of your sensor well rings are in place you will need to drill holes for the wires to pass through the cap for the indicator LED and sensor wires.  A 7/32” bit produces a hole slightly larger than a typical LED, allowing you to insert the led from the inside of the housing.

This size hole is also a reasonable size to accommodate the wires from you sensor breakout boards.


LeadWires1PVC is generally a very easy material to drill, but beware that the cap can be wrenched out of your hand violently if the bit bites into the cap the wrong way. Also be sure to wear eye protection whenever you operate a mechanized shop tool. Drill bits often break while you are using them, and then the little bits of metal go flying in all directions. If you have never operated a drill press before, seek guidance from someone with experience.

I2C test leads5. With the LED leads inserted through the cap, neatly strip, twist & solder together the four corresponding I2C bus wires at their ends. To these exposed wires attach the ends of an alligator lead adapter cable (photo below) that has your standard I2C bus connector on one end. It’s a good idea to make some of these cables for all of the connector styles you are using on your project so you can connect raw sensor wires to your logger platforms for testing.

testing16. With the logger connected to your computer via a USB-UART adapter, run a generic I2C bus scanning utility like the excellent multi-speed scanner by Rob Tillaart to see if the devices are reporting an address on the bus. Then run test utilities appropriate to your individual sensor to confirm that your sensor boards are operating normally and delivering data.  The software you use will depend on which sensors you are testing. Libraries are often provided by better sensor vendors like Adafruit & Sparkfun, and the Arduino.cc forums are a good place to look for useful test utilities that others have shared.

It is essential that testing be done at this stage BEFORE you permanently pot the sensors into place with epoxy!

testing27. Once the sensors are confirmed working, you can solder them more permanently to the male side of your connectors. I usually use the red Deans Micro-plug connectors for the I2C bus lines from the cascade port on the RTC so that I don’t mix them up with the black connectors I use on the LED lines. Be sure to follow the same connection pattern that you used previously. I like the Deans because they are keyed:  I always put the GND and Vcc lines in the same position with these connectors, so that even if I make an error when connecting the sensor cap – no part ever gets exposed to a polarity reversal.

putty compressed8. The next step is to mount the sensors more permanently on the sensor cap. I do this by potting the sensor breakout board into place with Loctite E-30CL epoxy. (which remains liquid for at least 2 hours) so we first need to seal the wire pass-through holes in the housing.

Cut and knead a pea-sized bead of plumbers epoxy putty until it is well mixed (it will become slightly warm to the touch at that point) and wrap it around the wires underneath each sensor board so that it completely surrounds the wires. Then press the board and the putty wrapped wires into the hole in the housing until it forms a complete seal.  It is important that the sensor breakout board be relatively level, parallel to the top surface of the pvc end cap, so that the epoxy that will be applied later does not accidentally cover the parts of the sensor that need to be exposed to the air. The putty usually takes about 5 minutes to set.  Repeat this procedure for your other sensor boards and let your top surface putty harden (~15min) before proceeding to put putty in the inside of the housings.

LEDputty9. Cut and knead another larger bead of putting and wrap it around the indicator LED as shown. Before the putty hardens press the led through the appropriate hole from the inside of the housing so that the putty forms a complete seal against the roof of the housing. Smooth the putty until the LED wires are pressed closely up against the roof of the housing and let it set (5min).

Cave Pearl data loggers10. Cut and knead more beads of putty and press these up against the other sensor wires passing through the housing. The goal is to have the wires laid out flat and smooth, rather than emerging perpendicular to the top of the sensor cap where they would interfere with the logger platform.

Let the plumbers putty cure for 15 minutes before proceeding. It’s worth noting that it is possible to remove this stuff later on if you have a sensor failure, but the results are usually a bit ugly.

Cave Pearl data loggers11. At this point you have the LED and sensors mounted to the top of the top of the cap, but they need to be potted to become moisture resistant. With an applicator gun and mixer nozzles that allow flow control down to the single drop level, fill the PVC sensor well rings from the bottom with epoxy until the circuitry of the breakout board is covered. I usually use Hysol E-30CL but any epoxy or urethane with very low moisture permeability should work. I even have loggers sealed with JB weld, that survived six month exposures to salt water, but a clear compound lets you inspect the units better as they age.  Let any potting compound completely cure before exposing your loggers to the environment. I usually wait a week or more (while running power consumption tests) before deploying a new unit.

RH sensorMany sensors such as temperature, magnetometers, and MEMs accelerometers can be completely encased in the potting epoxy and function well. However some sensors, such as those for PRESSURE and RELATIVE HUMIDITY require that certain surfaces remain exposed to the air for them to function properly.

RH with dust capYou must be careful not to spill any epoxy onto those sensor areas or they will be ruined!  Fill the sensor wells with epoxy VERY slowly from the bottom and stop when the epoxy just covers the top edge of the sensor breakout board. Sometimes it is helpful to use a thin wire to paint the epoxy over the soldered breakout board traces while avoiding the sensor itself. The image above is from a HTU21 RH sensor and gives some impression of how tricky this can be to do well.  That sensor is approximately 3 mm per side. If any epoxy had entered the small exposed hole at the center of the chip the RH sensor would have been destroyed. (yes, I have lost a few…) Some sensors also require a covering cap, and it is generally easier to use plumbers putty to affix these protective fabric caps into place after the epoxy has cured, rather than trying to do sub-millimeter adjustments with liquid epoxy.

MasonsSensorPottingThe indicator LED is easier to deal with as it is already sealed inside a clear plastic housing, so it only needs enough epoxy to seal the housing pass through. For sensors on cables, I usually fill the wells to the very top to provide some protection against flexing. You may need to clamp those wires in place so they remain at 90 degrees to the housing while the epoxy cures.  In the first hour or so after pouring the epoxy it’s a good idea to check it periodically and break any large bubbles that rise to the surface with a pin. Slower epoxies often let most of the bubbles escape on their own.

Slower curing epoxies are generally more moisture resistant, but they can take up to 24 hours to harden.  It is worth noting that some epoxies contract while hardening, and I have noticed that this sometimes produces a permanent offset in my pressure sensors.

platform parts12. After the epoxy has cured, you complete the logger assembly with a Fernco PQC-104 4″ Qwik Cap rubber boot which will hold the logger platform in place inside the PVC drain cap.


This unit detects drips down to 12cm drip fall

The round bottom of this housing is pretty stable when resting on a flat surface, but you can mount the logger more securely by threading a few zip-tie loops around the metal pipe clamp before you tighten it to seal the housing.  Then you can use those loops as tie down points. A 10 gram silica gel desiccant pack tucks nicely under the knockout platform. Get the ones with indicator beads so you know when they have expired.


Post assembly testing:

1. Test the LED
Open Blink again with the LED connected to the Arduino (Remember to set board and com port). Change the LED to Pin 4. Verify and upload. The red led should start flashing.
Repeat with pins 5 and 6 to test green and blue respectively.

2. Test the I2C bus
I usually use Rob Tillaart’s multi-speed scanner to determine if the devices are responding on the I2C bus:  https://github.com/RobTillaart/Arduino/tree/master/sketches/MultiSpeedI2CScanner
With the scanner running, specify P to return to output only the addresses that have devices, and specify S to run a Single Scan. The RTC breakout board has an AT24C32 eeprom at address 57 and the DS3231 RTC will show up at address 68. Your other devices should report other bus addresses as per their data sheets.

Note:  the AT24C32 is only rated for 100khz operation, but the DS3231 is rated for faster bus speeds up to 400khz. Also note that the I2c address of the DS3231 can be changed by joining solder pads on the breakout board if you have an address conflict with your sensor.

3. Test the DS3231 RTC
I use the library from https://github.com/MrAlvin/RTClib because it allows me to use sub minute alarms during debugging, but there are many good DS3231 libraries out there to use. The setTime & getTime code examples that came with older versions of MrAlvins lib provide a good way to test your RTC functionality.

  • Open & upload setTime File/Examples/RTClib/settime (from the link provided above) to set the RTC to your computers current time. Generally I set my computer to UTC before uploading this program so that the logger runs on UTC. The arduino restarts every time the serial window is opened so do not launch the serial monitor when settime is running or you will create a delay offset in your clock time.
  • Open & upload getTime File/Examples/RTClib/gettime  (from the link provided above) to check that the RTC has been set. Expect about a 10-15 second offset between your computers time and that read back from the RTC, as a result of the time needed between compiling the code and executing it on the Arduino.

Note: After the time is set you can try to make a sketch that reads the temperature register from the DS3231 with the example provided by Coding Badly at: http://forum.arduino.cc/index.php?topic=22301.0   While the resolution of the DS3231 is a modest ±0.25C, I have been quite impressed with its overall accuracy when compared to other much more capable temperature sensors.

4. Test μSD card communication
Insert a microSD card into the carrier and test it with the CARDinfo utility at: https://www.arduino.cc/en/Tutorial/CardInfo  You will need to change the CSelect variable to pin 10, and I usually have to add #include SPI.h to get CARDinfo to compile properly. After uploading the sketch to the Arduino, information about card size, files, etc. are reported to the serial monitor reported if the card is connected.

Note: While CARDinfo is a very useful testing utility, it depends on the SD.h library that I almost never use any more. I much prefer Greiman’s SdFat.lib for loggers that are deployed as it uses less memory.

5. Test the Eeprom on the RTC breakout board
There is a utility to test AT style I2C eeproms posted by bHogan at http://forum.arduino.cc/index.php/topic,18501.0.html  Set the EEPROM address to 57 and the serial window will return written A through T and 33 through 48 if the eeprom is working.

Note: Because of latency delays, wear leveling, and other factors the SD card often uses a significant amount of the power budget for a data logger. Buffering your data to the eeprom is a good approach to improving your operating lifespan.  If you use page-writes, rather than saving data to individual locations in the eeprom you can store 28 characters of data with the same time delay as saving a single byte (a page is actually 32 bytes, but some gets used in coms overhead & for carriage return characters, etc.). So I think about that 4K eeprom in terms of “pages”, where my first 16 characters of the first page is always the time stamp: “YYYY/MM/DD,00:00”. That means if your actual sensor data only needs 10 characters of space you could store a reading in one “page” of the eeprom which would let you store 128 readings/pages in the 4K eeprom on the RTC board before you had to flush the data out to the SD card. If you have a fairly typical 15 min sample cycle (96 readings per day) you would be “waking up” the SD card less than once per day to write data, as opposed to 96 times per day. This kind of 100 to 1 reduction in SD card write events results in a substantial improvement in the performance of your data logger. I2C eeprom write cycles use about 3mA for 5-6 ms,  and this often keeps your arduino processor awake an drawing power as well (usually @ 4-5 mA). My tests to date with much larger 32K eeproms buffering five days worth of data have only lead to a 10-15% overall improvement in the power budget when compared to one day buffering.  So you do eventually reach a point of diminishing returns with the eeprom buffering strategy, but definitely take advantage of the eeprom on that RTC board if you can.

6. Test your other sensors
This will depend on which sensors you are using, and which libraries you have to work with.

Testing sleep current

7. The final and perhaps most important test is to check how much current the logger draws while it is in sleep mode. The LowPower.lib from Rocketscream is a good way to do put your Arduino into deep sleep modes. If you want to see that library in action, I posted a bare bones logger script for the UNO based logger tutorial on the project’s Github which will run fine on this build, and that is the most minimal example you are likely to find of logger that sleeps, wakes on alarm, takes a reading, and then goes back to sleep.  A typical logger built with Pro Mini form factor boards will draw between 0.20 to 0.25 mA depending on the attached sensors and how much sleep current your SD card draws.

A logger that sleeps just below a quarter of a milliamp usually runs for about eight months on a set of 3x AA batteries before falling below the 3.4v minimum for the voltage regulator.  If your sleep current is higher than that you should look at whether you have a bad SD card, or if you have a sensor breakout board has a voltage regulator wasting large amounts of power. Since you already have the pro-mini style board delivering regulated 3.3v, try to buy sensors that accept 3.3v directly on their pins so that you don’t waste power with other support circuitry.  Also try buy sensors that can be put into low current sleep modes easily. The really good sensor IC’s sleep automatically if there is no I2C bus traffic so you don’t even have to do anything for them. If you are using analog sensors, try to de-power any voltage dividers during sleep with a transistor or a logic level mosfet.

Also keep in mind that each AA cell in bank of three series cells can only go down to 1.15v before you reach the 3.4v minimum input for your regulator. If you look at alkaline battery discharge curves that implies that you are only going to have access to about 75% of the battery capacity. With 2000 mAh being fairly typical for a AA, that means you should conservatively estimate that your power supply will only deliver about 2000*.75= 1500 mAh. I usually get more than that from fresh batteries, and lithiums give you a slight boost because of their flatter discharge curves, but they also tank very quickly at the end of their lifespan, so be sure you check them before doing any SD writing.  If the power fails in the middle of a data writing event – you loose all the data on the card. 

Bumping these loggers up to 4x AA batteries in series should get you past a year even if your logger is on the high side at 0.25mA sleep current.

8. Program and run your logger

If you have made it through all the tests, then the next step is to run your logger with a basic bare-bones script and then when you are ready, you can dig into the other more complicated code builds from the project.  I’m not going to hold everyone’s hand through all that, however I will add that the content of these tutorial pages by Nick Gammon were immensely useful when I was starting out, and I still refer to them frequently:

    1. http://gammon.com.au/interrupts –  on AVR microcontroller interrupts
    2. http://www.gammon.com.au/forum/?id=11504 – on AVR timers and counters
    3. http://www.gammon.com.au/forum/?id=11497 – on Power saving techniques

Once you have digested that information, a good learning exercise would be to start with the bare bones script, and see if you could copy & paste only the parts that you need for your sensor out of the more complicated code examples. Keep doing that, one piece at a time, and eventually you will understand the entire thing. And there are plenty of other great datalogger examples out there if you Google around and many of them were created by people who actually know what they are doing, most especially the moderators at the Arduino.cc forums

With all that in mind, Part 4 of this series covers techniques for optimizing power consumption, but there is some more complicated coding, and trickier soldering, so its probably a good idea to build a couple of the basic loggers and get them running properly, before trying all the things in the final tutorial.

Arduino Pro Mini Data Logger : Part 2 : Logger Platform Assembly (2015)

Build Instructions Part 2:  Connecting core components on a logger platform

Note: In Part 1 of this assembly guide we covered the preparation of the three main components being assembled here. If you have not seen that page yet you should probably start there.

Batteries11. On a 4” PVC knockout cap, arrange your battery holders as close to the edge as possible to maximize room for other parts, without letting them hang off the edge. Mount them in place with double sided tape.


2. Join the black and red wires so that the three AA batteries are connected in series. Fold the solder join and the remaining red wire into the gap between the battery holders. Mark and drill 1/8” pair of holes to tied down the wires from the battery pack. Secure the wires to the cap with a zip tie through the holes.
Batteries2       Batteries3

standoffs13. Place the RTC alongside the batteries with one corner near, BUT NOT EXTENDING OVER the edge of the cap. Mark two places for the M2 nylon standoffs and drill 2mm holes through the knockout cap. Thread the standoffs through the holes and attach them to the platform with a plastic nut on the underside of the cap.


standoffs2

4. Place the RTC board on the standoffs and fasten it into place with the battery side down. Then carefully drill two 1/8” or larger holes near the cascade port of the RTC board and fasten the I2C bus connector cable to the platform. Leave some play in the wires to that they are not under tension when the zip tie is tightened

5. With the RTC mounted on the nylon risers, add a thin layer of solder to each of the connector pins on the end of the RTC board.

platform16. The next step is to use  double sided tape to adhere both the Arduino, and the SD card adapter to the platform. The SD card must not hang off the end of the platform (so it’s a good idea to do this step with the card inside the holder to see the spacing) and the Arduino must not extend off of the platform. Do not push directly on the metal part of the SD card holder or you could damage it.
platform2

7. Once the components are in place it is time to start soldering the SPI bus wires to the bent riser pins on the Arduino.  The trick is to hold the wire in place with tweezers, and trim each wire to length while still leaving a bit of play in the wires. Don’t cut them too short or you will not be able to solder the ends in place on the Arduino.

platform3With the colors we used on the SD card adapter earlier:

  • Grey wire is the spi CSelect line connect this to pin D10
  • Green wire is the spi MOSI line connect this to pin D11
  • Orange is the spi MISO line connect this to pin D12
  • White wire is the spi SCLock line connect this to pin D13

If you used different colors on the SD adapter board you will have to figure out which of your colors correspond to each SPI line and connect accordingly. (check the wiring diagram)  These can be left without heat shrink as they are tucked under other wires when the platform is completed, so an accidental touchdown is unlikely. Clean the joins with a Q-tip after soldering if there is a great deal of flux residue.

Cave Pearl data loggers8. Now pinch one of the GND wires from the Arduino and the ground wire from SD Card adapter together and hold them in place over the ground line for the RTC breakout. Cut them both to length, strip the ends and twist & solder both of the two ground wires together.


CutPowerlines29. Do the same with the red VCC wires so that the 3.3v regulated power line from the Arduino joins the VCC line and the power wire from the SD card adapter.

Using a pair of pliers to hold the wires in place so you don’t burn your fingers, solder the combined VCC and GND wires to the matching connector pins on the RTC


RTC connections10. Now bring the (white) A4 wire from the Arduino to the pin SDA pin on the RTC board. Trim this wire to length, strip, twist and tin the end of the wire. Then solder this wire to the SDA pin.
Repeat this process for the (yellow) SCL wire from A5, and connect the (blue) interrupt pin 2 wire to the RTC pin labeled SQW.


securedWires11. After drilling a couple of holes in the platform, secure the three Red Green and Blue wires from pins 4, 5, & 6 together with the second black ground line from the Arduino. Also secure the battery power leads from side of the Arduino board with drilled holes and cable ties.


LED connector12. Trim the LED wires to the same length. Strip and Tin the ends, then solder those the ends to the female side of a black WSD1241 Micro 4B plug in the order R,G,B-GND (with ground on the dimpled side of the connector).

As with the I2C connector pre load the pins on the connector with solder & thread the heat shrink over the wires first. Be sure you are using the female connectors on the Arduino side of these interconnects because they are the ones delivering power.

Trimpower313. The final step on the main platform is adding connectors to the battery holders and the Arduino input leads. Start by trimming the battery leads to a position about ½ way across the battery holders. These wires are can be fairly thin so reinforce their insulation with a few layers of heat shrink before trying to solder them to the pre-tinned battery connector posts. Before soldering these beefy connectors make sure the male side has been inserted so that the nylon does not soften and let the metal contacts inside shift around when you are applying heat. They really get hot during this process!

PWRcon1

14. Trimpower4Now measure the wires from the Arduino against the connector that is already in place on the battery holder side.  Use the same procedure of reinforcing the wires with 1/16” poly shrink wrap before connecting to the main power tabs and adding a final layer of 1/8” 3:1 heat shrink tubing over the connections.  The Arduino should be on the male side of the main power connector.

Test battery holderBefore trying to run your data logger from that battery module, it’s a good idea to test the battery holder connections with some AA batteries. If your 3x AA battery module is above the promini voltage regulator 3.5v minimum, you can connect the logger to see if it is still running the blink sketch. (provided you did not remove the p13 led)

At this stage the main logging platform is ready although the RTC clock has not been set yet.

Note: In Part 1 of this assembly guide we covered the preparation of the three main components that were used here. This post covered connecting the core components of the main logger platform, and in Part 3 we will cover mounting sensors onto the housing assembly to finish the data logger build. Part 4 covers techniques for optimizing your loggers power consumption, but some of them are more advanced so its probably a good idea to build a couple of the basic three component loggers before tackling everything there.

Arduino Pro Mini Data Logger : Part 1: Component Preparation (2015)

This logger is a combination of inexpensive pre-made modules from the open-source Arduino ecosystem, and can usually be assembled by beginners in 1-2 hours.

Note: In 2020, we updated the design to reduce the overall build time. We’ve also added support to the code for using the indicator LED as a light sensor, so you can start monitoring the environment with the logger right away.

https://thecavepearlproject.org/2020/10/22/pro-mini-classroom-datalogger-2020-update/

If this is your first attempt at making  a datalogger, then that new arrangement might be an easier place to to start than the tutorial set from 2015 shown below. The core components & their inter-connections are essentially the same.


The connection diagram for the Cave Pearl loggers follows this general pattern:

Note: This diagram uses the pin-outs of a Rocket Scream Ultra 8Mhz board with μSD adapter pin numbering convention per this document.  I like the Ultras as they use a more efficient MCP1700 voltage regulator, but the whole point of the design is that you can build one of these loggers with any 3.3v ‘mini’ style board you can get your hands on simply by matching the connections to the pin labels [ Figure from:  Cave Pearl Data Logger: A Flexible Arduino-Based Logging Platform for Long-Term Monitoring in Harsh Environments Sensors 2018, 18(2), 530; doi:10.3390/s18020530 ]

This tutorial will show step by step construction of that basic plan using the more common Sparkfun pro-mini style Arduino board, which has different pin locations than the Rocket Ultra but the connections are all the same. We will be assembling the logger on a plumbing test cap platform to facilitate placement in a 4″ housing made from plumbing parts:

Basic 3 component data logger with promini style boards

Note: A list of build parts & suppliers can be found HERE, and I will try to embed direct links into these instructions later.

Also Note: I posted a bare bones logger script for the UNO based logger tutorial on the project’s Github, and that is probably about the most minimal thing you can run on these loggers and it should be easy for folks to modify. To see a more developed code, with support for multiple different sensors,  you can dig into the other code builds for the project.

And Also Note: In 2016 I posted an alternate build of this logger that uses Dupont style jumpers. It’s cheaper, takes about 1/3 less time to build, and is much easier for beginners to assemble. However the connections are not as robust as a soldered build, so if you are willing to pay the “iron price” the one shown here is better suited to rough & tumble of real world deployments.

After assembling more than fifty of these loggers, it now takes me about 4 hours (not counting epoxy cure time) to go from raw parts to a completely functioning logger. However, experience teaching other people how to make them has shown that if you can get your first one together in about 8 hours, you are doing great. Especially if you have never soldered before!  The unit in the photo above was built with eBay parts for about $13, and the PVC housing in this tutorial will set you back another $8-10 (and not counting UART adapters, sensor breakout boards, or the tools you need like soldering irons or epoxy applicator guns).  There are plenty of simple loggers out there in the $30$60 price range for things like temperature, pressure, etc., so the only reasons to build your own are 1) because you are doing something that is not already available on the market at a reasonable price  (An example would be having your logger change it’s sampling frequency in response to interesting events: a feature like that is rare even at the high end of the market, though it is easy to do when you have access to the code) or 2) for the fun of doing it!  And don’t underestimate that second one: few things are as addictive as getting beautiful time series data from equipment you built with your own hands.

My wire color conventions are:
Red=positive power (both raw & regulated), Black=Ground, White=I2C Data, Yellow=I2C Clock, I usually use blue or green for interrupt signals, and other colors for the SD card SPI lines. I try to keep indicator LED leads the same color as the light they are controlling. I usually cut a bunch of 12cm wire segments and tin them all with a solder pot before starting a build. Adafruit has the best multi-strand 26awg silicone wire, but you can get by just fine with the 7-strand pvc stuff if the budget is tight.

Before starting:
Clean flux residue from breakout boards with 90% isopropyl alcohol. Ultrasonic cleaning  in alcohol for 2x five minute sessions (outside & away from sources of ignition!) works well but you can also do it by hand with a Q-tips, etc. Brand name boards from reputable vendors like Adafruit or Sparkfun are usually very clean, but cheap knock-offs from eBay will be covered with goop that is guaranteed to corrode inside your loggers over time. Do not use ultrasonic cleaning on parts that are sensitive to vibration,  like accelerometers,  or you could damage them.


Component Preparation:
Each of the 3 main components is prepared with riser pins & jumper wires before the whole logger assembly takes place.

1)   The Arduino ProMini style board

PinLayout11. Remove the limit resistor for the power LED to disable it. Usually you can’t see these indicator lights because they are inside your data logger housings, so disabling the them will conserve battery power.
I usually also remove the limit resistor on the pin 13 indicator LED, although on your first build you should leave it there for testing purposes.  My concern is that current drawn by the LED  (because limit resistors vary from one board to the next) might interfere with SPI communications to the SD card.

Riser Pins2. Solder the pin headers into place. Use two extra long pins for GND & RAW, and bend them 90 degrees under the Arduino board so that they protrude from the side of the board. Cave Pearl data loggersThese under board connections will connect with the battery pack, leaving the vertical risers from the GND & RAW pins available for the connection of a resistor voltage divider to monitor the battery. I usually bend on the serial I/O pins slightly away from the other risers, just to make a little more room for connecting the UART boards.

Cave Pearl data loggers3. At this stage it makes sense to bend and add solder to several riser pins. Bend digital pins 10-13 away from the main board for later connection to the SD card wires. Bend pin A0,  RAW & GND pins in toward the processor so that the battery voltage divider can be located above the board.


4. Then add solder all of the following riser pins to make connecting the jumper wires easier later on:

  • A0 & vRAW & GND   on one side of the board
  • Vcc (3.3v), the other GND pin on the far side (you can never have to many ground connections!)
  • D 10-13 where you will be joining the spi SD card jumper wires later
  • D 2-9 (you may not use all of them, but it is much easier to tin those pins at this stage than doing after the logger is assembled)
  • Sometimes I also tin the rest of the vertical pins in case I need to connect something to them later. This also depends on whether I plan on adding analog sensors to the logger.

Cave Pearl data loggers5.  A4 & A5 are needed for the I2C bus, but on pro-mini style boards these are somewhat inconveniently located wrt the voltage divider we use to monitor the main battery status.  Soldering a white jumper wire directly to the board at A4, and a yellow jumper wire to A5 allows us to breakout these connections. I usually strip, twist & pre-tin the wire ends before putting then through the board for these connections. Otherwise a stray bit of wire might not make it through the hole, and cause bridging problems.

6. Prepare two 4.7 Meg ohm resistors and 0.1 μF capacitor (code 104) as shown to form the battery monitoring voltage divider.  The idea is to have this divider fit neatly within the board footprint as you connect to the appropriate the riser pins. Solder the end with all three together at A0.

Cave Pearl data loggersCave Pearl data loggers

Be sure to use an ohm meter to find resistors with values as close to each other as possible before you solder them together. It’s easy to end up with two opposing % errors that throw off your battery reading even if they are from the same batch.

Cave Pearl data loggers

It is very important that there is an air gap between the RAW & GND leads of the voltage divider (on the right hand side), so that they DO NOT MAKE CONTACT with each other. This would short out your power supply! It might be a good idea to put some heat shrink in there too.

7. First solder the middle of the divider securely to pin A0. With that A0 connection in place, bend an ‘L’ into the lone resistor leg so that it lines up with the  vRAW pin you bent and tinned earlier (ie: the one closest to the serial i/o pins). Try to get this connection fairly close to the Arduino board to make some room for the ground connection which will go above it.  Then do the same procedure for the combined cap/resistor pin, soldering that onto the ground line riser pin. After the solder joints are in place, trim away the excess wire leads, being careful not to accidentally cut the riser pins.

Note: see this Jeelabs Post  for more information on this method to track battery voltage

8. With the board level soldering finished, give the pin solder connections a thorough cleaning with 90% isopropyl alcohol to get rid of any flux residue. After drying, waterproof the Arduino board with a coating of silicone conformal coating (or nail polish) being careful not to get any on the risers or the reset button. Let the coating dry in a well ventilated area before proceeding to the next step.  This coating is optional, but a good idea for electronics you are going to deploy in the field.

 At this point you will be soldering some 3-4 inch jumper wires to the pre-tinned riser pins. 26AWG silicone jacket wire from Adafruit is my current favorite, but any thin multi-strand wire will do.  I use thicker 20 or 22 gauge wire for the two battery power lines to make them more robust for the handling they see when the loggers are in use. Putting heat shrink over pin-jumper connections protects from accidental bridging when you place the logger platform into the housing. I advise that you use transparent tubing, as this makes it easier to spot a failed solder joint.  Clear milspec 1/16”/1.5mm polyolefin heat shrink tubing is an excellent option, as it becomes very stiff when it cools, providing protection from flexing and holding a ‘bend’ in your wires that can help with cable routing.

Cave Pearl data loggers9. On the side with the voltage divider add a red jumper to the VCC pin. This is the 3.3v regulated power line that will provide power to all of your devices & sensors. Then add thicker battery connector wires to the two bent pins extending from below the board. Cut all your jumpers to about 4 inches, and TIN THE STRIPPED WIRE ENDS BEFORE YOU TRY TO SOLDER THEM to the riser pins. Having both sides of the connection already covered with solder before you bring them together makes it much easier to get a good connection. A cheap solder pot can be picked up from eBay for ~$15, which makes the stripping&tinning process much faster. Use a good quality no-clean flux.

DigitalPinJumpers2 On the opposite side of the board:

GND:   Solder TWO black wires for the RTC & LED.
Pin 2:  Interrupt wire for RTC alarm line (Blue)
Pin 3:  Optional interrupt wire for certain sensors (Green)
Pin 4:  Red power line for the RGB LED
Pin 5:  Green power line for LED
Pin 6:  Blue power line for LED

BoardTape110. After applying heat shrink tubing to the joints (optional), apply double sided tape to the bottom of the Arduino, in two layers. Cut the first layer so that it fits in between the stumps of the riser pins on the bottom of the board. Peel back the plastic backing on that first layer and apply a second layer of double sided tape that extends to the outer edges of the promini board.


BoardTape2The Arduino is now ready for the logger assembly stage.

Note: This would be a good time to test whether the Arduino is working. Connect the pro-mini to a PC via a 3.3volt UART adapter and make sure that the ProMini board is selected in the IDE (Tools > Board > Pro or ProMini). You may have to specify the com port that your computer has given to the UART adapter (Tools > Port) and/or you may have to download a driver to support your serial communications board.

11. Run the Blink program (File > Examples > Basics > Blink) on Pin 13. Make sure to verify the program before uploading it. Assuming you did not remove the P13 limit resistor earlier, you’ll see the pin13 LED on the Arduino blink with one second intervals if everything is communicating properly and your Arduino is working.


2)  The micro SD card adapter

Four SPI signal wires will connect the SD card adapter to the Arduino board on digital pins 10-13. For these cut 2-3” lengths of four different colored wire. In this guide we used Orange, White, Green, and Gray wire. In addition, you will need red & black power wires, but these will not be routed to the Arduino. Instead they will tap the 3.3v regulated power and GND lines on the RTC adapter.

1. Flip the adapter board over and apply a thin coating of solder over each of the nine connector pads. Do not linger too long with the soldering iron making these connections, as heat conducted through the board may be enough to reflow the small contact springs soldered to other side of the adapter board. Usually if this occurs you hear a ‘snap’ sound while soldering. If this happens you may have to start over with a new board, as the adapter will not be able to make electrical contact with the inserted microSD card. I have found that the boards from Adafruit are reasonably resistant to this problem

SDAdapter12. Then add a 30 – 50K pullup resistor to the two pads at the end of the board. These connections are not used when the Arduino is accessing the card in SPI mode, but if you leave them floating some SD cards draw excessive amounts of power in sleep mode. Solder one end of the resistor to connection 1, bending it 90 degrees and laying the lead wire across the board to the other pad.  Be careful to route the resistor lead so that it does not come in contact with any other connection vias on your adapter board.  Fold the resistor along the cut edge and solder the remaining end to connection in the middle of the board (which is the 3.3v power line) I often put shrink wrap over the exposed resistor lead. I am probably breaking some rule tying the unused DAT1 & DAT2 lines together like this, but it has been working ok over several years of operation at this point. Use two pullup resistors for this if you prefer.

Cave Pearl data loggers3. The ground line needs to be connected to the SD adapter board in two places. Cut another 1” of black wire. Strip, twist and solder the black wires together on one end and solder that joined connection to pad. With the two-wire end in place, cut the short jumper to length for the second pad, then strip and tin the wire end before bringing down to the other ground line pad. Note: Many of these uSD adapter boards already have the two ground pads connected with an internal jumper. In fact the one in this photo did, but I simply forgot to check for that with a meter before starting this tutorial.

4. Add a red jumper wire to the pad in the center of the adapter with the pull-up resistor, being careful that you don’t unseat the pull-up resistor lead in the process. Then solder the remaining jumper leads in place.  For this guide I have used:

  • Cave Pearl data loggersOrange at pad2 will be the spi MISO line and will connect to D12
  • White at pad5 will be the spi SCLock line and will connect to D13
  • Green at pad2 will be the spi MOSI line and will connect to D11
  • Grey at pad1 will be the spi CSelect line and will connect to D10
  • Black at pad6 with extra tail to pad 3, this will connect to the RTC GND pin
  • Red at pad5 (with pullup resistor), this will connect to the RTC VCC pin

Cave Pearl data loggers5. After the wires are soldered into place, clean away any flux residue with 90% isopropyl and let it dry. Be careful when applying silicone conformal coating to the soldered connections, as it may run to the other side of the board and coat the sprung SD connection springs, and prevent electrical connection. Make sure to dry it with the holder side up to prevent any liquid from getting inside the card holder. After the coating is dry, apply double sided tape to the SD card adapter.

Addendum:

pullups added to the SD card holder

Here is an example of the SD adapter modified with 30K pullups resistors on  CS, MOSI & MISO. I used 1/8 watt metal films because their small size makes it easier to squeeze them in

Reliable sources recommend pullups on the SPI lines, though I have been running my loggers for a long time without them.  I have noticed that some SD cards take a really long time to go to sleep unless CS, MOSI & MISO are pulled up, and some just refuse to sleep at all without the pullups. These weak pullup resistors are not described in this tutorial, but I suggest that you add them to your builds to sort out this problem with some cards.

If you already have loggers built without them, there is a workaround using the 328’s internal pull-up resistors that I current have in testing.  Despite the fact that only CS requires it, I found that all three lines (w MISO set to INPUT not output!) had to be pulled up before misbehaving cards went to sleep properly. So add these lines to the beginning of your setup before you run sd.begin

// pulling up the SPI lines at the start of Setup
pinMode(chipSelect, OUTPUT); digitalWrite(chipSelect, HIGH); //pullup the CS pin
pinMode(MOSIpin, OUTPUT); digitalWrite(MOSIpin, HIGH);//pullup the MOSI pin
pinMode(MISOpin, INPUT); digitalWrite(MISOpin, HIGH); //pullup the MISO pin
delay(1);

I found that enabling these three internal 20K pullup resistors raises sleep current by between 1-5 μA, so it should not hurt your power budget, and could potentially save far more power by helping your SD cards go to sleep much faster.  It’s worth noting that there is some debate about the necessity of this approach. Because SPI is a complex  protocol, there are situations where adding physical pull-ups could actually interfere with other SPI sensors on your data logger, and in that case the internal pullups provide a more flexible option.  That is one reason why I tend to stick to I2C & analog sensors on my builds, so the SPI lines are dedicated to the SD card.


3) DS3231 RTC Breakout board

These cheap DS3231 boards usually arrive with quite a bit of flux residue that you may need to clean off of the board.  There might also be a plastic tab on one end that can be removed.

RTCresistors2remove1. This board has a lithium battery charging circuit that can be disabled by removing as small surface mount resistor (201) on the right side of the board. The LED power indicator can be disabled by removing the (102) limiting resistor on the left side of the board.

Cave Pearl data loggers2. The I2C lines that we will attach to one side of this breakout board are provided on cascade connectors on the other side of the board with 4.7k pullup resistors already installed on the SDA and SCL lines.  To that cascade connector solder 4” lengths of Black, Red, White, and Yellow wire on the GND, VCC, SDA, SCL respectively, so that they emerge the battery side of the board. Leave a few mm of wire protruding from the solder joins, as these provide convenient attachment points for an I2C EEprom if you wish to add that later.

I2C connectors3. To the end of these four jumper wires add the four pin red WSD1242 Micro 4R Plug.  Note the pattern used with the black GND wire on the dimpled side of the connector. (pattern: Y-W-R-Bl) Place the connector in a vise with the other side of the connector in place to prevent the pins from shifting when the thermoset plastic gets hot. Pre solder each pin, then cut, strip and tin each wire end BEFORE you try to join the wires to the pins. Thread the heat shrink tubing over the wires before you solder to the pins.  BEFORE joining the wires to the connector in the pattern shown check that the female side of the connector is being soldered to the wires from the RTC.

As a general rule I always solder connectors in such a way that the side that is providing power is female. That way even when the connector is ‘live’ there are no exposed pins that could short out if the connector accidentally comes in contact with a metal surface.

Also note that there is nothing special about the Deans micro plugs I am using here, they are simply my current favorite after testing many others on the market. They stay secure with a good deal of knocking about, but at ~$1.50 per pair they are also pretty expensive,  so feel free to substitute different connectors for your build. Dupont crimp connectors are much cheaper, and I used those successfully for quite a while before switching over to the Deans.

RTC34. Cover the IC side of the breakout board with a thin layer of conformal coating and insert a fresh CR2032 3V coin cell battery.


At this point the three core components of the logger are ready for the assembly stage. In Part 2 of the build instructions, we will cover connecting these parts together on a flat platform with the battery holders. And in Part 3 we look at assembling a waterproof housing. Part 4 covers techniques for optimizing your loggers power consumption, but some of them are more advanced so its probably a good idea to build a couple of the basic loggers before tackling the material in that last post.

Interview: Cave Pearl Project Team: 2015-09-20

Now that we have recovered from the last round of fieldwork, I finally managed to blow the dust off an old Macintosh in the basement and produce a little promo for the project:

Still needs some polish, but not bad for a few quick clips in the living room. My next task is to update my “How to build a data logger” posts to include all the new improvements.

Addendum 2015-08-24:

The new build series tutorials are now live to help folks get started.

<— Click here to continue reading the story—>

Modeling the Effect of Drag Enhancement on Water Flow Measurements

Float configuration deploymnet on new housings

A float configuration deployment with flag on one of the deep saline units.

In March we did an experiment by adding small flags to some of our flow sensors to enhance their response in low flow situations. As with so many of the things we have tried on this project, these thin sheets of ABS were the best solution I could come up with that would (1) flat pack into our luggage and (2) be assembled in the field with zip-ties. One of my pet peeves with commercial equipment is that much of it fails the suitcase test, which can be an  important part of trip logistics.

Now, I’m not even going to pretend I have the kind of skills it would take to estimate drag on those fins, which present a progressively smaller surface as tilt angle increases.  In fact, I probably know less about math than I knew about electronics when I started this project. So everything that follows here is just me just muddling through like always.  If you actually do possesses those skills you should probably look away now. I’d hate to be responsible for another academic drinking themselves into oblivion, while muttering about the internet being taken over by monkeys.

Without an expensive accoustic dopper unit to calibrate against, the best we could do was develop an empirical relationship between the new design and old ones.  So we installed one of the “enhanced” flow sensors beside a similar unit with no flag. Comparing the two data sets would show us how much the flag was increasing the sensors response to water flow.  Since we had no idea what that low end amplification would actually turn out to be, we used a tidally controlled coastal outflow that went from zero flow to peak velocities above 10 cm/s twice a day.

Fortunately, a good storm passed over the system right in the middle of the deployment: pushing that range even farther (probably to about 20 cm/s)Here is a small snippet of data covering that event:

Comparing the drag enhanced, vs the standard configuration
My first impression was that the boosted diurnal response looks like the kind DRC plank that smacks you over the head whenever you turn on a radio these days.  The low end is being boosted by a huge amount, in fact, just before the event there are some spikes in the flagged data there that don’t don’t even rise above the noise floor on the “naked” flow sensor.  Just looking at those tells me we had between 3-4x more signal at the low end. But how do I quantify that?

I started with a plot of the two sensors against each other, which showed a sharp point of inflection: Flag vs No Flag_withExcelFitLine
Note: Logger #012 had the drag enhancer attached, while C4 had no flag.  The loggers bodies themselves presented very similar, somewhat spherical, profiles to the water flow.  My newer builds are cylindrical, which opens another whole can of worms.

I was happy to see that the low end boost looking so linear and I wondered if that elbow was some kind of turbulent flow transition. Who knows, perhaps when the loggers approached sixty degrees  the fin even starts to contribute some lift. (?)  But in terms of relating one units response into the other, even I could see that Excel’s trend line was terrible. You can do better with the solver plug-in, but you have to know the equation you want to use first. If you don’t know what the formula is, it can be a tedious process to figure one out from scratch.

So I went looking for something that would give me a better way to model that relationship. That plot looked like a distorted “S” shape, and google image searching lead me to the entries on logistic functions of the form:  f(x) = a / (1 + b c –x)   These sigmoidal curves start out with a low slope, which increases to an inflection point, then levels off as they approach a maximum value. They pop up frequently in natural systems when people try to model population/cell growth, or EC50 dose response. The Gompertz function was a long-tail variant that also looked like a good contender.

First pass with Eureqa

First pass with Eureqa: meh!

While I was digging through all that, I came across references to a statistical modeler called Eureqa that was developed in Cornell’s creative machines lab a few years ago. I’d seen mention it before in the geek press, but this was the first time that I had a situation where it might be useful to me personally. So I downloaded their free trial version and day-am!  This slick bit of code made me feel like a ten year old who’s been left alone in the cockpit of some large piece of earth moving equipment that still has the key in the ignition. Clearly this was a tool for real scientists, and I should probably wait for that adult supervision. But…well…I’ve been failing that kind of marshmallow test for quite a while now.

And I didn’t get much out of it at first, but after going over their tutorials I found it was fairly easy to change the generic y=f(x) starting point to any model you want. This lets you can derive arbitrary constants from a really disorganized lump of data without having to do all that grunt work in Excel.  I did a couple of runs with the Logistic function, and with the Gompertz curve:

Modeling with Eureqa, starting with Logistic and Gompertz functions

Note: the functions specified with empty brackets: f1(), f2() etc. force the solver to put a constant at that location

My raw data did not really have (0,0) point due to sensor mounting offsets, and the loggers never went beyond 75 degrees of deflection. But I found that by adding an arbitrary point at (90,90) I could move the upper asymptote away from that bulk at the top end of the plot. After seeing the improvement from that change, and after deleting a few outliers, I let Eureqa take another shot from the default y=f(x) starting point:

Eureqa_TweakedPass2

It's turtles all the way down!

Turtles all the way down…

Now that’s starting to look better, and I was not selecting the very “best” solution according to their fit metrics. If you leave the solver running for a long time (say, while you go have dinner…)  it  just keeps chugging away, adding coefficients until you have something large and ugly. But I am sure that if I actually knew what I was doing, the correct solutions would jump right out at me. The press often overlooks this critical step with their hyperbole about Eureqa “replacing” scientists: the real world is not a simple pendulum: it’s a warm, squishy, mess that involves a lot of value judgment.

More electrons will give their lives as I burn through my 30 day trial. It’s too bad Nutonian wants $30/month for their cheapest license. If they went with the WordPress model (ie: $30 a year for the little guys) I’m sure every maker in the world would be using this software to sort out one-of-a-kind build issues like this.  Of course, I’m not sure this exercise actually taught me anything about the physical phenomenon involved. But if blindly applying complex, statistically derived equations is good enough for Wall Street, then it’s good enough for me. What could possibly go wrong?  🙂

And…Happy Birthday to my brother Mike!
As a seasoned Linux system bender, he was one of the first people to bring the Arduino / Open Source Hardware phenomenon to my attention.  And he is also someone who knows how absurd it is for me to post on anything mathematical.  


Field Report 2015-08-17: Flow Sensors go back into Akumal Bay

The surfaces were covered with hard deposits

Even after scrubbing, those surfaces were still covered with hard deposits. I wonder if hydrophobic paint would prevent this?

With the the dive deployments done, and the Rio Secreto installation out of the way, it was time to start wrapping up the trip.  Sometimes we are forced to leave the open water flow units with Gabriel at C.E.A., but he had important meetings that morning and I had enough time on to install them on my own. As we talked about potential sites for other units, I laid out the loggers, cables etc. on the table. He was somewhat  surprised to see the condition of the older units.


Treating Ocean units with muriatic acid

Nothing like a good hydrochloric acid bath at the end of a long deployment.

You see when we retrieved B3 & B4 at the start of the trip, months in the sea had coated them with so much bio-growth that they looked like something from “Pirates of the Caribbean”.  On previous trips, hard scrubbing and bad language were enough to sort them out, but after that failed I knew we were going to need bigger guns. After googling my way through a few chemical resistance charts, we popped down to the hardware store for a bucket, and bottle of muriatic acid. And as we hoped it was highly effective, but I was biting my nails as we watched the loggers, and the data they still contained, fizzing away like seltzer tablets. Fortunately those EPDM O-rings held up, and after a few hours in the soup, I was finally able to scrub away the crud and get to our data.  I did my best to keep the sensor wells away from the acid, as the epoxy there was already getting pretty old.

So by the time I was ready to swim out into the bay, our flow sensors had gone through something of transformation:

B4 before & B4 after

B4 before                                      &                                 B4 after

I spent a fair bit of time locking down a new anchor plate for B3, with sea urchins and rolling surf conspiring to make that a challenge. And I don’t know if it was the fact that I was further out on the reef, or that I just did not move like the tourists, but I swear critters came of the woodwork just to see what I was doing.  The barracudas were probably drawn in by the shiny metal surfaces on the camera, and at one point, while I was busy looking down to capture some clips of B4 in motion, a sea turtle swam right into me. I know it sounds funny, but an impact from something that big when you are floating in the sea can really scare the willies out of you.  When I spun round to see what happened, there were three more beside me (…probably doing the turtle equivalent of laughing…inside…)  But by this time the loggers were installed, and I was too worn out from all the swimming to spend any time watching them.  Reluctantly, I headed back in.

Of course, things always happen when you are not looking for it, and as I made my way to shore I noticed a spotted eagle ray swimming nearby.  I was in the boating lane at the time, and decided that trying to capture a photo was not worth getting run over, so I just kept going. However, once I reached the shallower sandy area, he reappeared right under me, and this time I dug the camera out of the mesh bag I had been using to ferry the loggers around:

…and I think I will use that to sign off on a brilliant fieldwork trip.

Addendum

By the end of all this, my field-notes went over 50 point-form pages of observations, readings, etc., and there is no way I could relate more than a small sampling of that here. Once the major diving is done, we try to grab a little social time with friends as we drop off various bins of gear to be stowed till next time.  Trips like this could never happen without the help of the dive community in Tulum, and we are grateful for all the help they have given us over the years. Of course a proper list of thank-yous would be even longer than my field notes, but I’d like to give a special shout out to Bil, Robbie, Kim, Natalie, Jeff and Gosha. I hope some of this blog-y catharsis makes you laugh, and some of it makes you proud, because you are all an important part of it.

Cheers!

<— Click here to continue reading the story—>

Field Report 2015-08-14: Install New Sensors at RioSecreto

Ready for Next Deployment at Rio

The next batch is ready to go!

Sensor failures & battery leaks meant that I had to rebuild some of the drip loggers retrieved last week, in addition to loading all the units with the latest code tweaks for sensitivity, buffering, etc.  Because the latest loggers have improved so much, Trish keeps telling me to retire the mixed bag of first-gens. But the maker geek in me just can’t resist the urge to give those aging units another run just to see how long they will last. (perhaps there’s a bit of self identification there..?)  I’ve heard some of my coder friends refer to this kind of thing as a one tweak loop; often in association with tales of corporate disaster. Fortunately, the hard time constraints of fieldwork are more than enough to curtail my mild O.C.D because when deployment day arrives, you either have it in the bag or you don’t.

The First Masons hygrometer sitting in a cluster of drip sensors

The first hygrometer, located in a cluster of drip sensors, with the “dry” bulb in the foreground, suspended far away from drip sources.

And this time round we had more than twenty units going in. This was the reason that Trish & Fernanda had done so much surveying on our previous day at Rio Secreto. While they were taking measurements, I joked with Trish about playing Goldilocks in a chamber that was literally heaving with beautiful stalagmites, but the truth is picking a good one that doesn’t introduce a sampling bias, is a heck of allot more challenging than you might think.  I left her to sort that out and do the manual counts,  because I was so keen to get the two Masons hygrometers installed.  I’m hoping that the DS18’s can deliver another success, like we saw with the underwater temperature strings.

WetBulb ConfigurationThe key to this approach is that the  wet bulb is hydrated by the run-off from a drip sensor station, hopefully allowing us to operate for long periods of time at these unsupervised locations. So those DS18’s have a very long wick wrapped around the rim of a drip logger with a cable tie. Encouraging evaporation like this is probably going to cause some mineral deposition, and there are a dozen other problems  listed in the textbooks.  But I am going to give it a shot anyway because there are few things as satisfying as discovering something you’ve built actually works, when authoritative sources say it won’t.

This SHT-11 RH sensor is deployed beside the Masons Hygrometers

And we also have a new SHT-11 humidity logger installed nearby.  The sensor itself is the soil moisture rig from Seeed, with a copper sintered mesh over the sensor that could ‘theoretically’ withstand full immersion. I tried to suspend the sensor head so that random drips from above would be deflected away, but even with liberal amounts of silicone on that breakout, I’ll be happy if we get a month of clean data from it before it suffers the same fate at the HTU21D’s we tried earlier. That ought to be enough to calibrate the Masons.

This unit detects drips down to 12cm drip fall

Once we had the new toys in place, we could finish placement of the drip stations.  A couple of the older stations suffered repeated knock-overs, so we decided to relocate those. One of the new sites was near a beautiful pancake-stack formation, but it only had a 12cm drip fall. That’s a very small amount of kinetic energy for my sensors to detect, and I watched this unit for 30 minutes to make absolutely sure the logger was picking it up.  Though the drips made no sound at impact, the indicator LED was piping OK.

The new rain gauge loggers on their first real world installation

The new rain gauge loggers on their first real world installation.

We wrapped up the day by putting the new logging rain gauges on the roof of a building, beside our solar shielded pressure/temp/r.h. sensors. My hope is that those funnels give us a more quantitative record from the little drip sensors in the base, in addition to protecting them from that merciless tropical sun.

Several people have pointed out to me that weather stations are getting pretty cheap these days, and then asked me why I don’t just use something off the shelf.  Generally, I just get a weird look when I reply: “Sure, but where’s the fun in that?” Fortunately for Trish & I, the people at Rio Secreto understand, and they have allowed us to use a corner of their amazing cave once again for the project.  Thanks again you guys!

<— Click here to continue reading the story—>

Field Report 2015-08-12: Success with DS18B20 1-Wire Temperature Chains!

OMG! It worked. Woot!

Yep, that’s me grinning like a fool. It might not be an X-prize, but it worked! IT WORKED!

We were already happy with the flow & drip sensor data from this trip because, despite the TMP102 problems, most of the units had performed brilliantly.  But for me, the real prize of the season was going to come from the underwater temperature strings that began their first ‘real-world’ trials on the last trip. Because the cave they were in presented some challenges, we didn’t pull those units until we had a few good dives under our belts. Back in March, I had just changed over to slimmer builds in 2″ PVC pipe,  and the flow meters at this site were the deepest deployment so far for those new housings. So every unit in this cave was testing something important, and I hoped to take plenty of photos despite the fact that we were right at our little cameras limit.

Trish had line duty (for this part of our dive), and she captured a reasonable shot of me inspecting first flow meter from there. Though I had only been at the sensor for a few moments, you can already see a ball of dust starting to form overhead:

After that we installed a new ceiling anchor, with a descender rod to put a Pearl in the deeper saline flow.  Unfortunately, all that faffing perc’d out the site, so I only managed a tiny clip of one temperature string in-situ before the cloud of pea soup drifted over:

That logger supported a fairly short 5m sensor chain, with 19 nodes spaced at 25cm. It was installed across the halocline, and I admit that I was concerned that (with a minimum increment of 0.06°C) those humble DS18B20’s would not have enough resolution to track the fresh/salt water interface. In addition, I had assembled the string in segments that were linked by my new diy underwater connectors, so these builds had more potential failure points than I even wanted to think about.  It’s probably a good thing that that our dive schedule was so full that I didn’t have time to look for LED heartbeat pips while we were still under water.

Following that long dive, we had a bumpy crawl back to the main road which put more than a few new scratches onto the rental car. After one bone-shaker, Trish observed a logger going through it’s startup sequence on the indicator LED.  A power blip like that during an SD write could toast the card, destroying all our data!  I asked her to cradle the new babies till we got back to the paved highway. When we reached Tulum, we returned our tanks, stowed the gear, and bolted down a couple of tacos in record time. I might even have exceeded the speed limit a bit on the way back to the room…

But after some tough dives, and months of waiting, this was the result from #045:

Cave Pearl data loggers - DS18b20 Temperature string
Note: I inverted the temperature axis (left side) to match the physical situation: the saline water was warmer at depth, with a cooler fresh cap layer. The black traces are 96 point (1 day) moving averages.

The deeper saline water was a full degree warmer than the shallow fresh water, giving plenty of spread for the DS18’s.  And with 25cm spacing we managed to plant one sensor right in the middle of the halocline, capturing its cycles of expansion and shearing away. And that’s just the raw data!  Even without the calibration corrections it was easy to see that we nailed it. Unit #046 gave an equally complete log, but with its larger 50cm spacing the sensors straddled that fresh/salt boundary, so we simply have an empty gap on the plot. Of course to a karst hydrologist, knowing the limits of mixing zone is also useful information

After the initial excitement over that temperature data died down, I proceeded through my usual set of post deployment checks. I was keen to compare the power curves from the two loggers we had deployed:TempLoggerPowerCurves

I knew those sensors were going to pull a substantial amount of juice during 12-bit conversions, but putting twelve AA batteries in the housing was still something of a shot in the dark for me back in March. While both curves looked smooth , there was something odd about #046 using less power than #045, because it had one more sensor (total of 20) and they were stretched out over 10 meters of cable so #046 also had a more aggressive pull-up resistor on the bus.  A bit more poking around and I noticed that I had accidentally reversed a cell in one of the banks  (those with sharp eyes probably  spotted that in the photo above) so #045 had actually run on only three sets of AA batteries. Shottky’s isolate each bank against battery failures, but it’s nice to know that they also protect the little loggers from my own dumb mistakes. With 46’s full complement of 4x3AA batteries only loosing 0.5 v over almost four months, I’m confident these loggers could approach my one-year operating target on a fresh set.

The marine heat shrink tubing adhesive after four months

After four months under water the adhesive on that marine-grade heat shrink looked a bit flaky, but there is ECL30 potting the wires inside the adapter so I’m not worried about the seal.

Of course that’s predicated on everything staying water-tight, so I examined each temperature sensor very carefully: looking for evidence of water damage. Most of the nodes were filled with hard epoxy (E-30CL), and for some I was trying out a more flexible urethane. (U-09LV )  They were all remarkably clean, with only one node showing yellowing, and that one was a botch where I had split the original sheathing under the heat gun, and had to re-wrap it. I was also pleased to see that my DIY underwater connectors proved to be robust. They were all were bone dry inside, with no hint of oxidation on the contacts. It was looking like we would be able to re-deploy these units right away!

While I was examining the hardware, Trish had been chewing on the data from both of the loggers. At one point she started making funny “Hmmm…” noises which I know she only makes when she disagrees with something, but is being too polite to say so.  (You hear that kind of thing a lot at academic parties…)  When I asked her what was wrong, she showed me the pressure log from one of the MS5803’s:

045_PressureLog

Damn! Even with surface barometric corrections it was obvious that the rising trend in this record was out of sync with our other water level recorders.  And with 1 millibar of pressure being approximately equivalent to 1 cm of water depth, the implied 4m delta is simply ridiculous. I immediately suspected that the Qsil 216 I had put over the pressure sensor was doing something weird. I’ll need to do some homework to sort out what actually happened, but I’m guessing the silicone started absorbing moisture at depth since the stable cave environment is unlikely to cause problems from thermal expansion.

#046 was ready to roll the next morning.

#046: ready to roll the next morning.

So we didn’t get a hat-trick on these first builds, but by 2 am I had new batteries in place, the clocks updated, and I had carefully peeled away the silicone over the MS5803s. (hopefully without damaging the factory gel caps). If the overnight run looked good, we hoped to install #046 in deeper cave (~24m) the next day.

<— Click here to continue reading the story—>

Field Report 2015-08-10: Diagnosing a TMP102 Temperature Sensor Failure

Over the next few days we did cave dives to exchange units at sites along the coast. Some of these systems were too deep for our camera, and in the shallower systems the visibility could get a bit grim because if you stay in one place too long, air bubbles rise up and cause “percolation” of little pieces of rock from the ceiling.  So to dismiss any illusions people might have that science diving looks like what they show you on TV, here’s a clip from one of those claustrophobic installations:

Even so, things went well.  Each night I had a new crop of loggers to download and check for my “standard set” of parameters (battery, RTC coincell, sleep current, clock drift, etc.) which I compared to the readings taken before the deployment. The recent retrievals were from the last generation of 3-inch pvc builds, and while they all looked great on the outside, some of them stopped running long before we pulled them out. It can be tricky to figure out the problem when a logger has several I2C sensors on it because the very things that make it so easy to use those breakout boards, also hide problems from you: essentially they don’t just run digitally, they also tend to die that way.  Issues tend to show up much earlier in the analog data, and one useful diagnostic is the voltage log from the main battery pack (read with a simple resistor divider).  Alkaline AA’s usually provide a nice smooth decline over time, so when I see something like this:

011_PS&Temp

Unit w BMA180, TMP102, HMCL5883l. Deployed in fresh water at 5m.

…it’s an immediate red flag.

But unit #011 had a complete set of data logs, with no hint in the sensor records that something strange occurred.  That peak in temperature was pretty large, but it also corresponded to the June 13/14 event that showed up my Rio Secreto & Akumal Bay records, so I accepted it as valid data.  My next thought was that the unit had suffered a μSD failure, but this logger was still successfully going to sleep at a reasonable 0.26 mA. Rapidly entering a low current sleep state is the best indicator I’ve found so far that a card’s control circuitry is still working as it should. Hmmm….

Then next unit with problems was also from a relatively shallow fresh water deployment, and it ran for only two weeks before shutting down:

BMA180, TMP102, HMCL5883l, Deployed in fresh water at 14.5m Depth

Unit w BMA180, TMP102, HMCL5883l.  Deployed in fresh water at 14.5m.

Leak corosion after sensor failure drained the batteries

The power module from #015:  alkalines almost always leak if something pulls them below 0.5v.

This logger was positively pressurized when I broke the seal, with only 0.22 volts at the battery module. When I connected a new battery the unit would did restart properly, producing a strange pattern on the indicator LEDs. Fortunately even with only two weeks of data, what we did have in the log make it pretty clear who the culprit was. It was extremely unlikely the temperature would have spiked like that on the same day that the battery curve took a nose dive.

The next unit presented another mystery, because it had a nice smooth power curve though it had reached it’s low voltage shut down point too early. The temperature data looked reasonable:

Unit w BMA180, TMP102, HMCL5883l. Deployed in fresh water at 22.5m Depth

Unit w BMA180, TMP102, HMCL5883l. Deployed in salt water at 22m.

These loggers have dual 3xAA power packs, and they normally deliver at least eight months of operation. While #016 seemed to restart OK, with a normal (~o.24mA) sleep current, it then crept up to 1.65 mA.  I left the unit running for about 5 minutes and by that time the sleep current was jumping all over the place, varying from 0.5mA to 4 mA at random. This behavior continued after I swapped in a known good SD card, so I was stumped. Once again the data in the sensor logs looked fine.

I had one more unit from this build generation to open up, and it too had developed a problem over the deployment:

017_PS&TEMP

Unit w BMA180, TMP102, HMCL5883l. Deployed in salt water at 24m.

No rust at all...?

I have to trim the boards a bit to fit them in the sensor wells but I am careful not to cut any traces or vias. There was no visible rust on those breakouts at all.

That hockey stick bend on the power curve was another smoking gun, especially in the context of that temperature data. The deep saline water in these caves is remarkably stable, so when I saw a temperature rise alignment like we had with #015, I started pulling wires. Sure enough, the sleep current problem on #016 disappeared as soon as the TMP102 was disconnected and #015 fired up properly as well.

Since epoxy failures took out a fair number of units in 2014, I did a detailed inspection of the potting, but found nothing to indicate that water had reached the sensors. Since the deeper units were most affected, my current working hypothesis is that these sensors were actually suffering from the effects of pressure, rather than moisture. (…but good luck finding that in your ‘Recommended Operating Conditions’)

Anyway, I disconnected the TMP102’s from all the loggers of that generation, (including the ones that were still working…) and set the code to read the internal RTC temperature register instead. Test runs with that were good, and these units went back out for deployment a few days later even though all that housing mass will put a huge lag into the temperature record.  I don’t think I will be using TMP102 sensors again on my projects, but of course there is nothing to say the MCP9808’s from Adafruit won’t develop a similar problem over time.  So I might end up back at the humble DS18Bs which I used on my earliest builds:  they have proved to be remarkably resilient over time.

Addendum 2016-03-17

The MCP9808’s did indeed suffer a similar fate.