
Build Instructions – Part 3: Sensors & Housing
Note: This is the third tutorial in a series providing detailed build instructions for a DIY data logger based on a Pro Mini style Arduino board. Part 1 of this series covered preparation of the 3 core components for assembly, and Part 2 described connection of those components into a functioning logger. If you are landing on this page for the first time, it might be a good idea to start at the beginning of the series.
Status indicator: common cathode RGB LED
1. Test the common cathode LED with a 3v CR2032 coin cell battery by connecting the GND (usually the longest wire) to the negative side of the battery and each other wire to the positive side of the cell in turn. Note which lead is for red, green, and blue. Usually the red lead is the one closest to the FLAT side of the led, and the ground pin is the longest lead but there is variation between manufacturers, etc.
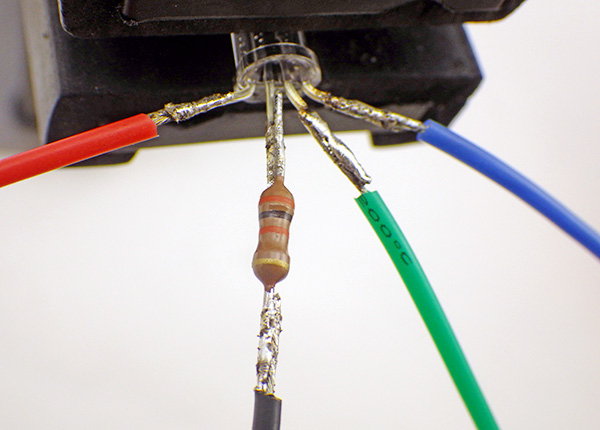 2. Trim and add a 30 K ohm limit resistor to the GND line. On some RGB LEDs, green is 2-3 times brighter than the other colors, so you can add a second 20-30K ohm resistor to the Green LED line if you power budget is tight, although this will make the green indicator hard to see in full sunlight.
 3. Cut 4” lengths of Red, Green, Blue, and Black wire. Solder them to the respective LED connections and use shrink wrap to protect the joins. Carefully bend the leads to a 90 degree angle to facilitate mounting in the housing cap later.
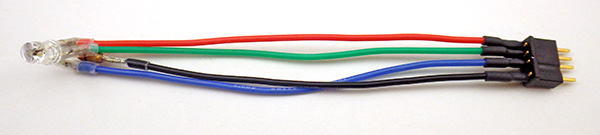
 4. Trim the LED wires to the same length, then strip, twist and tin the ends. The LED wires will be connected to the male side of a black WSD1241 Micro 4B plug connector, maintaining the same R, G, B, & GND pattern used on the corresponding logger side connector. Make sure that the other side of the connector is attached while you are soldering so that the plastic doesn’t melt out of shape.
You can connect and test your completed LED with your logger platform running the Blink sketch, by replacing the default pin number 13 in the code with 4, 5 & 6 respectively.
I2C Sensor Breakout Boards
Many sensors are available on I2C breakout boards. This guide shows pictures of several including an Adafruit MCP9808 temperature sensor and a MS5803-05 pressure sensor, but the four standard bus connections (VCC, GND, SCL & SDA) would be the same for any I2C sensor and they all get connected in parallel. The DS3231 RTC breakout board in this build puts 4.7k pull-ups on the SCL & SDA lines that we tap at the cascade port. So if you are using multiple sensors you may need to remove the pull-up resistors from some of your sensor boards because those resistors also end up in parallel, and this can place too much pull on those bus lines for the sensors to overcome. If you are only adding one sensor to your logger, you can usually get away without bothering to remove them.
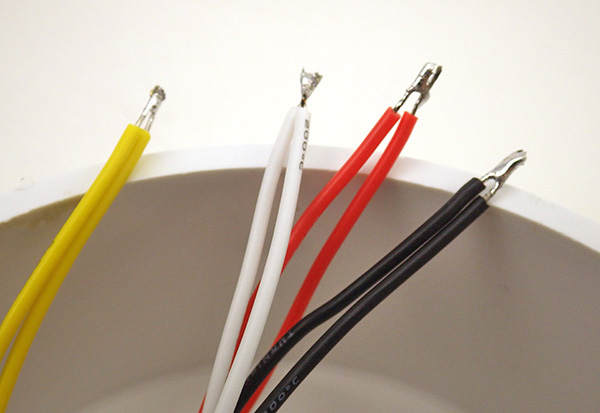
 1. Cut 3-4” lengths of Red, Black, Yellow, and White wires. Strip, twist and solder those wires to red=VCC, black=GND, yellow=SCL, and white=SDA holes respectively. I find that this is much easier to do with the board in a rubber footed panavise, and the wires supported by ‘helping hands’. Where space is limited, I sometimes mark the wires with a sharpie so I can keep track of which leads go to which sensor from the underside of the pvc cap.
2. Trim and clean the soldered side of the board with isopropyl alcohol to remove flux residue. Trim the free ends of the wires to the same length, and strip & tin the ends. We will be adding a 4 pin deans connector later, but for now leave the ends of you sensor wires free. The sensors will be tested once the wires are inserted through the housing cap, and after the sensors pass the testing stage the connector will be attached to the leads
Mounting sensors on the housing
This part of the build should be done in a well ventilated area (ie: outside or in fume hood if you have one) as pvc solvent fumes are toxic. Make sure your sensor boards have been completely cleaned of any flux residue with q-tips and 90% isopropyl alcohol before potting them!
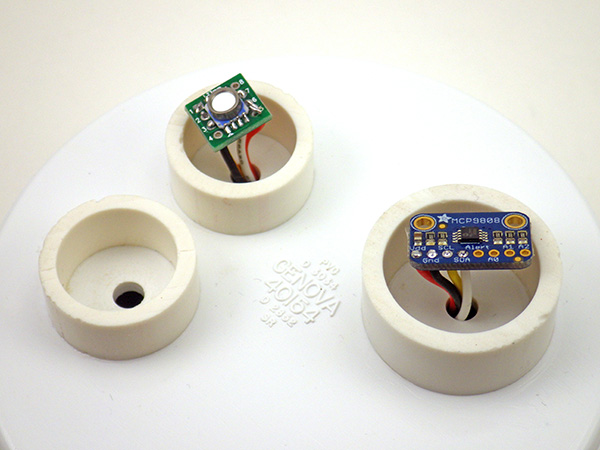
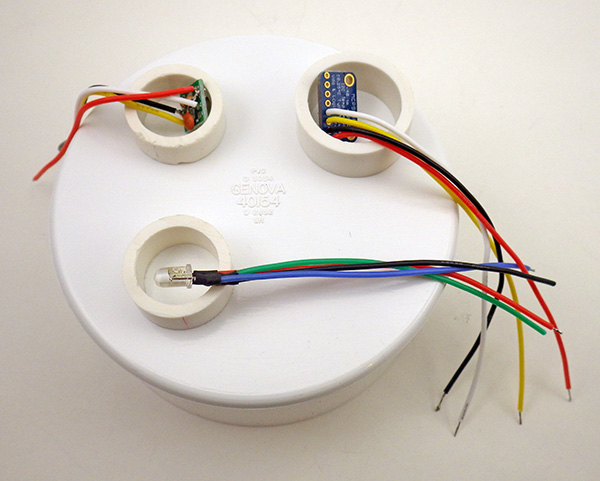 1. Once lead wires are attached to your sensors, select 1cm tall pvc rings of sufficient diameter (1” dia. & 2x ¾” dia. shown here) to contain your sensors and arrange them on top of a 4” PVC drain cap. Often it is handy to leave room for and extra sensor well, as you may decide to add another sensor to the cap later.
2. Roughen the surface of the cap and the inside of the PVC rings with sandpaper to provide some tooth for the epoxy that will be used to pot the sensors later. Sand the lower edges of the pvc rings so that they are level and form a tight fit with the top surface of the 4” end cap.
 3. Clean both surfaces, and give the two surfaces that will be brought together a light coating with clear pvc primer, then put a thin bead of pvc cement on the lower surface of the pvc ring and bring it into contact with the previously primed area on the large end cap. It is important that you use ‘just enough” of the primer and pvc cement to bond the rings. If you apply more than a thin bead, the solvent will fail to bond.
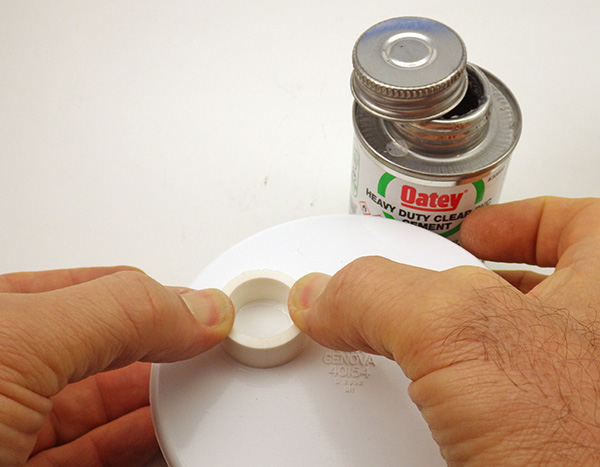 Very quickly after applying the pvc solvent cement to the ring, put it into place on the surface of the end-cap. You will need to apply firm pressure to each ring with your fingers for about 2-4 minutes until the ring is bonded to the cap surface. PVC cement usually cures to reasonable strength in about 30 minutes, but I like to leave my solvent welds to set over night because residual PVC solvent can interfere with the curing of the potting epoxy and/or turn it an ugly yellow color.
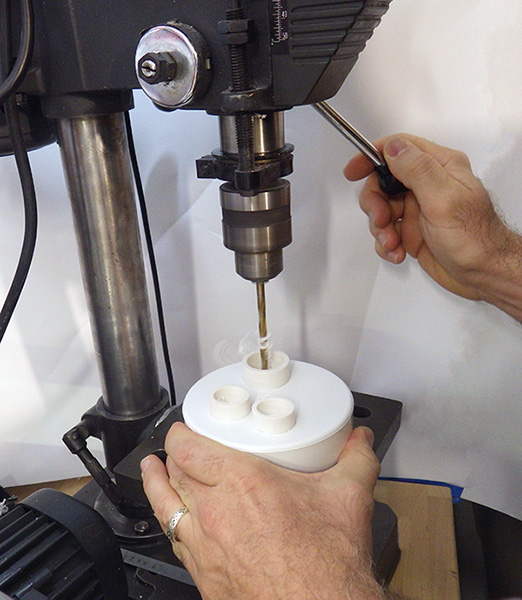 4. Once all of your sensor well rings are in place you will need to drill holes for the wires to pass through the cap for the indicator LED and sensor wires. A 7/32” bit produces a hole slightly larger than a typical LED, allowing you to insert the led from the inside of the housing.
This size hole is also a reasonable size to accommodate the wires from you sensor breakout boards.
 PVC is generally a very easy material to drill, but beware that the cap can be wrenched out of your hand violently if the bit bites into the cap the wrong way. Also be sure to wear eye protection whenever you operate a mechanized shop tool. Drill bits often break while you are using them, and then the little bits of metal go flying in all directions. If you have never operated a drill press before, seek guidance from someone with experience.
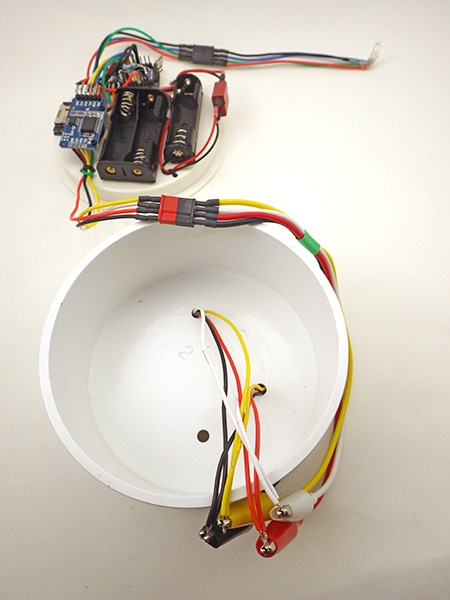
 5. With the LED leads inserted through the cap, neatly strip, twist & solder together the four corresponding I2C bus wires at their ends. To these exposed wires attach the ends of an alligator lead adapter cable (photo below) that has your standard I2C bus connector on one end. It’s a good idea to make some of these cables for all of the connector styles you are using on your project so you can connect raw sensor wires to your logger platforms for testing.
 6. With the logger connected to your computer via a USB-UART adapter, run a generic I2C bus scanning utility like the excellent multi-speed scanner by Rob Tillaart to see if the devices are reporting an address on the bus. Then run test utilities appropriate to your individual sensor to confirm that your sensor boards are operating normally and delivering data. The software you use will depend on which sensors you are testing. Libraries are often provided by better sensor vendors like Adafruit & Sparkfun, and the Arduino.cc forums are a good place to look for useful test utilities that others have shared.
It is essential that testing be done at this stage BEFORE you permanently pot the sensors into place with epoxy!
 7. Once the sensors are confirmed working, you can solder them more permanently to the male side of your connectors. I usually use the red Deans Micro-plug connectors for the I2C bus lines from the cascade port on the RTC so that I don’t mix them up with the black connectors I use on the LED lines. Be sure to follow the same connection pattern that you used previously. I like the Deans because they are keyed: I always put the GND and Vcc lines in the same position with these connectors, so that even if I make an error when connecting the sensor cap – no part ever gets exposed to a polarity reversal.
 8. The next step is to mount the sensors more permanently on the sensor cap. I do this by potting the sensor breakout board into place with Loctite E-30CL epoxy. (which remains liquid for at least 2 hours) so we first need to seal the wire pass-through holes in the housing.
Cut and knead a pea-sized bead of plumbers epoxy putty until it is well mixed (it will become slightly warm to the touch at that point) and wrap it around the wires underneath each sensor board so that it completely surrounds the wires. Then press the board and the putty wrapped wires into the hole in the housing until it forms a complete seal. It is important that the sensor breakout board be relatively level, parallel to the top surface of the pvc end cap, so that the epoxy that will be applied later does not accidentally cover the parts of the sensor that need to be exposed to the air. The putty usually takes about 5 minutes to set. Repeat this procedure for your other sensor boards and let your top surface putty harden (~15min) before proceeding to put putty in the inside of the housings.
 9. Cut and knead another larger bead of putting and wrap it around the indicator LED as shown. Before the putty hardens press the led through the appropriate hole from the inside of the housing so that the putty forms a complete seal against the roof of the housing. Smooth the putty until the LED wires are pressed closely up against the roof of the housing and let it set (5min).
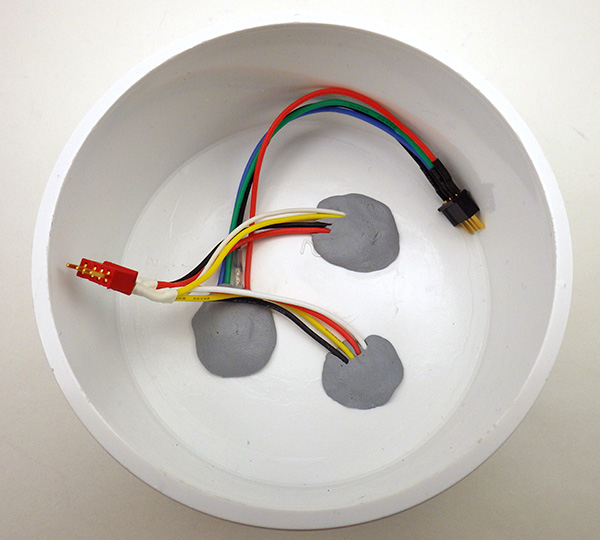 10. Cut and knead more beads of putty and press these up against the other sensor wires passing through the housing. The goal is to have the wires laid out flat and smooth, rather than emerging perpendicular to the top of the sensor cap where they would interfere with the logger platform.
Let the plumbers putty cure for 15 minutes before proceeding. It’s worth noting that it is possible to remove this stuff later on if you have a sensor failure, but the results are usually a bit ugly.
 11. At this point you have the LED and sensors mounted to the top of the top of the cap, but they need to be potted to become moisture resistant. With an applicator gun and mixer nozzles that allow flow control down to the single drop level, fill the PVC sensor well rings from the bottom with epoxy until the circuitry of the breakout board is covered. I usually use Hysol E-30CL but any epoxy or urethane with very low moisture permeability should work. I even have loggers sealed with JB weld, that survived six month exposures to salt water, but a clear compound lets you inspect the units better as they age. Let any potting compound completely cure before exposing your loggers to the environment. I usually wait a week or more (while running power consumption tests) before deploying a new unit.
 Many sensors such as temperature, magnetometers, and MEMs accelerometers can be completely encased in the potting epoxy and function well. However some sensors, such as those for PRESSURE and RELATIVE HUMIDITY require that certain surfaces remain exposed to the air for them to function properly.
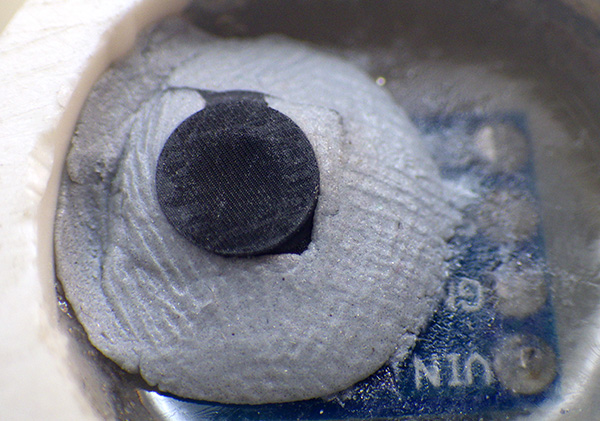 You must be careful not to spill any epoxy onto those sensor areas or they will be ruined! Fill the sensor wells with epoxy VERY slowly from the bottom and stop when the epoxy just covers the top edge of the sensor breakout board. Sometimes it is helpful to use a thin wire to paint the epoxy over the soldered breakout board traces while avoiding the sensor itself. The image above is from a HTU21 RH sensor and gives some impression of how tricky this can be to do well. That sensor is approximately 3 mm per side. If any epoxy had entered the small exposed hole at the center of the chip the RH sensor would have been destroyed. (yes, I have lost a few…) Some sensors also require a covering cap, and it is generally easier to use plumbers putty to affix these protective fabric caps into place after the epoxy has cured, rather than trying to do sub-millimeter adjustments with liquid epoxy.
 The indicator LED is easier to deal with as it is already sealed inside a clear plastic housing, so it only needs enough epoxy to seal the housing pass through. For sensors on cables, I usually fill the wells to the very top to provide some protection against flexing. You may need to clamp those wires in place so they remain at 90 degrees to the housing while the epoxy cures. In the first hour or so after pouring the epoxy it’s a good idea to check it periodically and break any large bubbles that rise to the surface with a pin. Slower epoxies often let most of the bubbles escape on their own.
Slower curing epoxies are generally more moisture resistant, but they can take up to 24 hours to harden. It is worth noting that some epoxies contract while hardening, and I have noticed that this sometimes produces a permanent offset in my pressure sensors.
 12. After the epoxy has cured, you complete the logger assembly with a Fernco PQC-104 4″ Qwik Cap rubber boot which will hold the logger platform in place inside the PVC drain cap.
The round bottom of this housing is pretty stable when resting on a flat surface, but you can mount the logger more securely by threading a few zip-tie loops around the metal pipe clamp before you tighten it to seal the housing. Then you can use those loops as tie down points. A 10 gram silica gel desiccant pack tucks nicely under the knockout platform. Get the ones with indicator beads so you know when they have expired.
Post assembly testing:
1. Test the LED
Open Blink again with the LED connected to the Arduino (Remember to set board and com port). Change the LED to Pin 4. Verify and upload. The red led should start flashing.
Repeat with pins 5 and 6 to test green and blue respectively.
2. Test the I2C bus
I usually use Rob Tillaart’s multi-speed scanner to determine if the devices are responding on the I2C bus: https://github.com/RobTillaart/Arduino/tree/master/sketches/MultiSpeedI2CScanner
With the scanner running, specify P to return to output only the addresses that have devices, and specify S to run a Single Scan. The RTC breakout board has an AT24C32 eeprom at address 57 and the DS3231 RTC will show up at address 68. Your other devices should report other bus addresses as per their data sheets.
Note: the AT24C32 is only rated for 100khz operation, but the DS3231 is rated for faster bus speeds up to 400khz. Also note that the I2c address of the DS3231 can be changed by joining solder pads on the breakout board if you have an address conflict with your sensor.
3. Test the DS3231 RTC
I use the library from https://github.com/MrAlvin/RTClib because it allows me to use sub minute alarms during debugging, but there are many good DS3231 libraries out there to use. The setTime & getTime code examples that came with older versions of MrAlvins lib provide a good way to test your RTC functionality.
- Open & upload setTime
File/Examples/RTClib/settime(from the link provided above) to set the RTC to your computers current time. Generally I set my computer to UTC before uploading this program so that the logger runs on UTC. The arduino restarts every time the serial window is opened so do not launch the serial monitor when settime is running or you will create a delay offset in your clock time. - Open & upload getTime
File/Examples/RTClib/gettime(from the link provided above) to check that the RTC has been set. Expect about a 10-15 second offset between your computers time and that read back from the RTC, as a result of the time needed between compiling the code and executing it on the Arduino.
Note: After the time is set you can try to make a sketch that reads the temperature register from the DS3231 with the example provided by Coding Badly at: http://forum.arduino.cc/index.php?topic=22301.0 While the resolution of the DS3231 is a modest ±0.25C, I have been quite impressed with its overall accuracy when compared to other much more capable temperature sensors.
4. Test μSD card communication
Insert a microSD card into the carrier and test it with the CARDinfo utility at: https://www.arduino.cc/en/Tutorial/CardInfo You will need to change the CSelect variable to pin 10, and I usually have to add #include SPI.h to get CARDinfo to compile properly. After uploading the sketch to the Arduino, information about card size, files, etc. are reported to the serial monitor reported if the card is connected.
Note: While CARDinfo is a very useful testing utility, it depends on the SD.h library that I almost never use any more. I much prefer Greiman’s SdFat.lib for loggers that are deployed as it uses less memory.
5. Test the Eeprom on the RTC breakout board
There is a utility to test AT style I2C eeproms posted by bHogan at http://forum.arduino.cc/index.php/topic,18501.0.html Set the EEPROM address to 57 and the serial window will return written A through T and 33 through 48 if the eeprom is working.
Note: Because of latency delays, wear leveling, and other factors the SD card often uses a significant amount of the power budget for a data logger. Buffering your data to the eeprom is a good approach to improving your operating lifespan. If you use page-writes, rather than saving data to individual locations in the eeprom you can store 28 characters of data with the same time delay as saving a single byte (a page is actually 32 bytes, but some gets used in coms overhead & for carriage return characters, etc.). So I think about that 4K eeprom in terms of “pages”, where my first 16 characters of the first page is always the time stamp: “YYYY/MM/DD,00:00”. That means if your actual sensor data only needs 10 characters of space you could store a reading in one “page” of the eeprom which would let you store 128 readings/pages in the 4K eeprom on the RTC board before you had to flush the data out to the SD card. If you have a fairly typical 15 min sample cycle (96 readings per day) you would be “waking up” the SD card less than once per day to write data, as opposed to 96 times per day. This kind of 100 to 1 reduction in SD card write events results in a substantial improvement in the performance of your data logger. I2C eeprom write cycles use about 3mA for 5-6 ms, and this often keeps your arduino processor awake an drawing power as well (usually @ 4-5 mA). My tests to date with much larger 32K eeproms buffering five days worth of data have only lead to a 10-15% overall improvement in the power budget when compared to one day buffering. So you do eventually reach a point of diminishing returns with the eeprom buffering strategy, but definitely take advantage of the eeprom on that RTC board if you can.
6. Test your other sensors
This will depend on which sensors you are using, and which libraries you have to work with.
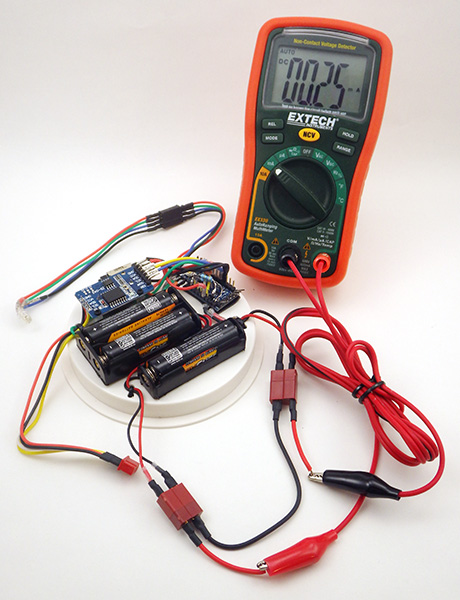
7. The final and perhaps most important test is to check how much current the logger draws while it is in sleep mode. The LowPower.lib from Rocketscream is a good way to do put your Arduino into deep sleep modes. If you want to see that library in action, I posted a bare bones logger script for the UNO based logger tutorial on the project’s Github which will run fine on this build, and that is the most minimal example you are likely to find of logger that sleeps, wakes on alarm, takes a reading, and then goes back to sleep. A typical logger built with Pro Mini form factor boards will draw between 0.20 to 0.25 mA depending on the attached sensors and how much sleep current your SD card draws.
A logger that sleeps just below a quarter of a milliamp usually runs for about eight months on a set of 3x AA batteries before falling below the 3.4v minimum for the voltage regulator. If your sleep current is higher than that you should look at whether you have a bad SD card, or if you have a sensor breakout board has a voltage regulator wasting large amounts of power. Since you already have the pro-mini style board delivering regulated 3.3v, try to buy sensors that accept 3.3v directly on their pins so that you don’t waste power with other support circuitry. Also try buy sensors that can be put into low current sleep modes easily. The really good sensor IC’s sleep automatically if there is no I2C bus traffic so you don’t even have to do anything for them. If you are using analog sensors, try to de-power any voltage dividers during sleep with a transistor or a logic level mosfet.
Also keep in mind that each AA cell in bank of three series cells can only go down to 1.15v before you reach the 3.4v minimum input for your regulator. If you look at alkaline battery discharge curves that implies that you are only going to have access to about 75% of the battery capacity. With 2000 mAh being fairly typical for a AA, that means you should conservatively estimate that your power supply will only deliver about 2000*.75= 1500 mAh. I usually get more than that from fresh batteries, and lithiums give you a slight boost because of their flatter discharge curves, but they also tank very quickly at the end of their lifespan, so be sure you check them before doing any SD writing. If the power fails in the middle of a data writing event – you loose all the data on the card.
Bumping these loggers up to 4x AA batteries in series should get you past a year even if your logger is on the high side at 0.25mA sleep current.
8. Program and run your logger
If you have made it through all the tests, then the next step is to run your logger with a basic bare-bones script and then when you are ready, you can dig into the other more complicated code builds from the project. I’m not going to hold everyone’s hand through all that, however I will add that the content of these tutorial pages by Nick Gammon were immensely useful when I was starting out, and I still refer to them frequently:
-
- http://gammon.com.au/interrupts – on AVR microcontroller interrupts
- http://www.gammon.com.au/forum/?id=11504 – on AVR timers and counters
- http://www.gammon.com.au/forum/?id=11497 – on Power saving techniques
Once you have digested that information, a good learning exercise would be to start with the bare bones script, and see if you could copy & paste only the parts that you need for your sensor out of the more complicated code examples. Keep doing that, one piece at a time, and eventually you will understand the entire thing. And there are plenty of other great datalogger examples out there if you Google around and many of them were created by people who actually know what they are doing, most especially the moderators at the Arduino.cc forums.
With all that in mind, Part 4 of this series covers techniques for optimizing power consumption, but there is some more complicated coding, and trickier soldering, so its probably a good idea to build a couple of the basic loggers and get them running properly, before trying all the things in the final tutorial.
