Improving the Accuracy of 1-Wire DS18b20 Temperature Sensor Groups

Copper pipe for positioning the thermapen

Without the dryer lint stuck in the end, the last digit on the Thermapen sometimes does not settle. I use the same thermometer for individual sensor calibration later on, but in that case it’s the DS18B20 probe that moves in and out of the copper sleeve, while the Thermapen stays in the Calibration Bath most of the time. The somewhat annoying folding off/on feature of the Thermopen design forces you to take it out of the bath every 10 minutes as the unit times out.

As I dive into another batch of cheap DS18B20’s for a new set of temperature strings, I thought I should post a note about the pre-filtering I do with these guys before investing effort to properly calibrate and epoxy them. After attaching crimp pins & assigning each sensor a serial number,  I put several groups of them together in the water bath by binding them around a short length 1/2″ copper tube that has a felt plug at the bottom. The copper tube lets me keep the tip of a Reference Thermapen right in the center of the bunch. (The Thermapen has a resolution of 0.01°C  & accuracy of±0.04°C  – so not quite the ±0.01°C accuracy I should be using for my ±0.1°C target, but more affordable at ~$200 and it has a NIST traceable calibration certificate.)  I cover the whole thing with towels for insulation, turn off the bath heater and, manually take reference readings every 1/2 hour as the water cools from about 40°C to around 10°C.  I ignore the first few high temp readings as the bath convection stabilizes, and focus in on the curve at my temperature band of interest, which for the next deployment will be about 24°C.  On a batch of about forty sensors, you see a spread something like this:

Cave Pearl data loggers

( Note: 12-bit values on left axis = 0.0625°C/LSB.  The Thermapen reference line is the one with round markers, and has been converted to equivalent integer values)

These sensors usually  tend to have stable offsets to within 1 LSB, so they group together naturally into ‘bands’ of  2pt high, 1pt high, 1pt low, etc. although they tend to toggle up or down over the length of the curve.  I right-click on the lines and label the nodes with their behavior in Excel.

TrampLabeling2

Once a sensor is labeled I hide it from view (by un-checking the box), so that I can click & label the remaining sensors.  Once they are all roughly classified I bring up the sensors from each designated band to check if the high/low behavior of all the units in the group is stable over a larger section of the curve:

TrampTightBand1

You can see here that some of the units that were 1pt low between 350-380 change over to 1pt high down around 300. And sometimes I move the sensors into a different bucket after looking a bit more closely at their behavior in Excel.

Those are the raw 12-bit integer readings, so the graph above covers from 18.75 – 37.5°C, and over that range you typically get about half of your sensors toggling within one LSB of the reference, with a further subset of about 8-10 that lie right on the reference line. If I can live with a spread of ±2 LSB (ie: ±0.12°C), my yield from this batch of sensors goes up to 31 out of the original 43.  Given that these guys cost about $2.50 each, I just toss the rest into the bin before I do any further calibration.  Occasionally, I get a bad batch where I triage around 50%. But the thing is, I invest so much time mounting these sensors, that I would still be doing a suite of tests like this no matter where I bought them.  Time is the real cost when you build a logger with so many sensors connected to it.

Addendum 2016-02-15

If you want to do more than just eyeballing those graphs, a simple first pass is to subtract the RAW sensor reading from the 12-bit equivalent of your reference reading. Then take the average of those residuals as your bin category. (excluding high temperature outliers) This is still a pretty broad brush approximation of your sensor behavior though.

Of course once you get that far, you might as well plot the reference temps (Y axis) and the raw data (X axis) together and use Excel’s trend-line function to give you a correction equation that converts the sensor output into the reference:

Binning DS18b20 temperature sensors by checking residuals

Note: The spreadsheet above (Click to embiggen)  is in sensor output equivalent  numbers rather than Celsius or Fahrenheit. It’s just faster to translate the reference data into sensor equivalent units, rather than change all the other numbers in the spreadsheet into stanard temperatures. But the units you decide to use does not change the method, just the constants you get for your trend-line equation.

Since the 20-30°C range is usually the flattest part of the DS18b20 response curve, a linear trend-line usually brings my average residuals below the sensors LSB resolution of 0.0625°C.  In essence, this is a simple multi point calibration method that you could do with any reference thermometer and an insulated bucket of warm water.

If you have to go to a polynomial to get your residuals down in this temp range, you probably have a sensor that is going to be a pain in the backside to deal with.  I always have bigger residuals at 30-40°C than I do at 20-30°C but that is also the part of the curve where the bath is cooling more quickly, so I suspect that I have hot and cold spots cropping up in the physical system.  I’m now looking at adding a circulation pump, and perhaps making a dry well insert to put in the center of the bath.

This cooling ‘temperature ramp’ procedure is much different from the two point calibrations I was doing earlier, and I am still trying to determine which one gives better results when I combine it with the normalization that I usually apply to these sensor strings after they are epoxied into permanent sets.  So far, the actual measured ice point offsets have not been agreeing very well with the intercepts predicted by regression on data from 20-30°C and that has me wondering whether it’s even worth the effort to calibrate these sensors over a temperature range that they won’t see in the field.

DS18b20 normalisation bath

I insulate the heck out of the thing with towels, etc. so the normalization cooling takes at least 24 hours (usually closer to 2 days). I still take occasional Thermapen readings, but only to compare with the resulting average that I generate with the sensor data.  Ideally, the corrected average should already have very good agreement with the reference readings… or something has gone wrong with my procedure…

For the  ‘normalization’, I repeat the cooling water bath procedure above with the completed temperature chains assembled as they will be for a deployment. But instead of the Thermapen readings, I use the corrected average (using the equations from above) of all the sensor readings on the Y axis, to generate a second correction equation to apply to each sensors raw data to normalize them to each other. Unlike Craig at Yosemite Foothills, I use a second order polynomial for on this step. After that second correction is applied, any differences I see between sensors on the same chain should only be due only to a real differences in temperature.  

Addendum 2016-02-16

Well it serves me right for counting my chickens. After a few more days putting these sensors through their paces, 11 more units have died or they have stopped reading temperatures below 15°C.  I’ve been drying them on the radiators each night, and though we have a hot water system, I suspect the combination of daily soaking, and night time roasting, loosened the seals between the metal caps and the epoxy or did some other kind of damage. So now this latest batch is falling towards a 50% yield of sensors worth putting into the chain. Looking on the bright side, perhaps selecting sensors that can take more abuse is a good idea in the long run, even if it was done accidentally.

Addendum 2016-02-29

NY platform

An air filled unit from eBay vendor nyplatform. Looking on the bright side, it’s very easy to extract the raw sensor if you wanted to.

After having a few more units die in the middle of testing it started to really get under my skin. So I decided to take a bunch of these sensors apart and soon discovered that many of them were poorly put together (no big surprise there…) I had assumed that the metal casings were completely filled with epoxy, but I soon discovered that many were sealed only with a bit of heat shrink tubing. So the thermal cycling I put them through on the radiators loosened it enough for them to soak through on their next dunking.  Even when they had adhesive (like the unit shown on the right) they sometimes exhibited other strange problems as time went on such as not reading temperatures below 10°C so I have to wonder if the solder joints are also suffering from thermal expansion problems.  Although the nyplatform sensors were the cleanest looking units inside, they suffered the highest failure rate, and had the largest raw residuals, often outside the ±0.5°C spec.  So just being clean, does not necessarily mean best quality…

Things got even uglier as I moved on to the other vendor’s:

Smelly bad

That just can’t be good…

Though the units from Electrodragon had at least some epoxy inside, they were still easy to simply pull away from the stainless sheath, and when I did that I discovered some nasty smelling chemistry going on in there.  The frustrating thing about this is that during calibration runs these sensors were by far the best performers in terms of offsets & accuracy. But after seeing inside I have to wonder how long they are going to last.  I have started pulling all of these units out of the metal and cleaning them with 90% IPA so that I can mount them directly inside the epoxy. Hopefully this treatment will halt that creeping decay and keep them running longer than they would have if I just left them as they were.

DS18b20 temp sensor embedded in E30CL epoxy.

DS18b20 after cleaning & embedding in epoxy.

So I guess the take home of all this is that these cheap sensors should only be considered notionally waterproof in the same way that the round red things you buy at the supermarket in the middle of February are notionally tomatoes. Of course, once I strip them from the casing, they could be subjected to more pressure at depth, which had bad effects on my other temp sensors…Argh!

Addendum 2016-07-27

WordPress does not let me move comments from one post to another, so I am transposing this reader question over as an addendum:

João Farinha asks:
Great Work, I’ve a question if you don’t mind. The length of probes DS18B20 are small and several times I had to make extensions, used single-wire cable (Ethernet cable), sometimes the probes stop to work as the union between cables is made with solder, did this ever happened to you? if I just wrap the wire to the other and put duct tape around works well but is not as solid.
Cheers

I solder everything, and so far I have not had any problems with signal bounce on chains up to 25 m in length. But I do not use Ethernet cable, I use M12C Series Extension Cables from Omega.com  as these are rugged enough for my underwater application.   However I should mention that I have ruined several sensors in the past by having my soldering iron too hot when I tried to put the jumpers on the legs of naked DS18b20’s.  I simply cooked them by taking too long.  Wire wrapping could work if your leads were clean, but it takes practice, and a good tool for the job. 

Generally I buy the waterproof units that already have 1-2m of wires connected (as pictured in the post above) since I need at at least short term waterproof capability to run the sensors through the overall calibration procedure  before soldering them into a chain.

Measuring battery discharge on an Arduino Data Logger

I’ve written before about how the main battery discharge record is one of my primary tools to determine what happened when a logger fails, but I thought I would try another kick at that can; delving into some of the things that show up on units that are apparently running OK, but still leave me scratching my head.

I did not really know how to solder at the beginning of the project, so I was using Tinyduino based platforms that drew sleep currents between 0.5-0.6 mA. I was running them right from the battery with no voltage regulation, and using the 328’s internal 1.1v band gap trick  to track the power supply:

Battery Voltage (mV) with

Battery Voltage (mV), 2 x 3AA battery pack, Tiny Duino based logger

These units buffered less than half a day of readings to the small 4K eeprom on the RTC breakout,  so I attributed most of that 100 millivolt  jitter to the frequent SD card writing. Some have pointed out that the internal voltage reading trick itself can suffer from as much as 10% variability from one processor to the next, with additional thermal variations. But at least those curves were predictable, with a 6 cell (2x3AA) pack lasting longer than the four months between fieldwork trips.

The need to provide regulated power to an increasing number of sensors encouraged me to switch over to 3.3v pro-mini style Arduinos,  and adding a 32K external eeprom extended my buffering out to several days. This smoothed the power curves dramatically, and on good builds I now see voltage records like this:

Cave Pearl data loggers

Battery (mV), Rocket Ultra logger, 3xAA Battery, 0.19mA sleep

The steps on that curve correspond to the limits of the ADC (with a 2 x 4.7MΩ divider cutting the battery voltage in half), so that’s as good as I’m ever likely to see. The thing that has me curious is that I also see curves that look irregularly bumpy, and have other intermittent features. For instance, some of the loggers built from the same parts, with the same code as the one above, give me a clear pattern of 100mV dips whenever the data gets transferred to the SD card:

Battery (mV), Rocket Ultra, 2x 3xAA supply

Battery (mV), Rocket Ultra logger, 2x 3xAA Battery, ~3 day buffer

As you see the depth and duration of the dips vary somewhat, although the amount of data being written is always exactly the same, which makes me wonder about random latency delays. And that curve also has a mysterious low voltage anomaly showing up around 9/20 that lasted for the better part of a week.  I see stuff like that in about 15% of the loggers that give no other sign of problems, have low sleep currents, and decent operating lifespans. And this is definitely not temperature related, since most of the cave loggers see less than 1°C variation over a deployment.

Other times I see hump shaped features in the curve that seem to indicate that the problem occurred long enough to pull the batteries down significantly, but then went away, and returned again some time later:

Battery (mV), Moteino based logger, 3xAA supply, 0.22 mA sleep

Battery (mV), Moteino based logger, 3xAA supply, ~5day buffer, 0.22 mA sleep

I took this unit out of service, and am running tests on it now to try to identify what happened. Again there was no hint of a sensor failure in the data, and the sleep current still looks the same as it did at the start of the deployment. I’ve seen this hump/step pattern a few times now, and for all I know it’s an issue with the batteries hitting some kid of threshold, rather than the logger. 90% of my deployments use alkaline AA’s, as I usually catch them on some kind of promotional sale at the local hardware store. I rarely use lithium AA’a as they are more expensive and I’m not convinced they give you longer operating life in low current applications.  They also fall so precipitously at the end of life that I am concerned they will brown out in the middle of an SD card operation, destroying my data before the code has a chance to intercept the low voltage problem. (…and they are not allowed in air travel luggage …)

Probably the longest running power curve mystery are the events that only show up once every month or so. These hits are so widely spaced that they don’t seem to be directly related to the buffering & regular SD card writing events, and I have yet to find anything else in the code that explains them:

Battery (mV), Rocket Ultra, ~3day buffer, New file @~15 days

Battery (mV), Rocket Ultra, ~3day buffer, New file @~15 days

The timing of these long gap events can be regular, as shown above, or more variable. My current hypothesis is that some threshold is being passed inside the SD card controller triggering some kind of huge load balancing event that hits the battery with a sustained power draw much larger than any of the normal logger operations. This makes me wonder if the battery packs would benefit from a parallel supercap to buffer those pulsed loads.  I suspect that the SD cards are responsible for most of the power curve anomalies that I’m seeing. All the loggers are now using Sandisk’s MUVE music SD cards that quickly go into low current sleep, so I am still left wondering what the real cause is.

Anyway, I’d love to hear comments from others who have seen curves like this in ‘otherwise normal’ equipment.

Addendum 2016-03-02:

Just thought I would add another interesting one to the batch. When I build a new logger I like to put them on a shakedown test for a week or two, with rapid sampling and small eeprom buffers to make sure the SD card sees lots of activity to test it out.  So this is in no way a “normal” operation power consumption curve like the ones posted above but it does show another interesting phenomenon:

This unit was taking a sample every 5 minutes, and only buffering 20 readings to the eeprom.

This unit was taking a sample every 5 minutes, and with only 20 readings buffered to the eeprom those numerous 100mV spikes are from the frequent SD write events.

This was a continuous run, so the code did not change even though there was a fairly dramatic shift of the pattern in the voltage readings. Usually I see this kind of thing in reverse when a sensor fails (ie: a smoother curve becoming more and more variable as the sensor goes down).  I have no idea what caused this unit to become more regular as the run progressed?

Addendum 2016-04-07:

Found anther one to add to the collection.  This flow meter is still in service, though the overall curve is crunchy enough to make me suspicious that something is going on, the logger has not replicated the central up/down anomaly in any subsequent deployments:

Caption

Battery (mV), Rocket Ultra 8mhz, ~5day buffer, New file @~15 days

Addendum 2016-04-07:

I monitor the main AA supply with a simple  2 x 4.7MΩ divider  on an analog pin, but Dangerous Prototypes spotted a low voltage indicator circuit that can be built from a couple of comparators. This could come in handy for builds that don’t have enough pins left to keep track of Vbat. This would be handy for minimal builds with AT Tiny’s. There is also some interesting background info on battery discharge curves with boost converter in this TI appnote.

Addendum 2016-07-30:

Reviewing the data from the latest round of fieldwork, and have another interesting power curve to add to the collection:

Rocket based logger,

Rocket Ultra 8mhz based logger, 3xAA, 15min sample, 512 records buffered to eeprom

That’s the first time I’ve seen higher voltages appear in a record where the logger was in a stable thermal environment, and it makes me wonder how that might of occurred. Since there was no change in the cave temperature, I suspect that the voltage regulator on the Arduino had a few low voltage events, and this messed with Aref enough to create artificially high readings on A0.  All the other data in the log appeared to be fine, but I will be keeping my eye on this logger…

Addendum 2016-09-12:

shottky1n5817This is a bit of a tangent, but I’ve been using bog standard 40v 1A Shottky 1N5819 diodes to isolate the 3xAA battery banks on some of my loggers, and I just noticed in the datasheet that 20v 1N5817’s have about 1/2 the Vf. And I just found out that with beefier 3A diodes, I can probably bring the voltage drop even lower during SD card write events, which could push the logger below the 0.1 A line at the bottom of this graph. This makes me wonder how much of the voltage dips I’ve been seeing are a real effect of the load on the battery, and how much is simply an artifact of the isolation diodes?

Addendum 2016-10-17:

1n400x15Continuing on the diode tangent, I’ve recently come across a few mentions of powering Arduino projects with 4xAA batteries in series, using a 1N4001 diode to drop the voltage into the 5.5v range you see on some 3.3v Arduino regulators. I have yet to find any tests of exactly how much power you would be wasting over the diode, vs the extra power you could extract by taking 4 cells down to about 0.85v  than you could with 3 cells in series (~1.16v) . The circuit would cause a voltage fluctuation of about 0.2 volts but I don’t know if that is worse than the Shottkys, as their datasheet does not go down to very low current levels. It’s worth noting that the MIC5205 on the ProMini is rated to 12v input but that comes at the cost of another 0.05mA sleep current which would burn away the benefit of that extra cell fairly quickly.

Addendum 2016-10-27:

EEVblog #140 – Battery Capacity Tutorial
EEVblog #772 – How To Calculate Wasted Battery Capacity

That last one makes me  less concerned about the LDO regulators relatively high 3.5v cutoff when using 3xAA’s, but even more concerned about the curves that show a 100mv pulse discharge drop during SD writing. If those events trigger the low voltage shutdown too early that would loose a significant percentage of the overall battery capacity.  Perhaps the best solution would be to switch to the MCP1703 regulator which accepts up to 16 V, then I could use 4xAA batteries and avoid that diode loss problem. It is available with 3.3V output (MCP1703-3302E  & the SOT23-3 boards to mount them)  although some people have had problems with the 1703 in low power applications. Having the extra input voltage space would let me try putting 3.6v lithium cells in series, which you can buy in “D” size with a whopping 19Ah. Of course with  lithium discharge curves being so flat, I might get away without the regulator at all: I just don’t know how sensitive the SD card would be to that drop at the end, and it’s not worth risking data to find out…

Addendum 2017-02-23:

I finally started tracking down those SD card wear-leveling events with my Uno-scope. It’s hard to catch ’em because they don’t get triggered very often, but after setting a unit to constantly loop through a repeated sequence of short data saving events I managed to snag one:

This is just a brief one, but perhaps others last long enough to cause one of those dips in the voltage log?  I read the battery voltage before and after the data saving, so if the SD card does that kind of housekeeping after the file close event is complete, then SDfat has released the code block and I could be doing that second battery read while the SDcard has the current drain at up near 60 mA or more…


Field Report 2015-12-20: Winding Down…

Whew...home stretch!

On the home stretch…

I know we are nearing the end of a fieldwork trip when we start to see the floor in our room again. By that point we are usually dog tired after several days of a routine that could be summarized as: If the sun is up: dive/install loggers, if the sun is down: prep data loggers.  We try to make sure there are a couple of dry days before the flight home, but if anything those are even more busy as we run around returning  borrowed equipment, and talking about interesting new sites with our cave diving friends.

Trish & Natalie planing future deployments

Trish & Natalie planning new deployments

This is where I just stand back and watch in quiet amazement as Trish weaves all those loose ends together in the flurry of last minute activity. Of course some times we have a quiet conversation afterward, that starts with me asking “Uhhh, so exactly how many loggers did you just promise to deliver, that I have to build?”  Still, when you have so many amazing people offering to help with the project, it’s really darned hard to say no.

Aubri shows off her new loggers

Aubri shows off her new loggers, painted black because it just looks cooler  🙂

As ever, there are always plenty of cool things on a fieldwork trip that don’t make it onto the blog, like that moment when you realize the graph in front of your eyes is probably going to lead to a publication all on its own, or that point when you realize that you can’t close the windows to use the car’s air conditioning any more because collective foot rot has set in, and is approaching biblical levels. But even glossing over all that, I couldn’t sign off on this trip without mentioning one notable highlight: Aubri Jenson is a caver, and cave diver, who has joined us on past field trips deploying Cave Pearls. However this time she arrived with her own set of loggers, which she built for her own research.  Watching her describe them to the other cavers in at the restaurant, was a milestone for the project that filled my nerdy heart with the kind of joyful songs and laughter that I haven’t heard since… May 25, 1977.  Wooot!

<— Click here to continue reading the story—>

Field Report 2015-12-15: New DS18B20 1-Wire Sensor Chains Installed

A typical DS18b20 temperature string deployment

A typical deployment

The August deployment produced both success and failure from our 1st-generation temperature strings. We still managed to get both of those older units back on their feet with fresh batteries, and we add two beta units to the set.  I really had to scramble to get the new chains ready in time because we are spending more time on testing and calibration as I try to squeeze the best possible performance out of these humble DS18b20’s. It takes me about a day to solder and epoxy a  section with 8-12 sensors, so these instruments also represent a significant amount of build time. (note: the length of the wires in between nodes does not affect that time very much)

Although both of the alpha loggers passed the overnight tests following their first run, the shorter (25cm) chain developed a reading problem as soon as it was powered up. The fact that this error occurred before the unit went near the water tells me that it was either a sensor failure, or a problem with the connectors. I have been using Deans 1241 micro connectors between the segments because they seem really robust, but my gut tells me those break points could also add some signal reflection problems.

Here I am 'prospecting' for thermals by dangling a 24m chain from a life jacket and moving it around the cenote. I thik I will put a display screen on one of the next units to make this task easier.

We went hunting for potential deployment locations by dangling a 24m chain from a life jacket and moving it around the cenotes to generate profiles. I think I will put a display screen on one of the next units to make these ‘prospecting’ trips easier in the future.

The logger itself ran for the duration, but the log data was a string of the dreaded 85C (ie: 1360)  and ‘-1’ read errors.  Since these numbers are fairly distinctive, I will put an error check in code on startup to see if I can intercept this kind of problem in the future.  At least the pressure record from the MS5803 on the housing survived intact, and that sensor seems to be working again now that I have removed the Qsil silicone coating that I had over top of the sensor on the previous deployments.

I isolated the read fault to the first segment of the temperature sensor chain, and when that section was removed the rest of the sensors ran well enough. We decided to re-deploy the parts that were still running  (although the chain is now less than four meters long) and I brought the dodgy section home for some forensic testing. I am suspicious of the U-09LV urethane that I used on a few of the nodes, thinking that it’s higher moisture resistance might not compensate for the stiffness and overall durability of E-30CL.

Fortunately, the longer chain that we deployed in the deeper inland site performed well, giving us another record with sensors spanning the halocline:

raw data

Two months of raw DS18b20 output, Logger 46  (10m cable with 20 sensors). Note: the warmer temps shown at the top of this graph are from sensors deeper in the water column, while the cooler temperatures are from shallow sensors in fresh water

Even with relatively long 50 cm spacing, the large rain events of the season pushed the fresh/salt boundary around so much that several sensors (indicated here with 48pt moving averages) switched from the saline, to the fresh water, and then back again. It will be interesting to see if those bands tighten up, or spread out, after we apply our normalization factors.

New DS18b20 Temp strings ready to deploy.

This 6m x 24node chain has a 10m extension, allowing us to change sensor positions in the water column by simply tying off the excess.

After several meetings to obtain permission from the landowners, we managed to install our new set of DS18b20 temperature strings.  We decided to co-deploy a combination of high and low spatial resolution chains, so that we still have a good chance to get data, if one loggers dies.  Due to memory limitations, etc. I built them with twenty four sensor nodes per logger, and even with those spread out over 24m of cable, 3k3 pullup resistors are enough for the one wire communications. That’s aggressive enough to give me some concern about self-heating if I was doing multiple readings, but I figure that with the bus at 3.3v it probably just comes out in the wash.

This deployment site had significant amounts of hydrogen sulfide at depth which forms a visible layer that is shown well by these photos from Angelita.  It will be interesting to see how the chemistry affects our sensors. It certainly had an effect on me, as I was a little worse for wear after that dive.

<— Click here to continue reading the story—>

Field Report 2015-12-14: Re-install the Drip Monitoring Network

New tufa based installation.

These large soft formations often form around the tree roots that drill down into the caves from the surface.

I brought six new units to cover attrition of the older drip sensors, but with only one failure in the last round, the scheduled replacements left us with several ‘old but still working’ loggers in hand.  With so many good stalagmite-forming records in the bag, we decided to look at some of the amorphous flow-stone draperies on the periphery of the cave. It will be interesting to see if we can develop a sense of how much these sources contribute to the water draining into the cave.

Although I had not yet determined if the Masons RH experiment was working, we decided to re-installed those multi-probe logger since they capture both temperature and barometric data, which is still very useful information for the project.

A roof-top deployment is nearby, for comparison.

With a roof-top deployment nearby, we hope that comparisons with ground level units might provide some idea how much rain is evaporating before it even hits the ground…

With the success of the rain gauges, we decided to disperse those loggers to topside locations ranging as far as Tulum. I will build more for the next deployment, as we would eventually like to have surface rain gauges at all of our cave monitoring sites (precipitation is as relevant to the flow loggers as it is to the drip sensors!).  That’s a tall order, so I am happy that nearly all the units are delivering one-year or more operation on a set of batteries, so we no longer have to change them on every trip. As readers of this blog know, it’s been a long road bringing the project to the point where we can just leave the loggers in place if we run out of time, without loosing any data.


In all, there are now more than twenty five loggers in operation at Rio Secreto, which is the largest concentration of instruments we’ve ever had at one location. My hope is that the information we are gathering today helps to preserve their cave when the growing metropolis of Playa del Carmen reaches their doorstep.

The road out to Rio Secreto skirts the boarder of the largest limestone quarry in the area. A dramatic example of the different perspectives you encounter about how the natural resources of Mexico should be utilized. Of course, as a Canadian, I see exactly the same issues playing out back home...

The road out to Rio Secreto skirts the boarder of the largest limestone quarry in the area. A dramatic example of the different perspectives you encounter about how the natural resources of Mexico should be utilized. Of course, as a Canadian, I see exactly the same issues playing out back home…

<— Click here to continue reading the story—>

Field Report 2015-12-11: Flow sensors go Farther & Deeper

Baruch Figueroa-Zavala (from CEA) recently installed a new Cave Pearl flow sensor just down the coast from Akumal bay:

The latest reef deployment of the flow loggers

The latest reef deployment, 14m depth. (photo courtesy Baruch)

This marks our deepest ocean sensor deployment to date, and two backup bungees were added to ensure this unit does not get torn from it’s anchor like the last one we put outside the sheltered environment of the bay. The turbulence shadow from the reef will likely have some effect on the flow, and it will be interesting to see if this logger accumulates the same amount of bio-growth as the shallow water units…

Marco and I snorkeled out to retrieve both of the B-generation units in Akumal Bay, which were still running well. Both were heavily encrusted despite the thorough cleaning they had in August, and to my eye it looks like there might be even more gowning on them now than they had last time. I am wondering if the acid bath somehow roughens the surface, allowing more critters to get a foothold (?)  Of course it could just as easily be a result of some seasonal nutrient flux, so I leave it up to the biologists to comment. One thing that surprises me is that we are only now seeing the first evidence of a marine animal burrowing into the instruments, and they chose to attack the epoxy rather than the PVC. A subtle reminder that poly vinyl chloride is not the most benign substance in the world.

These units have been under water since the second flow meter deployment.  With twenty months of continuous operation under their belt, they are still producing solid results despite some fairly dodgy Dupont jumper cables that I would never use in my current builds. This makes me feel pretty good about all the laborious hand-sanding I did on those early housings:

B4_FlowRecord

Akumal Bay (North) Tilt angle (°) (from raw accelerometer readings)

It looks like a nice two-week tidal signal was coming through until the big rains took over the flow pattern. The temp sensor on-board shows how all that precipitation lowered the mid column water temperature in a pattern that is now beginning to look very familiar:

NorthBayTemperatureRecord

Unit B4: Akumal Bay (North) DS18b20 Temp (°C)

I really have to build myself a CTD to find out if the water temperature also tracks salinity, and if so, I wonder how that affects all the critters out there on the reef?

A few days later, after a good cleaning and a fresh set of batteries, we tried go back and  reinstall the flow sensors, only to find police waving everyone away from Akumal at the highway. For several days a group of protesters from the pueblo blocked roadway access in a vigorous dispute over access to the beach, so we had to leave the loggers with CEA staff for later deployment. Yet another reminder of  how the combined pressures of tourism and development completely dominate the regional dynamics, and I hope that the situation can be resolved in a way that preserves the bay for future generations.

<— Click here to continue reading the story—>

Field Report 2015-12-10: Sensor Precision vs Accuracy vs Drift

Testing multiple flow meter deployment configurations.

We compared different fin position configurations & three build generations on this deployment.

With drip sensor service under way, we started our usual round of dives to exchange the flow sensors. We often use our favorite coastal outflow as an equipment shakedown dive because it’s fairly shallow and we know the system so well at this point that it feels more like the project workshop than an actual cave. We monitor tide levels here with a pressure sensor, and we also had the 25cm DS18b20 temperature string in the system this time round (but I will report on those results later)

So close to the ocean, this system delivers tidal signals like ‘old faithful’, and we have another gorgeous data set (in triplicate!) to keep my favorite karst hydrologist happy:

Uncorrected Raw Tilt angle as a proxy for water flow velocity in one of our coastal outflow monitoring sites.

Raw Tilt angle in degrees (as a proxy for water flow velocity)

Those high flows line up nicely with the large rain events recorded at Rio Secreto, and with peak displacements above eighty degrees, I suspect that the drag fins are bumping the ceiling of the cave; clipping some of our high end. But that’s still a beautiful time series, and it reminds me that now I really have to get my hands on a logging ADCP so I can calibrate the 2″ housings to point velocity. Unfortunately past experience has already shown us that acoustics often don’t like being in caves with low ceilings, so I would also have to do that testing in some other system or get my hands on a concentrating beam ADV logger to avoid any reflection issues.

The other gorilla in the room is that age old question of accuracy vs precision. This shows up most clearly in the two temperature records from our pressure sensor, which sports a 12-bit Adafruit MCP9808, and a 24-bit MS5803-05BA (which also records temperature for it’s internal corrections) located right beside each other:

MCP9808 vs ms5803 temperature data...?

Temperature (°C): MCP9808 (Top)  vs MS5803 (Bottom)

That pesky pressure sensor....

That pesky pressure logger….

The bit depth limitation of the 9808 shows up pretty clearly against the 5803’s beefy ADC, but my dilemma is that that the factory calibration on the Adafruit sensor is ±0.25°C, while all the lovely data from the M.S. sensor comes with a quid pro quo of ±2.5°C.  I’d be happy to cherry pick diurnals out of the high rez record, but even without a trends over top it’s obvious that the two sensors have diverging behavior. (though both sensors claim great drift stability?). This is the kind of thing that drives a builder like me nuts because it hints that we might have another creeping problem like the TMP102 pressure sensitivity that nearly took out a whole generation of loggers. I think I will have to start recording the RTC temp register (which is protected inside the housing) so I have another data set to compare to these two surface mounted sensors.

What I would really like to know is if there was some way I could squeeze higher precision out of the 9808.  I keep finding off-hand references in the forums suggesting that if you average ~16 readings, you get another decimal place of resolution out of your sensor. But with temperature sensing IC’s doing massive amounts this when they convert 12-bit readings, they might already have reached the point of diminishing returns. This question is also relevant to the ubiquitous DS18b20’s we’re using, because they are so stable that 16 readings in a row usually just gives me the same number 16 times. Does this mean that averaging has already taken any bit-depth enhancing noise right out of the signal?

<— Click here to continue reading the story—>

Field Report 2015-12-08: The DIY Logging Rain Gauges Work!

Trish & Fernanda inspecting units before retrieval

Trish & Fernanda inspecting units before retrieval

We managed to squeeze in a short  fieldwork trip before the end of the year, and the growing number of loggers at Rio Secreto put that cave at the top of our list to give me enough time to service all the units.  It was also important that we get everything back into place before they were swamped by tourists wanting to spend their holidays in the sun, rather than shoveling snow.

I was very happy to see that only one single machine suffered a sensor failure, and this was one the surface drip units that we had cooked under the tropical sun during a previous deployment.  Some of our early monitoring stations are finally passing that critical one-year mark, so we can start to think about seasonal patterns in records that display this kind of short term variability:

Typical Drip Sensor record 2015, Rio Secreto cave

Drip count /15 min,  Station 10, Far Pool Cluster

RainGauge

I had no idea spiders were so fond of  living in climate stations…

We also had a several sensors on the surface, and I was really curious to see the the data from this first field deployment of the new rain gauges, given that so many of our cave records showed strong discontinuity events like the one above.  Not only did I want to see the quantitative data, I also wanted to know if the bottom shroud prevented the internal temperatures from going into to the 60°C range (which damaged several earlier loggers…)

And…. success! And both rain gauges were within 5% of each other, despite accumulations of bird poop & leaf litter, and one unit suffering from a slow tilt of nearly 10 degrees as the palapa roof shifted underneath it. With conversion ratios from my back-yard calibration, we were able to translate the drip counts directly into rain fall:

Rainfall (cm/day) data from one of our first rain gauge prototypes at rio Secreto

Rainfall (cm/day) from one of our first rain gauge prototypes at Rio Secreto

Trish had her doubts about this record initially, with so much rainfall occurring in what was supposed to be the local ‘dry’ season.  But after searching through data from nearby government weather stations, and comparing our surface record to the break-through events I was seeing in the drip data, we slowly became convinced that it had, in fact, been one of the rainiest dry seasons in quite a while.  We also had a beautiful temp record that showed the new cowlings pulled peak temperatures (inside the loggers) down by almost 20°C:

Rain gauge internal Temp from RTC registers.

Rain Gauge, Internal Temp (°C) from the DS3231 RTC register.

Hopefully this means that the SD cards are back in the safe operating zone, which I know from past failures is nowhere near the 85°C that Sandisk claims.

So the new rain gauges are working properly, adding another piece of hydrology instrumentation to the Cave Pearl lineup.  I would love to say that the Masons Hygrometers delivered another great success, but the analysis is turning out to be somewhat more complicated as the 96-98% RH variations pulled my wet bulb depressions right into the bit depth limit of the DS18b20’s , so I will have to keep you in suspense for a while as I chew on those numbers…

Addendum 2016-03-16

Well serves me right for counting my chickens: Turns out that the drip sensor based rain gauges suffer from spurious counts due to wind noise. But I’ve been running these guys at their highest sensitivity settings, so hopefully I can dial that back to reduce the problem. We also had the gauges on a soft palapa roof, which no doubt contributed to the problem.

<— Click here to continue reading the story—>

Arduino UNO Datalogger Project for Beginners (ie: no soldering)

Addendum 2017-02-20:

This post is the second in a series of online tutorials that I’ve been developing to help teachers bootstrap their own Arduino based curriculum. The full set are listed at  How to Build an Arduino Data Logger which walks you through the most recent versions in a more or less logical progression.  But if that material leaves you in the dust because you are teaching yourself as you go along ( like most people in the makers movement! ) then check out the beginner’s guides & video tutorials in the Ideas for an Arduino STEM Curriculm post. 

Also Note: Once you’ve mastered the basic UNO logger described in this tutorial, you can transition to smaller Pro Mini Based versions that run the same code, but provide much longer battery-powered operation. [see:  This open access paper describing how we use those for scientific research.]


Original Post from 2015-12-22:

Since posting the step-by-step build guide in November, I’ve had enquiries from people saying that the equipment & time required for that build still presented a significant barrier in the classroom.  A few asked if I could come up with a plan based on the Uno/Breadboard combination that has become a standard starting point for many people.  So here is a simplified data logger for those high-school teachers who want to add environmental monitoring projects to the curriculum:

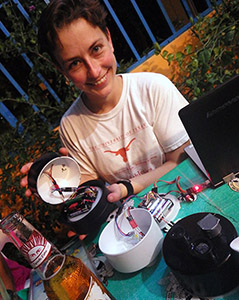
An Uno-based basic data logger, with no soldering required.  As the instructor, you can assemble this logger very quickly with pre-made jumpers but we found the connections were too easily knocked loose by clumsy students, so it’s worth taking the time with them to put stiff solid core wires in place. Note: I used an older UNO R1 I had lying around for the photos on this page, and the current R3 has A4&A5 broken out again on the right side above AREF, so follow the pin labels rather than the physical positions to accommodate your particular board revision (R1 / R1 / R3) pinouts

LevelshiftedSDCard

SPI micro SD card adapters like this can be had for less than $1 on eBay, and these can be connected directly to the pins of 5 volt Arduino’s like the UNO or the smaller form factor NANO. (note: the SPI pin labels are on the back). Note: These SD card adapters do not always get along with other SPI devices on the same bus.

Similar approaches to assembling a DIY logger can found at other places on the web (including many pre-built data logger combinations), but I thought I would add a quick breadboard logger to my other tutorials for those who Googled their way to this blog looking for something fun to try with an UNO – even if they did not have much experience with electronics.  If you go with no-name clones, the approach I’ve outlined here might also qualify as the cheapest option available (…if you are funding the everything out of your own pocket, like some of the science teachers I know…). The key difference between using an (unmodified) UNO, and the smaller pro-mini style loggers described in my earlier tutorials, is that UNO’s operate at 5v, while smaller form factor boards are generally regulated to 3.3v. This limits the sensors you can connect directly to those capable of operating with 5v logic levels, but most importantly it affects the SD cards, as they can only handle 3.3v. So you would need to use a raw adapter board with a level shifter to accommodate the different voltages. Fortunately, SD modules that already have the regulator & level shifter on the breakout board are very inexpensive, so this issue does not add complexity to the basic connection plan.  These cheap regulators are notorious power wasters, but most people operate UNO based projects on a USB tether for live sensor data in the serial plotter, or power them via a wall ac power adapter.


Parts you will need:

Arduino Uno ($24.95)
 A few students used less expensive clones for their personal projects (~$4.00) and they worked OK, though the soldering looked a bit dodgy, and a couple of the eBay ones used non standard UART chips so we had to go hunting for drivers. I often use the cheap stuff when I am noodling around on the workbench trying to get something working, and then deploy better quality hardware in the field. If you are just starting out, I suggest that you save yourself the driver headaches and use the standard kit. If you do go with the clones, donate something to the Arduino group as a thank you for making such awesome software
DS3231 & AT24C32 RTC module ($1.00)
Mini 400 Contact Solderless Breadboard ($1.50)
CR2032 coin cell battery for the RTC ($0.50)
SanDisk microSD card:  256MB to 1GB ($2.00-4.00)
Stick with cards smaller than 2Gb and format them with SDformater utility (not windows!) to fat16 and test with H2testw.  I generally buy 1Gb MUVE music cards from eBay because they are usually genuine; drawing lower sleep currents. WRT Filenames: use 8.3 format and don’t use spaces or special characters.
SPI microSD breakout ($1.00)
Common Cathode RGB LED (<$1.00)
+Various tools including needle-nose pliers, wire cutters, strippers, soldering irons, etc.

Total parts cost:  $15 to $35 depending on which Arduino board you use


Optional parts:
USB cable A-B ($1.00)
Jumper wire kit ($2.00)
I usually go with thicker 22 AWG, but 24 works too
Resistor kit ($2.00) 
The limit resistor for the LED can range from : 1,000Ω, to 30,000Ω with 10K being a reasonable option. Note that cheap multi-pack resistors often have thin 0.4mm wire leads which are not “breadboard friendly”, while more expensive resistors from Vishay or Speer usually have 0.6mm leads which stand up much better to handling
6xAA battery holder ($2.00)  or 8xAA battery holder ($6.95) with 5×2.1mm power jack
for longer life a 9v D-cell pack should get you out to a couple of weeks of operation
Scotch Outdoor foam Mounting Tape, 5Lb ($4.00)
Plastruct #91105 .060 White Styrene Sheets 3Pack ($10.00)
We attached the UNOs & breadboards to cut rectangles of styrene with the double sided tape to make stable platforms that the students could just pop into their project boxes when class was over. But premade acrylic mounting plates are also available.

For an extensive list of parts & materials see:  Building your own Arduino Classroom


Arduino software & libraries:

Before you tackle the assembly, install the Arduino IDE and test that it can communicate with your Arduino. Then there are a few libraries to download and install so that they are available when the Arduino IDE compiles & uploads you programs.

a) A library to control the RTC:
https://github.com/MrAlvin/RTClib
(Note: there are many other good libraries out there that you could use and confusingly most of them have the exact same name, but this one allows you to set sub-minute alarms if you need to)

b) An I2C bus scanning utility:
http://playground.arduino.cc/Main/I2cScanner
(to make sure your RTC and I2C sensors are connected & working)

c) A utility to test communication with the μSD card :
https://www.arduino.cc/en/Tutorial/CardInfo
(You will need to change the CSelect variable to pin 10 from the pin 4 in the code at arduino.cc)

d) A library that puts the Arduino processor to sleep between readings:
https://github.com/rocketscream/Low-Power
(you can’t put the UART to sleep on an UNO, but every little bit still helps save power)

e) A program to make the logger read & save data on the SD card:

A good place to start would be Tom Igoe’s excellent analog pin reading example at Arduino.cc   (but change const int chipSelect = 4; to const int chipSelect = 10; for the build described in this tutorial) 

 For something a little more advanced, I have prepared basic data logger script that puts the data logger to sleep and wakes it up again based on timed alarms from the real time clock. These are both just starting points for you to add to as you learn more about programming an Arduino


Putting it together:

1)  Prepare the RTC board

Resistor to remove from RTC

I usually begin by removing the resistor highlighted in red to disable the battery charging circuit. There is also a power wasting LED on the RTC board that you can remove as well, but that’s only worth doing if you want to run the logger on batteries. For more details about these cheap DS3231 breakout boards, you can dig into this RTC Post.

I have been using these cheap DS3231 RTC boards for a while now. They have proven to be very robust, although they have one element that is slightly annoying: they come with a charging circuit that assumes you have a rechargeable LIR2032 backup coin cell installed. You can use the RTC board as-is if you have on of those LIR’s in your RTC, but since you are not supposed to ship lithium batteries in the post, you almost always receive these RTC boards with no battery, or even worse they will just stick an non-rechargeable CR2032 in there which will pop if you leave it plugged in for long with the charging circuit connected. I usually end up finding a local supplier for non-rechargeable CR2032 coin cells which work fine as a backup power source for the clock provided you disabled the charging circuit by removing the resistor highlighted in red above.  You can cut that resistor off with a knife, but I find it easier to flick it off the board with the tip of a hot iron ( I know I promised that this was a solder-less build… but I didn’t say anything about de-soldering 🙂 ) Then insert a fresh CR2032 coin cell into the backup battery holder on the other side. If you forget to put in the battery the logger will still run, but the RTC will forget the date/time every time you shut your logger down, so the time stamps will not be correct unless you reset them every time you start the logger.

2)  Power the breadboard rails

1_pwrJumperBring the ground and 5v lines over to the power rails on the breadboard with some solid core 22 gauge wire.  I usually do this at the end of the board that is farthest from the rest of the wires I am patching over. Its worth tucking them in as neatly as possible so that they don’t get bumped around later. Make sure you have stripped enough insulation from then ends that the bare wire penetrates into the riser holes enough for a good connection.

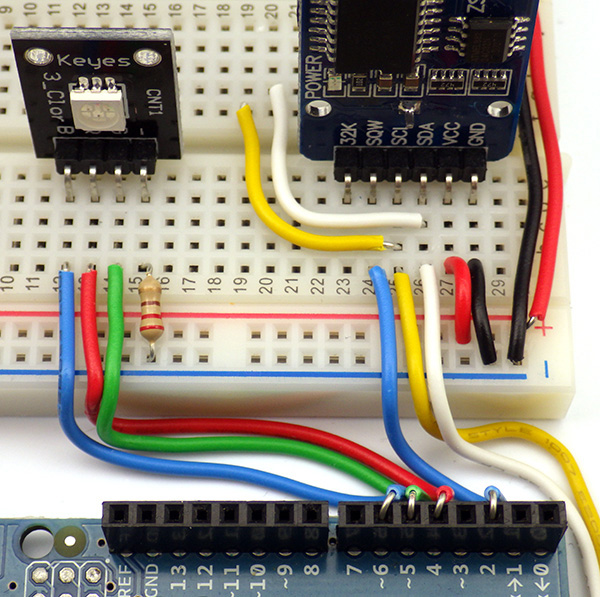
3)  Jumper the RTC module

Connecting the RTC to an Uno

Connecting the DS3231 RTC to an Uno:  This is possible because the DS3231 has a wide voltage range from 3.3v to 5v.  Many other I2C devices would require a 3.3-5v level shifter before they could be connected to the 5v UNO pins. Note: The long red & black wires at the bottom are simply patching power over to the rails on the other side of the mini breadboard.

The RTC board has clearly written silk screened labels for each pin:

Connect VCC & Ground to the appropriate rails on your breadboard.

Since the RTC is an I2C device, it uses the A4 pin on the Arduino as the SDA data line (white) and the A5 pin as the SCL clock signal line (yellow). There are many easy to use I2C sensors (that have pre-written libraries) that you may use with your logger, and they will be connected to these lines in parallel with the RTC. ( …if those sensors can tolerate 5v logic levels like this RTC ) To enable I2C communications, this RTC breakout board already has 4.7K pullup resistors installed on those two lines, so any other sensors you wish to connect to the SDA and SCL communication lines will probably not need pullup resistors to function. Many sensor breakout boards also have pullups on them, which you can usually leave in place, provided that the combined resistance of your parallel pullup resistors does not fall below 2.2k ohms.

Jumper the SQW line (blue) from the RTC board to Arduino pin D2. This wire will carry the “wakup alarm” signal from the RTC to the INT0 line. (note: the angle on the diagram above makes it look like the wire is in D3, but it is D2)

4)  Set the time on the RTC module

Before connecting any other components to the Arduino you should make sure you have the RTC working. Download the library ZIP file, extract the package, and move the library into your Documents/Arduino/Libraries folder.  The moved folder must be re-named ‘RTClib’ for the compiler to find the library and sometimes un-zipping adds extra folder layers that you have to remove to get to the library you want.

Update: 2016-10-12: I just noticed that they have taken the setTime & getTime utilities out of that RTC library that were current when I wrote the original post.  Now you will need to load File/Examples/RTClib/ds3231_v2 and set the time by following the instructions on screen in the serial text monitor. The new method should let you set your RTC more accurately than using the compile time with setTime.

OLD instructions: the greyed out instructions below apply to older versions of the RTClib that were distributed with the gettime & settime utilities.  I’ve posted copies of setTime & getTime utilities to my GitHub and there is an alternate version of the setTime sketch with Paul Stoffregens DS1307RTC library, which sets the RTC to the compile time with the command  RTC.adjust(DateTime(__DATE__, __TIME__)); but I found I also had to install Paul’s Time Library, to use his version of settime.

gettime

I set my loggers to UTC to avoid problems with local daylight savings time variations. To do this simply change the time zone on your computer before uploading the settime sketch.

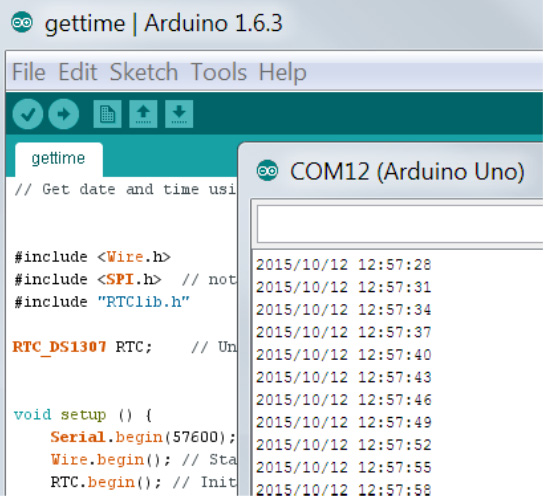
RTClib includes two useful utilities called setTime & getTime that can be found via the IDE pulldown menus after the library is installed at: File / Examples / RTClib / settime   &   File / Examples / RTClib / gettime  Open the settime sketch, verify it, and then  upload it to your Arduino via a USB cable connection. This takes the time signature from the compiled code itself and sets the RTC clock with that time. Do not open the serial window while settime is running or the program restarts – setting the time again incorrectly. Immediately after the settime has been run, LOAD the gettime sketch in the IDE and upload it to the Uno. Now open the serial widow, set the IDE serial window speed to match the script,  and you should see the date & time being read from the RTC.

Technically speaking, if your RTC is showing the correct date and time in the serial window,  you can move on to the next assembly stage. However, I usually run other programs to make sure that both the RTC and the AT25C32 eeprom on the breakout board are working properly.  Rob Tillaart wrote a bus scanning utility which is quite useful for this:      http://playground.arduino.cc/Main/I2cScanner.
If you run this utility you will usually find that the RTC is on the bus at address 0x68 and the 4K chip is on the bus at address: 0x57 – although the eeprom can move around from one board to the next. In fact the memory address can be changed to avoid conflicts with other devices by connecting the solder pads provided on the breakout board.

On that arduino.cc page you will also find a  link to a “Multispeed I2C Scanner” which I like because it scans the I2C bus with different speeds. This is useful as it identifies when your wires have become so long that capacitance is starting to interfere with the serial communication signals and cause the devices to act flaky and/or “drop off the bus”, but the basic scanner works just fine for most cases, especially when you are adding new sensors to your logger and you don’t know their bus address.

Note: If you see junk characters scrolling across the screen when you run any of these little utility programs, you probably need to check that your serial window is set to the same speed specified in the serial.begin command inside the program:

USBspeed

* I have also found that with some of the cheap UART boards that are needed for Pro-mini style Arduinos, I end up having to set the serial window to 1/2 the speed listed in the arduino code to make them work because they are not consistent with the standard board definitions. But the smaller 3.3v units have their clock prescalars set differently, so this should not affect the Uno based builds.

5)  Connect the indicator LED

Trimming

I find that its easier to keep the wires tidy by connecting one end of the wire to the Arduino, and then bend / fold it into place before trimming the other end.

Connect a three color common cathode LED to Red=D4, Grn=D5, Blue=D6.  A KEYES KY-009 SMD 5050 breakout board is pictured here, but any common cathode LED would work fine. Use at least a 1 kΩ resistor to connect the common ground line to the ground rail on your breadboard, to limit the current flowing through your LED.  As the limit resistor gets bigger the LED will become dimmer, but most are still visible with limit resistors up in the 20-30 kΩ range so the value is not critical. You do not need a three color indicator LED, but I find it helpful to put different color led flashes in the code so that I can keep track of what the Arduino is doing when I don’t have it connected to the serial window. So I turn on red for SD writing, blue for eeprom buffering, green for sensor reading, etc. 

LED and RTC connected

Two extra I2C jumpers (white and yellow) shown here simply patch those lines to the other side of the breadboard. These are not necessary, but they make it easier to add I2C sensors to your logger later without disturbing the RTC connections. The 220 Ω limit resistor pictured here is an absolute minimum, and probably should be bumped up to between 1-10K Ω.

6)  Connect the SD card Adapter

Place the SD card holder on the breadboard and jumper the following SPI lines from the adapter board ( check and match the labels printed on your particular SD board):
D12=MISO,    D11=MOSI,    D13=SCK,     D10=CS
Then patch the Ground and VCC lines to the rails on your breadboard.

SD card connections1

Before connecting your Arduino to test these connections, you need to insert a micro SD card in the adapter. Check a new card on your computer first, and delete any files that already exist on the card, then save a new blank text format file named “datalog.txt” onto the card (note: name in lowercase letters). Eject the sd card with the blank text file on it from your computer, and insert it into the SDcard adapter on your breadboard. It should slide into the socket. It should register with a nice click when it is in place. I often buy used MUVE music 1-3 GB micro sd cards because they are genuine Sandisk cards so they sleep at low current, and they are cheap because of the DRM on them that only lets you see 1gb of space – which is far more than you need for most data logger applications. (A typical logger recording Date/time and a few sensor readings every 15 minutes might generate about 5mb of text data after running for a year)

7)  TEST the SD card with CardInfo

This handy utility can be downloaded at:   https://www.arduino.cc/en/Tutorial/CardInfo

From there  COPY & PASTE the Cardinfo code into a new window in the IDE and make the following changes to the default CARDinfo script:

(a) CHANGE the chipselect from pin 4, to pin 10 with:  const int chipSelect = 10;   at the beginning of the script. We have already used pin 4 to drive our indicator LED’s red channel.

(b) ADD   #include <SPI.h>   to the beginning of the script if it is not there already.

VERIFY & SAVE this file on your computer with the name CardInfo. (you will end up using this utility many times again in the future!)  Then plug in your Arduino and upload the code, and open a serial window. You should see something like the following:

Card found OK
If you do not see a message like this one, it is possible that
-> The SPI line jumper wires are not in the correct place or you have a loose wire somewhere. There is some variation in the different board pin locations so review these on your board first to make sure you have everything connected properly. Note that your particular SD card adapter board pin-outs may not match my diagrams here, so you will have to adjust for that.
-> Your SD card is not formated as fat16 or the card is not inserted properly. I usually use smaller 1-2gb cards, as some of the new larger HDSC cards don’t format as fat16.
-> You have a bad sd card adapter board. I have had plenty of crummy sd card adapters with bad spring contacts, so try to have 2-3 of these on hand in case you get a bad one too.

At this point your jumpered connections should look something like this:

A basic Uno & Breadboard logger

Note that some overhang the SD card adapter board needs to sit “in the groove” at the center of the breadboard so that the pins make proper contact. The RTC and LED boards don’t require that, but it makes the build look a bit neater if you move them to match.

and your pretty much ready to start using your data logger.

8) Upload a basic data logger script

The code for your logger can now be downloaded from github via this LINK

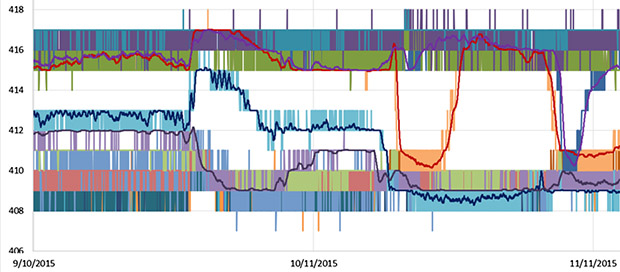
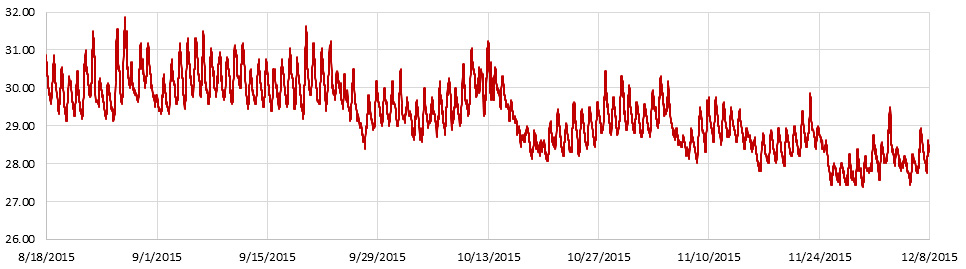
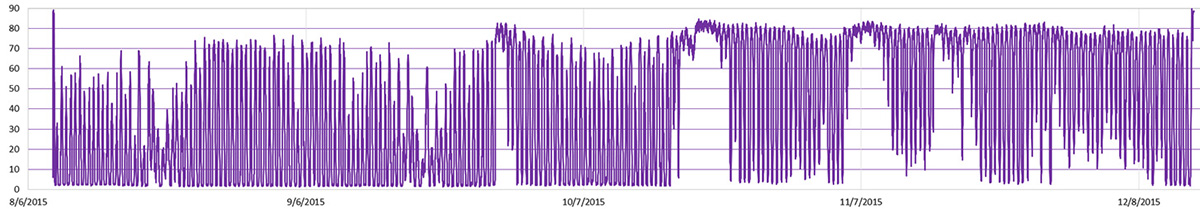
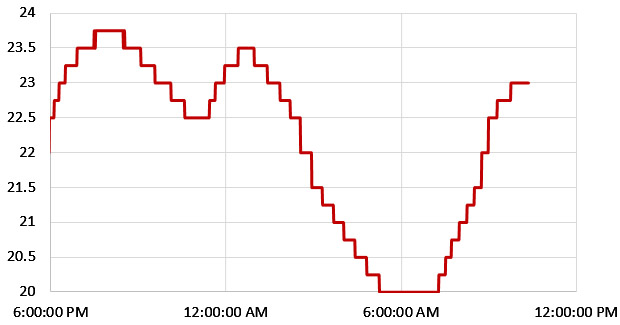
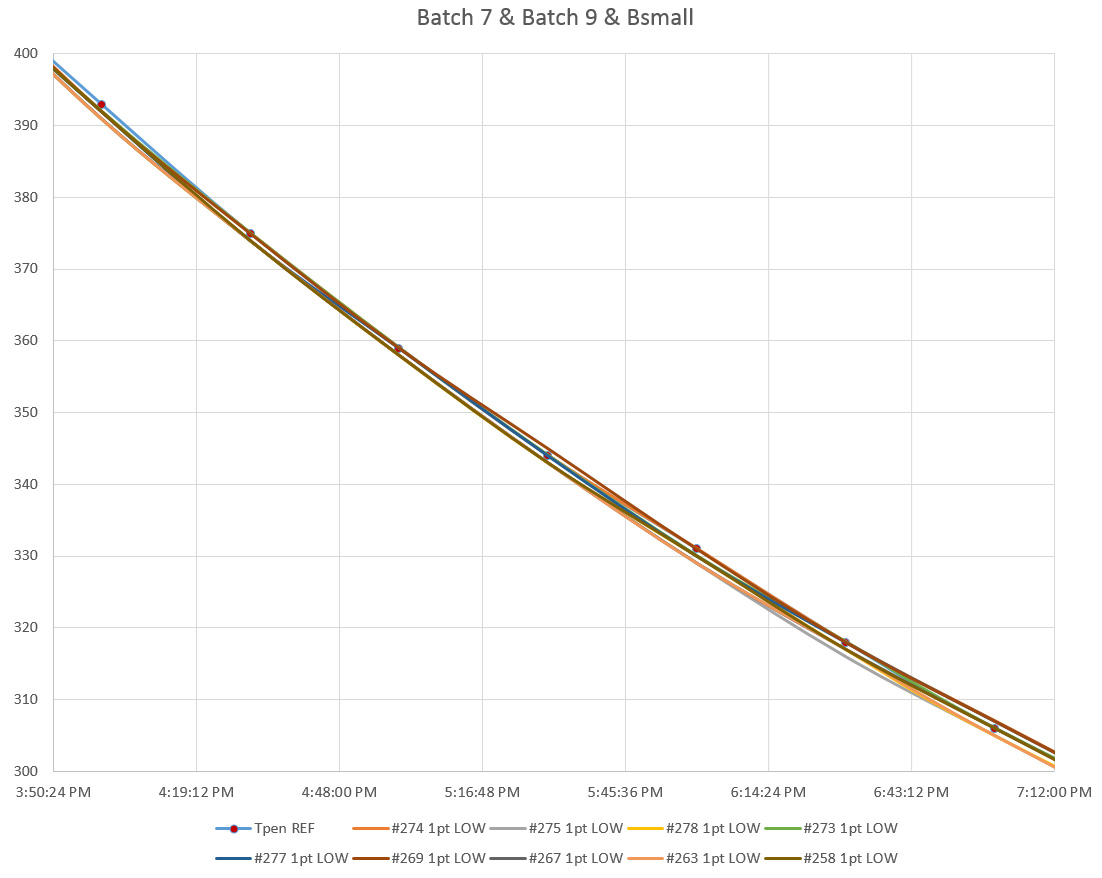
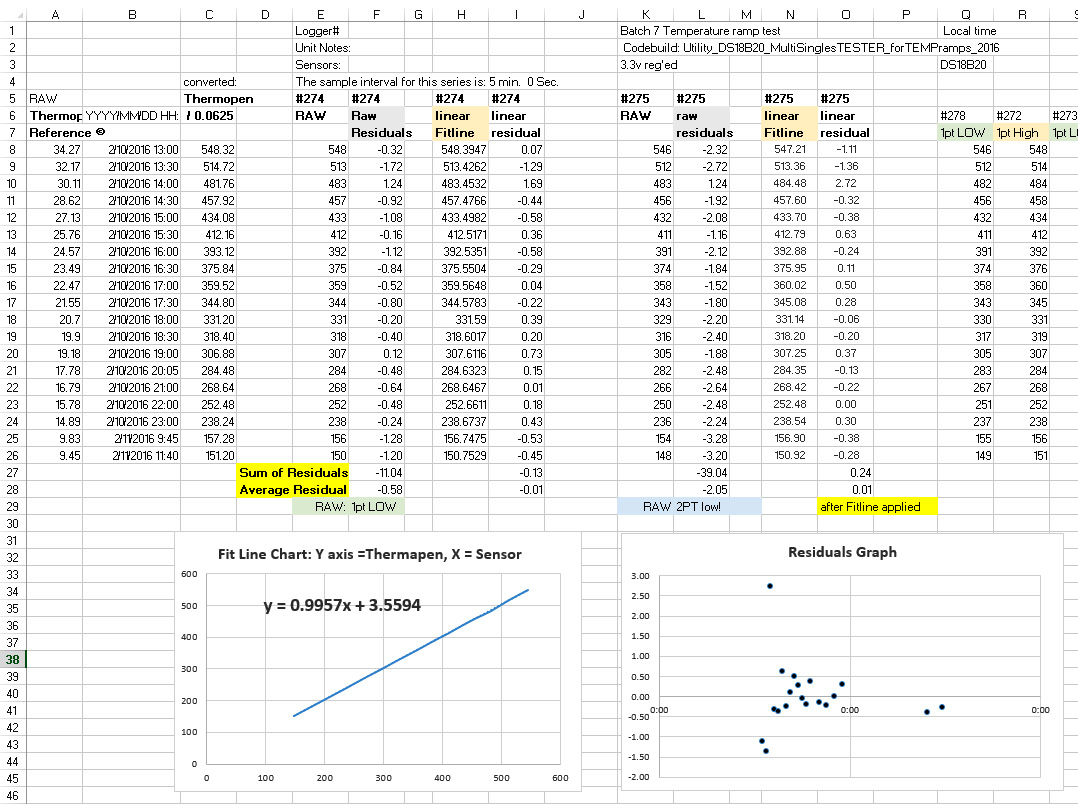
Starting with Tom Igoe’s excellent example at Arduino.cc, (which would also work fine with this build if you make sure to change CS to pin 10, but that code does not make use of the RTC, etc)  I added some functionality to create a time stamp and read the temperature register from the DS3231, and then write that information to a file on the SD card. Here is graph of typical temperature output from that RTC:     (@ 15 min interval)

typical

The RTC  temperatue record only resolves 0.25°C, but I have found these chips to be far more accurate than the ±3C listed in the data sheet – often less than half a degree away from sensors like the MCP9808

The code also puts the UNO’s cpu to sleep between readings, and it wakes up again to take a sensor reading when the RTC alarm goes off. The serial print output is all optional, so you can comment out those statements when the logger is running in stand alone mode. When you start making changes to the code, commenting out the lines you don’t need is generally much safer than deleting them.

This script is only meant to provide you with a basic starting point, and it should be easy to add other I2C sensors, or simple analog sensor readings following the example from Arduino.cc . Before you add some new sensor to your logger, spend time searching through the forum at Arduino.cc, as someone has probably already answered any question you might have about getting it to work. When you are just starting out, choose sensors that already have good libraries written for them.

It’s worth noting here that this code would also run fine on my pro-mini based logger builds. All you would have to add is a few lines to read analog A0 which tracks the main battery via a resistor voltage divider which is not included in this UNO build. The main Arduino page has a lot of free books and resources as well as explanations for all of the built in code examples.  There are also plenty of good Arduino programming references out there if you google around, which should help you customize the script.


Running the logger:

6xAA battery packs like this are fairly common, and should power an uno based logger for about 4-5 days

Six in series AA battery packs like this are fairly common, and should power this basic Uno logger for a few days of stand alone operation – especially if you use Lithium AA’s which have a flat discharge curve. 8xAA packs are available, but you have to be careful that over-voltage on new batteries does not push the total output above the UNO’s 12v maximum. The optimal solution might be to use 7 batteries in an 8-series battery pack, with a simple wire soldered across the last holder. 18650’s in series would be another option. If you need something that runs longer, rare earth magnets (soldered to the ends of jumper wires) make it easy to connect a number of C or D cell batteries into a custom power supply held together with painters tape. I would not try to power this logger from a 9V battery, as I don’t think it can deliver enough current for safe SD card writing. Rechargeable LiPo shields are also available if your pockets are deep enough.

Always do tethered test runs with sensor output echoed to the serial port so you know the code is working before you run the logger in stand alone mode.  In fact, I assume that most people will use this logger as a data acquisition system so I’ve put together a separate tutorial on using the Arduino as a basic DAQ with the serial plotter tool.  (scroll down to the 2016-08-15 addendum for the UNO only section) Note that to copy data from the serial window and paste it into excel you need commas printed between your numbers, and cartridge returns after, by using println rather than print for the last bit of data. Sometimes students have trouble cutting and pasting from the serial text window, or they accidentally shut the serial window by pressing the wrong button. So it is still a good idea to save to the SD card (if you have enough memory…) because this makes it easy to graph the data later. (with Excel or Google Docs)

One of the weird behaviors to know about with Arduinos is that every time you open the serial window from the IDE, the program that is running on the Arduino will restart, so if you are writing header data to the datalog.txt in the setup section, you will see a new copy of that header in the file each time the serial window is opened.


The easiest way to estimate how long your logger will run on batteries is with one of these USB power meters. Insert one of these $4 adapters between a USB power supply adapter & the datalogger. Reset the timer and let it run for a few hours and then look at the cumulative mAh number. Divide that into the rated mAh of your battery and you have a ballpark run time estimate. For reference, most alkaline AA batteries provide about 2000 mAh. It is even possible to make your own power meters.

Once you are comfortable with the serial plotter tool in the IDE you can look at other methods for  graphing the data in real time. One common method is by using another program called Processing. But be sure you test everything before your classes, as I’ve had some challenges getting processing to work on different windows systems (with the data on the SD card saving the day once again…) There is also an Excel macro called PLX-DAQ that can be used to monitor any serial port and display the data sent through it, but I believe that macro only works with older versions of excel/windows and I’ve never gotten it to work on my versions. Like Processing, it requires a few extra lines of code to be embedded in the Arduino sketch to direct the data to specific cells in the spreadsheet.  Plot.ly might also be worth using to share data online in a way that looks professional.  And if you are really get the bug, you could take it all the way to the ‘Internet of Thingslevel if you add a shield or two. Home automation & wireless gardening, are popular applications, with some people using  Google Charts to display live data on their websites.

Note:

With the always on UART chip, it’s hard to get an UNO to run for long on batteries, but you should still be able to get few good days out of a set of AA’s with this plan.  If you want a smaller footprint, you could bend the pins 90° and connect the RTC & SD boards with a lower profile to one of the many ‘stack on top’ proto shields available. Probably the best of the lot is the Dead Bug Prototype shield for an Arduino UNO (~$24.00), as this shield also lets you run an UNO for a very long time on batteries, though you would have to wrangle with his code a bit to make things work.  That shield has the RTC, & SD carrier already built in, so my advice is build a jumpered UNO logger as per this tutorial, then when you get all your code & sensors working properly in tethered mode, transpose what you have learned to create a stand alone unit using the Dead Bug shield. Moving on from there: another option that really helped me at the beginning of this project is the compact TinyDuino platform, which is code compatible with all of the larger Arduino boards so you can usually use your existing programs directly. I used Tiny’s in several of my earliest loggers, and some of them were still running after more than two years.  When you are ready to graduate to other small form factor Arduinos like the pro mini, perf-boards & wire wrapping is a quick way to make solder-less prototypes that can be disassembled afterwards. Once you are really comfortable with the different Arduinos, it is even possible to use the raw Atmel processor by itself on the same breadboard as your other parts.  Strip-boards are another popular way to go from circuits on a breadboard to a deployable prototype.

platform parts

In the stand alone logger tutorials, I describe how to build a housing from 4″ PVC fittings, but those parts are all available in larger diameters so the same basic idea could be used with the larger UNO based logger, though the caps get a bit expensive at that size.

With your ‘deployment’ build ready, you can go hunting for a waterproof enclosure for your combination (here is an example using a prebuilt project box and anti vibration mount), or you could try building something more creative with pvc plumbing.  Lego blocks are not waterproof on their own, but they are made from standard ABS, so a little dab of ABS plumbing solvent around the edges lets you quickly assemble very robust internal scaffolds for your prototypes.


Addendum 2016-01-05:

Instrumentation & field methods students building data loggers.

After UNO based labs, the students move on to pro-mini based logger builds with many different sensor combinations. The Pro Mini is essentially just a stripped-down Uno and uses the same pin mapping. So it is generally possible to transfer UNO logger code into a Pro-mini based build with few (if any) changes to the programming.

It’s also worth noting that this UNO logger has been ‘field tested’ many times during Trish’s Instrumentation course. I am happy to report that once the solid core wires are firmly in place, the students were able to reassemble the loggers quickly at the beginning of each class by simply popping the RTC, LED & SD adapter back into place. This saved a great deal of time, and the students used the UNO’s as a code development platform while they built “stand alone” loggers for their final projects.

However there were a few bumps along the way that I would like to share with other instructors:

1) No matter how many times you tell your students to unplug the Arduino from the computer before changing wires around on the breadboard, they will forget, and start changing wires around while the whole system is live. (…making plenty of mistakes in the process) While our Arduinos survived, the USB ports they were connected to sometimes did not. I would recommend that you use a sacrificial powered usb hub between the computer and the Uno to protect the computer’s usb ports from this abuse.

2) The single most common mistake that the students made was forgetting to put the limit resistor on the LED, and a few digital I/O’s were lost from resulting high currents if student failed to notice the the led was unusually bright.  (Again, I am amazed the mcu’s survived these events without needing surgery)  With younger students, I suggest that you pre-solder a 10k limit resistor directly to the ground line of the LED’s before you hand out the parts so that there is no way to make this mistake. They will still hook the thing up wrong, and three color led’s will light up with unusual color combinations if you ground any of the 4 lines, but I don’t think we lost any digital pins that way.


Addendum 2016-03-10

Well looks like someone sent this post to Scrbd. I guess that means you can download it as a PDF from there.  Slightly annoying to see advertising over top of something that is being given away free, but more so that their page comes up higher in search results than the original. Though I guess it’s all good in the end, if it helps more people get started with their logger projects.


Addendum 2017-12-17

After you’ve built your logger you will probably want to add some sensors to it. To get some pointers on how to do that pop over to Part 2 of the UNO logger series at:  Adding Sensors to an Arduino Data Logger

Cave Pearl Data Loggers at GSA 2015

We had two presentations at the Geological Society of America conference last weekend in Baltimore.  Trish spoke in the Karst Processes and Speleogenesis session about the challenges of new instrument development, and presented a snapshot of our growing long-term record which includes ocean sensors,  surface precipitation & cave drip monitors, with flow sensors inland and at coastal discharges:

Cave Pearl Logger deployment Record to Sept 2015

You can see attrition of the early prototypes pretty well in a graph like this.  We lost units from the 3rd generation of flow sensors due to epoxy failures, and much of the fourth failed due to pressure effects on our temperature sensors.  Despite having to wake for several hundred thousand processor interrupts,  the drip sensors are faring much better overall.  But I have been replacing them anyway, as the recent builds have much better power consumption. Even with improvements to each logger, you still reach a point where field logistics put a limit on how many units you can deploy with a small two person team.

While we aren’t at the whole catchment/watershed scale yet, we hope that our little DIY monitoring network will grow into the kind of coverage you see in Critical Zone Observatories.  Trish ended her talk by walking through some data from a very large storm event to show how it impacted the different monitoring stations. You could see the effect on people as they watched the individual sensor records building into a system wide picture of the hydrology.

Presenting the Cave Pearl loggers at the GSA conference 2015

There was a a lot of interest from younger academics, as they understand the potential for open source kit to help them compete with senior colleagues who can afford $5-10k for each piece of equipment.

That interest spilled over to the poster session the next day where I had a selection of different builds on display. I was a little embarrassed as many of these were rough early prototypes & bookshelf calibration units. (because all the really good loggers are currently out on deployment 🙂  There was a steady stream of people with questions that kept me at the poster all day and both of us were on deck for the huge crush of people at the end of the day. All that positive feedback was great for the ego, and it was especially nice to talk to people from other research groups working with the Arduinos. Each of us is tackling different questions, leading to a good diversity of hardware builds and approaches.

I think things are reaching critical mass because at this point many of the smaller independent projects people have been working on have seen enough field trials to cross the tipping point from rough prototypes to capable research equipment. DIY instrumentation will have a much larger presence at future conferences, and some of us have even started scheming about a whole session dedicated to it. If we can wedge it in between the teaching and the fieldwork schedule, perhaps next year we will bring the Pearls over to the AGU.

Addendum:

The conference generated enough interest to show up on the blog’s traffic: not so much as a change in the number of visitors, but as an increase in the number of pages being read:

I think pages per visitor is probably a better metric of interest, though I am sure humble stats like these don’t even count as a drop in internet bucket. But hey, you’ve got to start somewhere…

<— Click here to continue reading the story—>