

As this was a dry part of the cave, I even risked bringing in the laptop…
One of the first priorities was a trip out to Rio Secreto to service drip loggers. Data from the last season confirmed that all of the loggers are good for at least 6-8 months, so we now have the option of servicing some units, while leaving others for a later trip. As the install base continues to grow, that’s becoming an important consideration for the trip logistics. Even so, our schedule was pretty tight so we decided to try servicing the units ‘in-situ’, so we only had to make one trip.
Mapaches?
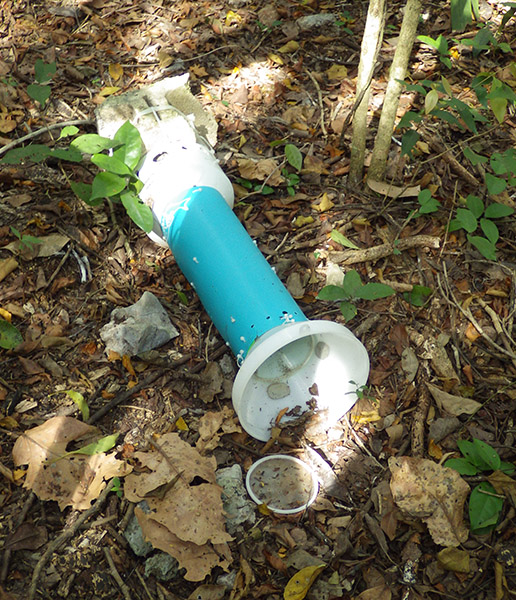
After that I tackled the climate stations we had on the surface. I was keen to see data from the logging rain gauges as this was only their second real-world deployment. Back in Dec. we deployed two units, with one on the roof of a building, above the tree canopy, and one on the forest floor. My heart sank when I found that something had knocked the forest unit over, despite a fairly hefty cement anchor. That happened only a couple of weeks before our retrieval, so we still had a fairly complete data set.
Our original thought was to use the comparison data to see how much rainfall was being intercepted by the canopy, but the sheltered forest floor record also ended up providing me with some vital information about how wind was affecting the rooftop unit:

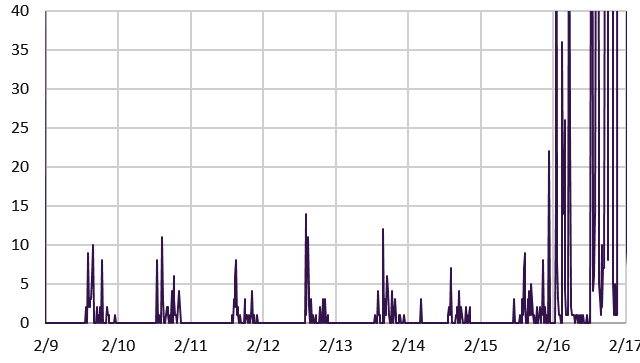
The ground unit had none of these 0-15 count spikes which peaked at mid-day (local time).
The drip counter inside the rain gauge is essentially using it’s accelerometer as a vibration sensor, which gave us in-cave sensitivity down 12cm drip-fall distances. So it probably should have occurred to me that we needed to reduce the sensitivity for surface applications. The daily noise is pretty easy to threshold away in Excel with an if statement [ =IF(DataCell-threshold<0,0,DataCell-threshold) ] and different settings showed that the typical daily ‘background noise’ was adding about 10%. I’ve even heard that funnel wetting & other losses cause cheap rain gauges to under-report by that much, so this daily bump might come out in the wash. A thornier problem lies with the ‘windy day’ events, which produce the larger spikes. And that effect is probably embedded in the rain storm data as well. Though with ~10 drops counted per mL of water through our funnel, actual rain events usually count up into the thousands. So I can apply pretty aggressive filtering (with thresholds around 200) and doing so hints that the stronger wind events are probably adding another 20% to the overall totals. I know that’s sounds pretty bad, but hey – it’s a prototype right?
So there are a batch of sensitivity trials ahead, and once again I need some external data to calibrate against. Of course anything that can count accelerometer alarms can just as easily be counting reed switch closures, so it’s back to the bench I go… 🙂
Spotted in Tulum:

Signal-to-noise ratios…
