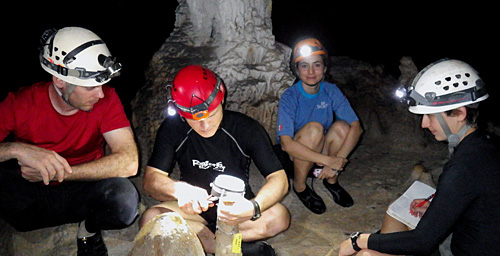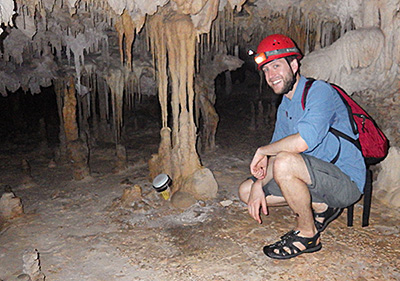
I pressed Everett (a Northwestern grad student) into helping me with the manual counts when I collected the drip loggers.
In March my wife led a Northwestern University earth sciences trip to the Yucatan Peninsula. While she was busy with all the necessary preparations for the students who would be arriving shortly, I slipped away for a couple of hours to retrieve the loggers we left at Rio Secreto last year. With so many new units in that deployment, I was really chomping at the bit to see how they faired.
As usual we had some good news, and some bad news from the deployed loggers. Actually, we probably set a new record on the bad news side of things as the two relative humidity loggers that I cobbled together before the December trip went bananas as soon as we brought them into the caves. The HTU21D sensor on unit 030 died on Dec. 20th, one single day after it was deployed, while the sensor on 028 lasted for four days before it pooped out. Both delivered crazy readings the whole time even though they seemed to be working fine on the surface.

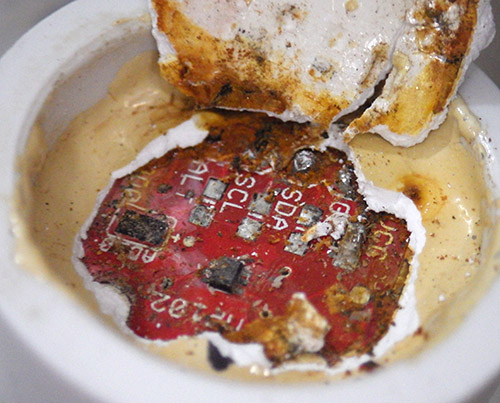
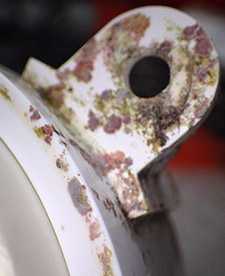
Even potted under epoxy, the solder contacts were severely oxidized. I suspect that moisture was able to “creep” along the surface of the breakout board, because of the area exposed around the humidity sensor.
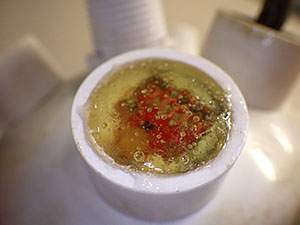
The epoxy in the sensor wells had turned yellow & rubbery, even though it was clear and rock hard when the units were deployed . But these sensor caps were assembled just days before the flight, and I used 5 minute epoxy to speed the build, rather than the usual 30 minute stuff. So I am thinking that the moisture resistance of the faster curing epoxies is much lower. Perhaps it’s time for me to investigate some new urethane options with lower permeability? It is also possible that PVC solvent residue interfered with the epoxy’s chemistry because I built them so quickly.

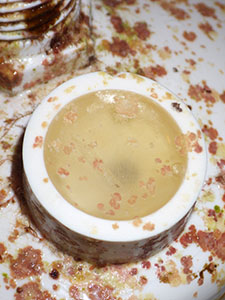
Despite its “splash proof” rating, this MS5805-02 died after one month in the cave. It had no “direct” water contact.
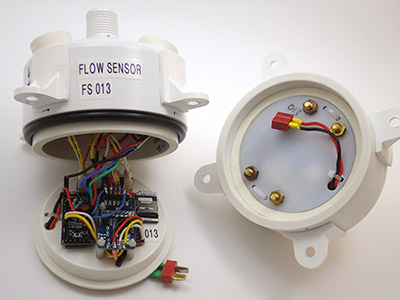
The loggers kept running after the R.H sensors stopped working but they eventually both quit long before draining the AA battery packs, which leads me to conclude that rusty contacts eventually shorted the I2C bus, preventing the RTC alarms from being set. We also lost one of the pressure sensors, and a TMP102 board. In fact the only sensor still fully operational when I pulled the loggers was the MS5803-02 pressure sensor, once again showing just how robust those pressure sensors are under their white rubber caps.
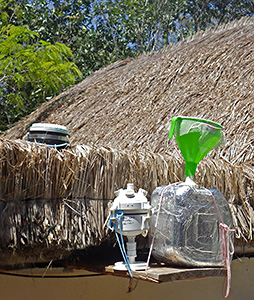
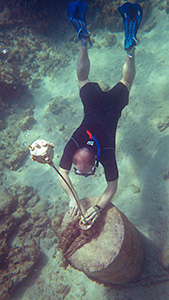
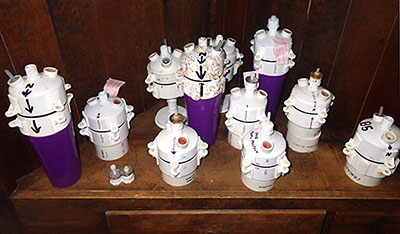
The white ball is an older first gen housing for an underwater pressure unit, and the black cylinder above is a drip sensor, acting as a crude rain gauge. I don’t know who collected the rain water.
I left a new RH&Pressure unit in the cave, which was made with E30CL and had more than a month of test runs under its belt before going into the field. Even with fully cured epoxy, there is still the possibility that moisture will penetrate through the exposed RH sensor, so I will look into moving that sensor off the main housing for my next builds.
We also had some sensors on the surface during this last deployment, and they faced dramatically different challenges under the full tropical sun. The pressure logger had been re-purposed from a four month cave deployment. It sported a DS18b20 temp sensor, and an MS5803-05 pressure sensor, which both performed beautifully in the underwater environment.
But as you can see from the pressure record (in mBar) things did not go so well this time around:

I was expecting daily fluctuations of a few millibars so there is no way I can believe that local highs reached 1200 mBar…but what happened? This pressure sensor had been used first for an under water deployment so it had a layer of Qsil silicone over top if it. This caused a -50 mbar offset, but did not seem to give us any other problems in the thermally stable cave environment. But with full sun exposure this logger saw huge daily temperature variations (detailed below) I believe this caused the silicone above the sensor to expand and contract; exerting enough physical pressure to overwhelm the more subtle barometric readings. Unfortunately I did not have time to look at this data while we were in the field, so the unit was redeployed, although this time in a more sheltered spot under the palapa roof.
Now for the good news:
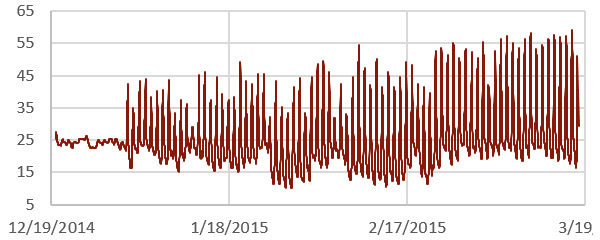
The drip sensor which we left beside that pressure logger on the surface delivered a respectable record despite the fact that it had no collecting funnel:

That peak of 8000 counts (/15 min.) is about 9 drips per second on the surface of the unit which, with all the delays I put in the code to suppress double count artifacts, might be approaching the max response of the sensor itself. With no way to capture the water, gentle foggy rain events would not have triggered the impact sensor, so there is a good chance that a significant amount of precipitation did not get recorded. But what makes this record so impressive to me is the RTC temperature log from inside the housing: (in °C)

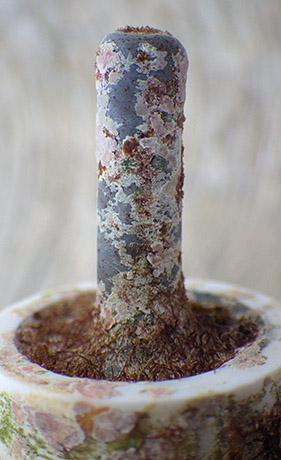
The black end cap actually started melting grooves into the white PVC of the drip logger housing.
The spec sheet maximum for the DS3231 is 70°C, and the Arduino mcu‘s limit is 85°C. Even so, with daily peaks reaching nearly 60° I am quite surprised that the batteries did not pop. The little logger did not escape this trial by fire completely unharmed, as the micro SD card went from a nice low current sleeper to pulling around 1 mA all the time. The data was intact, but I can only surmise that the high temps cooked some of its control circuitry. The upper ABS surface also changed from a neutral frosted white to a slightly fluorescent green/yellow color, presumably because of intense UV exposure. After replacing the batteries & SD card, the unit was put back on roof for another run. Just to be on the safe side I added a second unit in case that first one gives out.
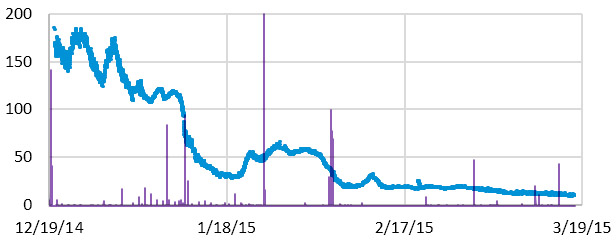
While I leave heavy weight analysis of the hydrographs to the expert on the team, I couldn’t help peaking to see if these surface storms affected the in-cave drip flow rates. I was quite surprised to see that the precipitation events had small effects on some of the counts, while barely registering as a blip on others that were quite nearby. This is the record from DS20 (15 min bins, with a purple overlay of surface record that is not on the same scale):
And this is the record from DS02, located less than 5m away in the same chamber:
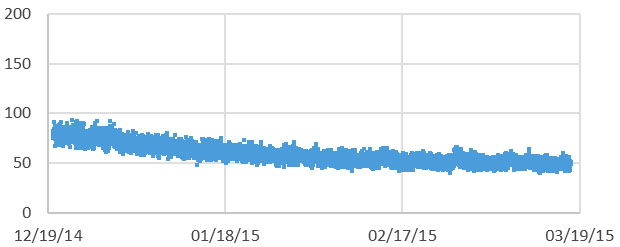
Given the thin soils of the area,I suspect that much of that brief rain evaporated shortly after surface contact, or the dry season vegetation was just sitting there like a sponge, able to absorb most of it quickly.
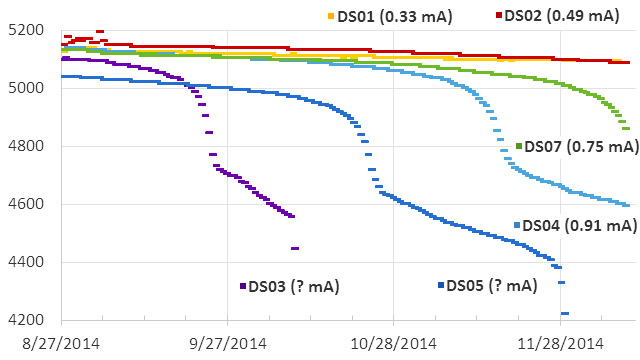
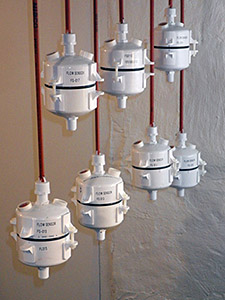
The whole group of loggers represents a mixed bag of first and second generation builds with many different “mini” form factor Arduino boards in them. I left the batteries in a couple of units back in December so I could see some longer term battery discharge curves:
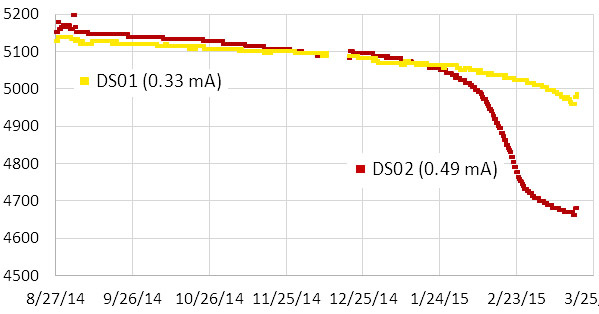
These two units were using three lithium AA’s, which I knew from the 1st generation test results, are about 2/3 depleted when they hit that 5000 mV shoulder. This tells me that DS01 would probably have delivered nine months of operation on these cells. This is very good news because even the loggers I built with no-name eBay clones (MIC5205 v.regs) sleep around 0.33 mA if they have good SD cards. So it should be safe to put them on a six month rotation schedule.
In addition to their drip counts, several of the loggers were running with different eeprom buffering levels to help me understand how this affected the power budget. I won’t wade into all of that data here but two of the most directly comparable records are from units 26 & 27:
| Logger # |
starting voltage |
sleep current
|
# records buffered |
V.drop/8500 records |
| 26 |
5243 mV |
0.28 mA |
512 |
30 mV |
| 27 |
5198 mV |
0.26 mA |
96 |
33 mV |
Unit 26 was handicapped by a slightly higher sleep current and a starting voltage above the lithium plateau (I often see a small quick drop on 3xAA lithiums above 5200 mV) The fact that it still delivered a smaller voltage drop on the batteries over the three month run implies that increasing the size of the eeprom buffer does improve performance. Logger 26 had a 32K eeprom so it only experienced 16 SD card writing events, while the smaller 4K buffer on unit 27 required 87 SD writes. Both loggers created six separate log files during the run and the cumulative drip counts were comparable. It’s still a close call, and the increased buffering does not providing a huge savings, perhaps on the order of 5-10%. Since the extra I2C eeproms only cost $1.50, and the coding to support them is trivial, I consider that to be an easy way to get another month of run time. As with the buffering tests I did back in 2014, it’s clear that all those eeprom page-writes (3mA x 5msec + mcu uptime) take a significant amount of power. But at least they are not subject to the random latency delays you see with SD cards.
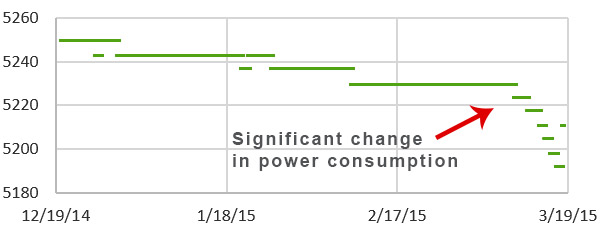
I added larger LED limit resistors to each logger on this service visit, so even if the drip rates pick up dramatically during the wet season, power used by the interrupt will be reduced compared to the runs since August. All units that were capable are now buffering about five days worth of data to the eeproms. The current crop of “best builds” with Rocket scream boards and pin-powered RTC’s, are getting down to 0.15 mA, implying that they should be good for a year long deployment provided the SD cards & sensors hold out. Of course I don’t count chickens anymore, no matter how good the numbers look. Though all units delivered a full data set on this deployment, two of them suffered dramatic increases in sleep current when their ADXL’s suddenly started consuming more power. You can easily spot when these kind of sensor failures occur by looking at the power supply voltage log:
I am sure there are more gems buried in the data, which I will post here as they are uncovered.
<— Click here to continue reading the story—>