Monthly Archives: April 2016

Field Report 2016-03-25: Collecting Data in Coastal Mangroves

Their never too young to be a field assistant :-)

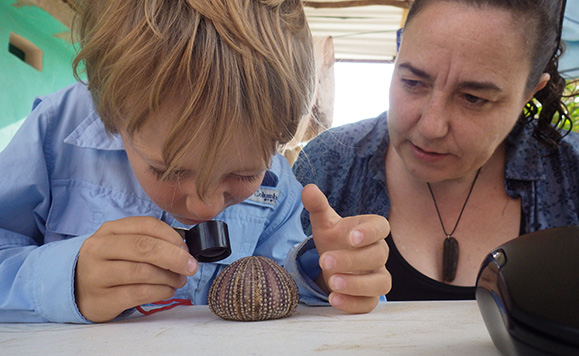
They are never too young to be drafted as a field assistants… Eh Trish?

The unique geology of the Yucatan means that hydrologists like my wife typically study water flowing through the flooded cave systems.  But she also advises some of the many great archaeology projects in the area (The Maya had to get their drinking water from somewhere…right?) so we don’t spend all of our time wrapped in neoprene.  Though I have to say that when she does do surface work, she always seems to find the stinkiest stuff around to balance all that canned-air we would otherwise be breathing:

Smells like science!

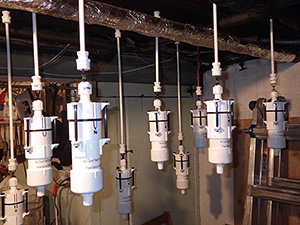
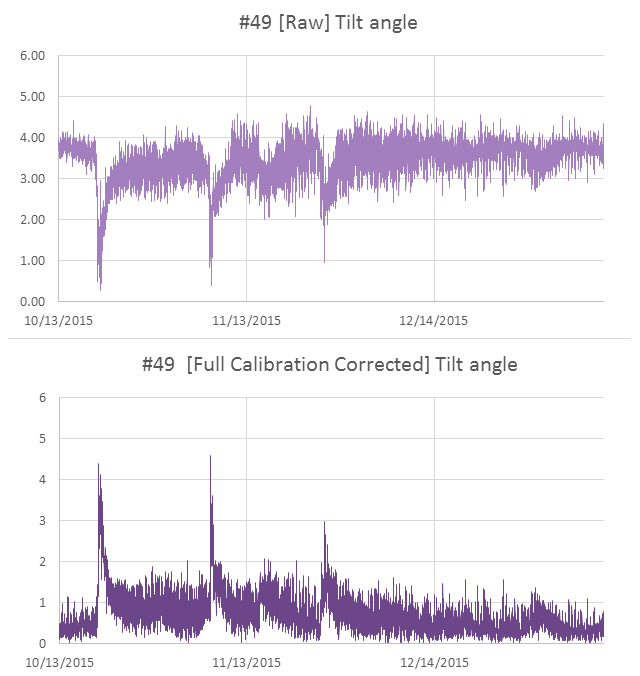
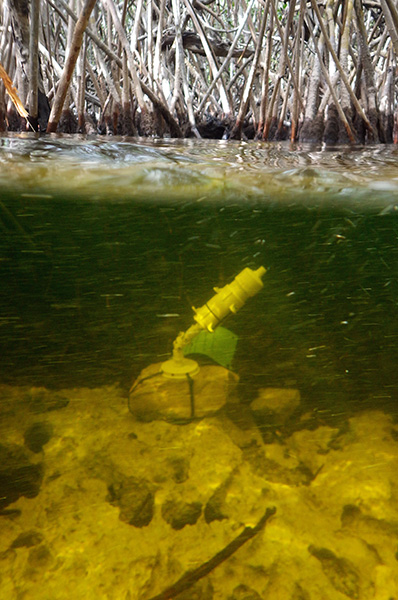
We did eventually make our way to a wider section where the water was moving swiftly.  The original plan was to simply anchor one of the flow sensors on a rock and drop it in. But after mucking about at the site for a while, we were puzzled to see hardly any displacement on our little tilt meter though the surface flow was quite strong.  Then we realized that the water at our feet also felt warmer than it did on the surface, and it dawned on us that this close to the ocean, the tide was coming in underneath the outgoing fresh water.  The best solution I could come up with on the spot was to put the pivot joint on top of one of the pendulum rods: raising the flow meter to a higher position in the water:

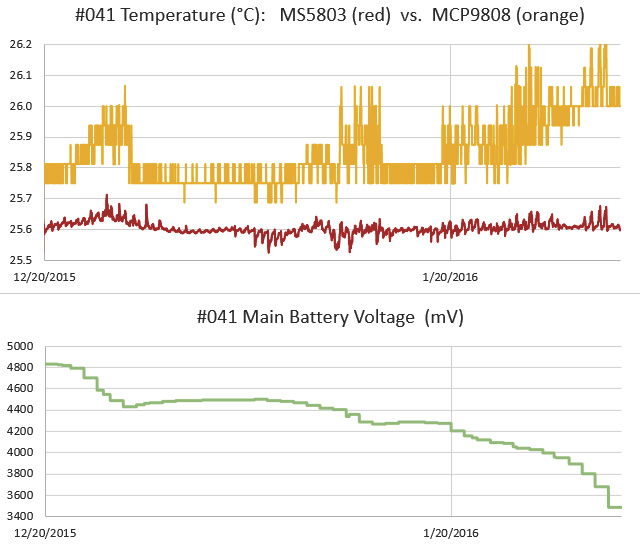
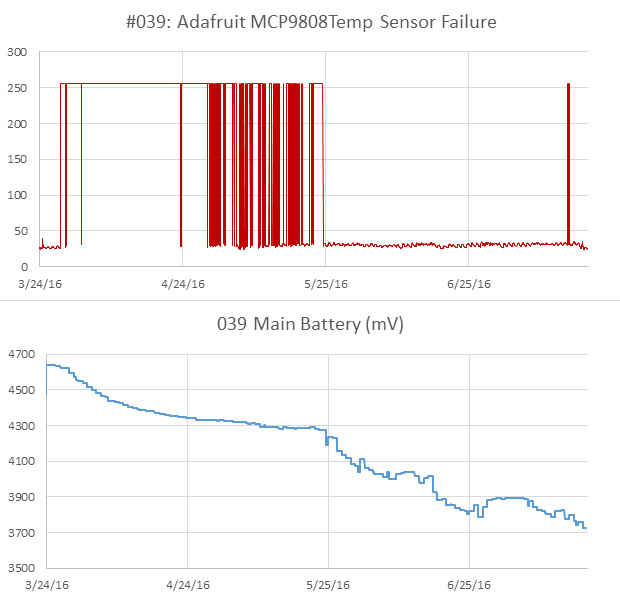
We will have to wait for the data to see if we’ve given the logger enough height and The temperature should tell us if the logger has been trapped in rising salt water.  I would not be surprised if we end up using an entirely different arrangement next time, perhaps with some kind of floating buoy system so we can go back to a pendulum arrangement where the buoyancy is easier to control.  Sometimes all you get from your first deployment, is an understanding of how to do the next one…

BottomDeployment_600

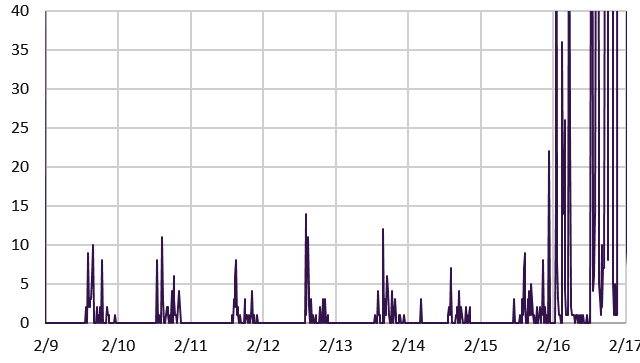
Further in, we could put the logger right on the stream bed which had been scraped clean by the high water velocity. You can tell from the video (above) that we are well past 10cm/sec where vortex shedding starts to be a problem.

The next day we set out at a different river, working our way much further inland to (hopefully) avoid the salt water intrusion.  We also planted a pressure unit to capture water level data near the archaeological dig site.  Given how exposed these sensors are, I can only hope that the local fishermen don’t decide our little bots should spend the rest of their days decorating someones coffee table.

The water in these coastal discharges was racing by comparison to the gentle subterranean flows we usually work in, so I expect allot of turbulent noise in the signal. On top of that the removal of their salt-water ballast mass (used on pendulum installations) moved the center of mass enough that I had to put them in upside down. That’s just the kind of things you run into when you are doing something for the first time. With all the things we learned from the open ocean deployments, I’m really excited to see the Pearls moving into another new environment.

Addendum 2016-07-18

Well we finally made it back up to the north coast, to replace those upside-down units we left back in March:

Happy to report that the first deployment gave us good data, and I think this next crop will do even better, provided they don’t get hit by a passing boat propeller…

Addendum 2017-06-24

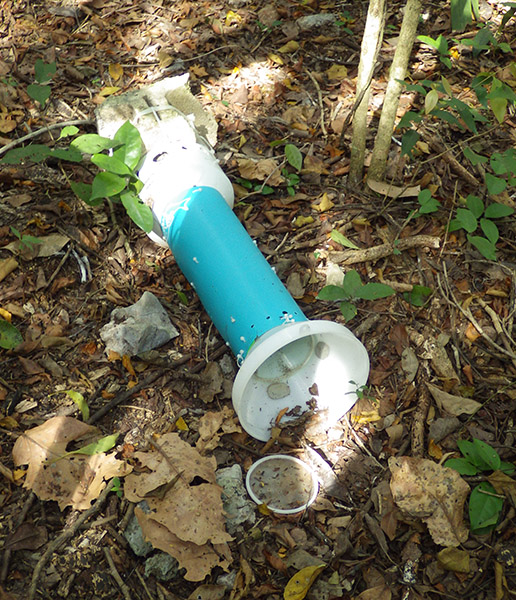
Believe it or not the unit was still buoyant, and gave us reasonable data.

After nearly a year we returned to discover that the stream-bed unit pictured above had gone AWOL, and the remaining two flow sensors were heavily encrusted with criters of all kinds. We’d seen bio-growth before on reef deployments, but never to this extent. To avoid further losses, the replacement sensors have been painted black and deployed in “stealth mode” locations.


Addendum: 

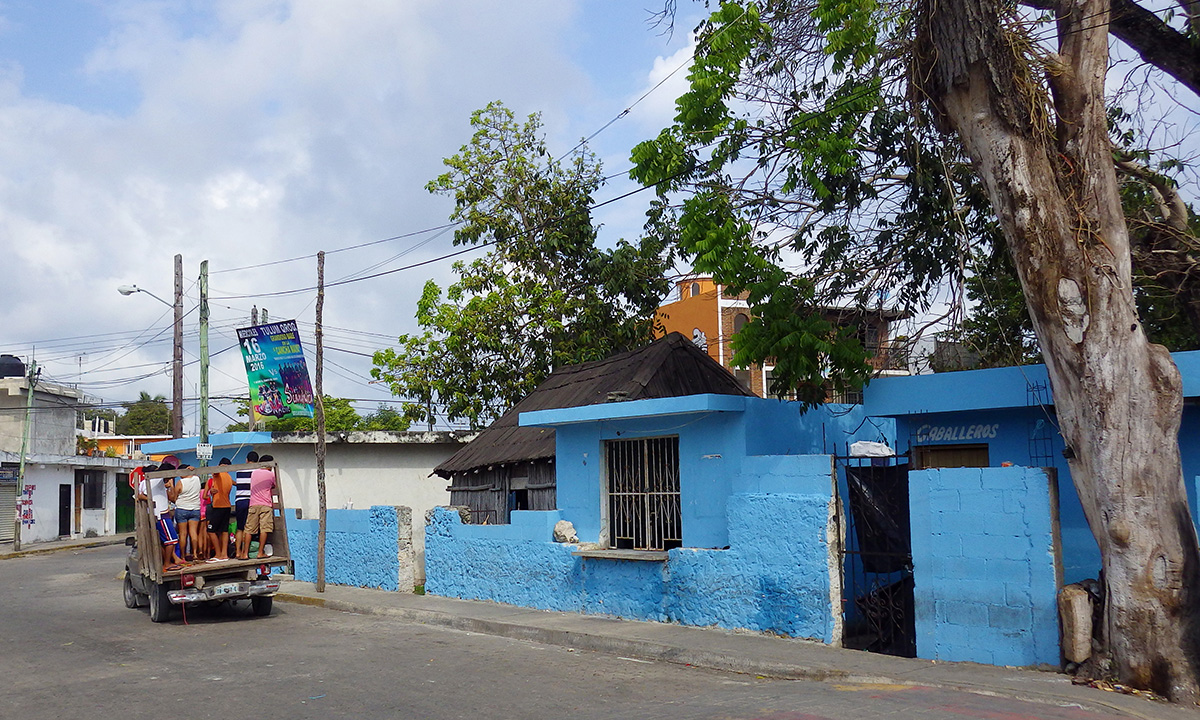
During these deployments we stayed in the fishing village of Chiquila.  I spotted this lovely graffiti during a morning run:

JellyFish

<— Click here to continue reading the story—>

Field Report 2016-03-17: MCP9808 Temperature Sensor Fails Under Pressure

Cave Pearl data loggers

In this shot you can really see how the addition of the drag flag amplifies the tilt signal.

Then next day saw some routine logger replacements at our favorite coastal cave. It’s relatively shallow, making it a good place for a shakedown dive, and we have plenty of air time to develop funky new underwater deployment procedures for our little bots.  The fact that it’s also an un-decorated mud pit is just gravy, as it means that no one bothers our instruments like they would in the prettier high-traffic caves.  Strong tidal influence also provides a good range in the data and this cave has been continuously instrumented since our alpha trials back in 2013.

Of course that also means this location has seen more instrument failures than anywhere else, and again it delivered some bad news with the good: showing that even a great sensor can eventually crack under pressure:

MCP9808 pressure failure brings down the logger

This logger had been performing well since mid 2015, and initial consumption curves indicated it should go a year or more on 3AA’s. But we had some hints in the last dataset that the temp sensor was struggling, and this time it burned through a set of batteries in less than six weeks, with the 9808 reporting imaginary temperature excursions very similar to those we saw from the TMP102 failures last year. Each was accompanied by a significant hit to the power supply, which would imply that we probably had some kind of pressure induced self heating going on inside the IC. (perhaps because of a short?)

The suspect MCP9808 (upper left). I have moved away from these large surface area sensor wells as I think they might be subjecting the sensors to larger bowing forces at depth.

The wonky MCP9808 after 9 months. On newer builds I have moved away from high surface area sensor wells as I think they might subject the sensors to larger bowing forces at depth. The LED also became flaky, with only the blue channel still operating.

That’s a bit of a bummer, because the MCP’s offer better off the shelf accuracy than most of the other temperature sensors in that price range.  So unless I want to put the breakout inside the housing, I’m forced back to the humble DS18B20’s that I used at the beginning of the project. I had a feeling this might happen, so on this trip we deployed a special 3-sensor cap on one of the loggers, with sensors inside the body, embedded in epoxy, and one projecting directly into the water. Hopefully that will let me determine how much lag we get from moving the temp sensors inside the pvc shell.  Since we typically don’t take readings more than once every 15 minutes, I’m hoping we don’t see much effect from the different arrangements.  During basement testing, thermal inertia rounded off short temperature peaks significantly, but that was at a five minute sampling interval, in air rather than water. 

Even with calibration you need some way to determine your mounting offset...

Even with calibration, you still need some way to determine the mounting offsets.

All three flow sensors delivered beautiful records, and the worst build actually  provided the best insight into the need for sensor calibration. Logger #69 had a 5° tilt error due to an adhesive failure during the build.  At that time I was still learning how to calibrate the sensors, so I was doing estimates of sensor mounting  offsets by simply averaging the readings from an overnight test where I hung the logger on a pivot joint.  The relatively large error on #69 meant that I almost rejected that sensor cap outright, but I figured we should put the unit in a high velocity site to test if it was still usable.   I later did a full calibration on that unit (with Magneto 1.2 software) to generate a more complete set of axes bias & scaling factors.

With the latest flow data in hand, I could now see how much difference the extra effort of full calibration makes:

TiltAngleCorrections

Those two corrected sets differ by a maximum of 0.5 degrees, implying that I can generate pretty good correction factors for older gen units in the field by simply hanging them in a closet over night. This also gives me a way to keep tabs on sensor drift without completely reprogramming the loggers, which I usually don’t have time for during fieldwork.

This is probably ‘good enough’ for our high flow sites, but for the deeper saline deployments (where the flows creep along in the sub-cm/second range) I’ll probably have to go full Monty since half a degree might be a significant portion of the total signal. And I have accumulated enough compass calibrations by now to show that in comparison to the  well behaved acclerometers,  magnetometer correction factors are all over the map with bias & offsets sometimes approaching 20%.


Spotted in Tulum:
TiltAngle

Working with a five degree mounting offset…


Addendum 2016-04-10:

Still processing the data from this last trip, and I found a good example from of one of those low flow systems, where the full calibration was needed to correct the axes bias errors:
Cave Pearl data loggers

Once you get down into the weeds, the factory offsets are larger than your signal, potentially hiding the phenomenon you are looking for. And you still have the challenge of filtering out the relatively high acclerometer noise, without destroying the more subtle tidal signals…

Addendum 2016-04-30:

I can only imagine what kind of incredible calibration challenges faced the people who made first direct observations of a gravitational wave, but I think I’m beginning to understand the sentiment behind this awesome tattoo…

Addendum 2016-05-06:

Hackaday just posted about an elegant new tilt sensor idea, using a variable differential transformer filled with ferrofluid. This principle of variable inductive cores has been used for years by YSI to detect salinity, but seeing this fellows approach makes me want the look at the technique again, if I can figure out a way to reduce the power consumption…

Addendum 2016-07-30:

We had another MCP9808 from that gen.  go down, but this time the power curve was the exact opposite of what I am used to seeing for IC sensor failures:

interesting power curve with temp sensor failWhile the sensor was throwing out a string of ‘Maximum Reading’ errors, the power consumption for the logger was normal. Then the sensor started delivering normal data again, but was obviously drawing enough juice to take the rest of the logger down quickly. Weird…

<— Click here to continue reading the story—>

Field Report 2016-03-16: Rain Gauges Over Reporting

Fer_RioExchange

As this was a dry part of the cave, I even risked bringing in the laptop…

One of the first priorities was a trip out to Rio Secreto to service drip loggers. Data from the last season confirmed that all of the loggers are good for at least 6-8 months, so we now have the option of servicing some units, while leaving others for a later trip. As the install base continues to grow, that’s becoming an important consideration for the trip logistics. Even so, our schedule was pretty tight so we decided to try servicing the units ‘in-situ’, so we only had to make one trip.

The forest floor gauge was knocked over by critters, despite a fairly hefty anchor.

Mapaches?

After that I tackled the climate stations we had on the surface. I was keen to see data from the logging rain gauges as this was only their second real-world deployment.  Back in Dec. we deployed two units, with one on the roof of a building, above the tree canopy, and one on the forest floor. My heart sank when I found that something had knocked the forest unit over, despite a fairly hefty cement anchor. That happened only a couple of weeks before our retrieval, so we still had a fairly complete data set.

Our original thought was to use the comparison data to see how much rainfall was being intercepted by the canopy, but the sheltered forest floor record also ended up providing me with some vital information about how wind was affecting the rooftop unit:

F

TypicalDailyWindNoise

The ground unit had none of these 0-15 count spikes which peaked at mid-day (local time).

The drip counter inside the rain gauge is essentially using it’s accelerometer as a vibration sensor, which gave us in-cave sensitivity down 12cm drip-fall distances. So it probably should have occurred to me that we needed to reduce the sensitivity for surface applications.  The daily noise is pretty easy to threshold away in Excel with an if statement [ =IF(DataCell-threshold<0,0,DataCell-threshold) ] and different settings showed that the typical daily ‘background noise’ was adding about 10%.  I’ve even heard that funnel wetting & other losses cause cheap rain gauges to under-report by that much, so this daily bump might come out in the wash.  A thornier problem lies with the ‘windy day’ events, which produce the larger spikes. And that effect is probably embedded in the rain storm data as well.  Though with ~10 drops counted per mL of water through our funnel,  actual rain events usually count up into the thousands.  So I can apply pretty aggressive filtering (with thresholds around 200) and doing so hints that the stronger wind events are probably adding another 20% to the overall totals. I know that’s sounds pretty bad, but hey – it’s a prototype right?

So there are a batch of sensitivity trials ahead, and once again I need some external data to calibrate against.   Of course anything that can count accelerometer alarms can just as easily be counting reed switch closures, so it’s back to the bench I go… 🙂


Spotted in Tulum:

Signal2Noise

Signal-to-noise ratios…

<— Click here to continue reading the story—>